
eCommerce
What is sell-through rate? The inventory-velocity formula every ecommerce operator should track
Sell-through rate (STR) is units sold divided by units received, expressed as a percentage, measured over a defined period. The healthy DTC band is 70 to 80 percent per period; beauty brands often reach 75 to 90 percent. Below 40 percent is the warning zone where markdowns and excess storage costs start compressing margin faster than top-line growth can absorb.
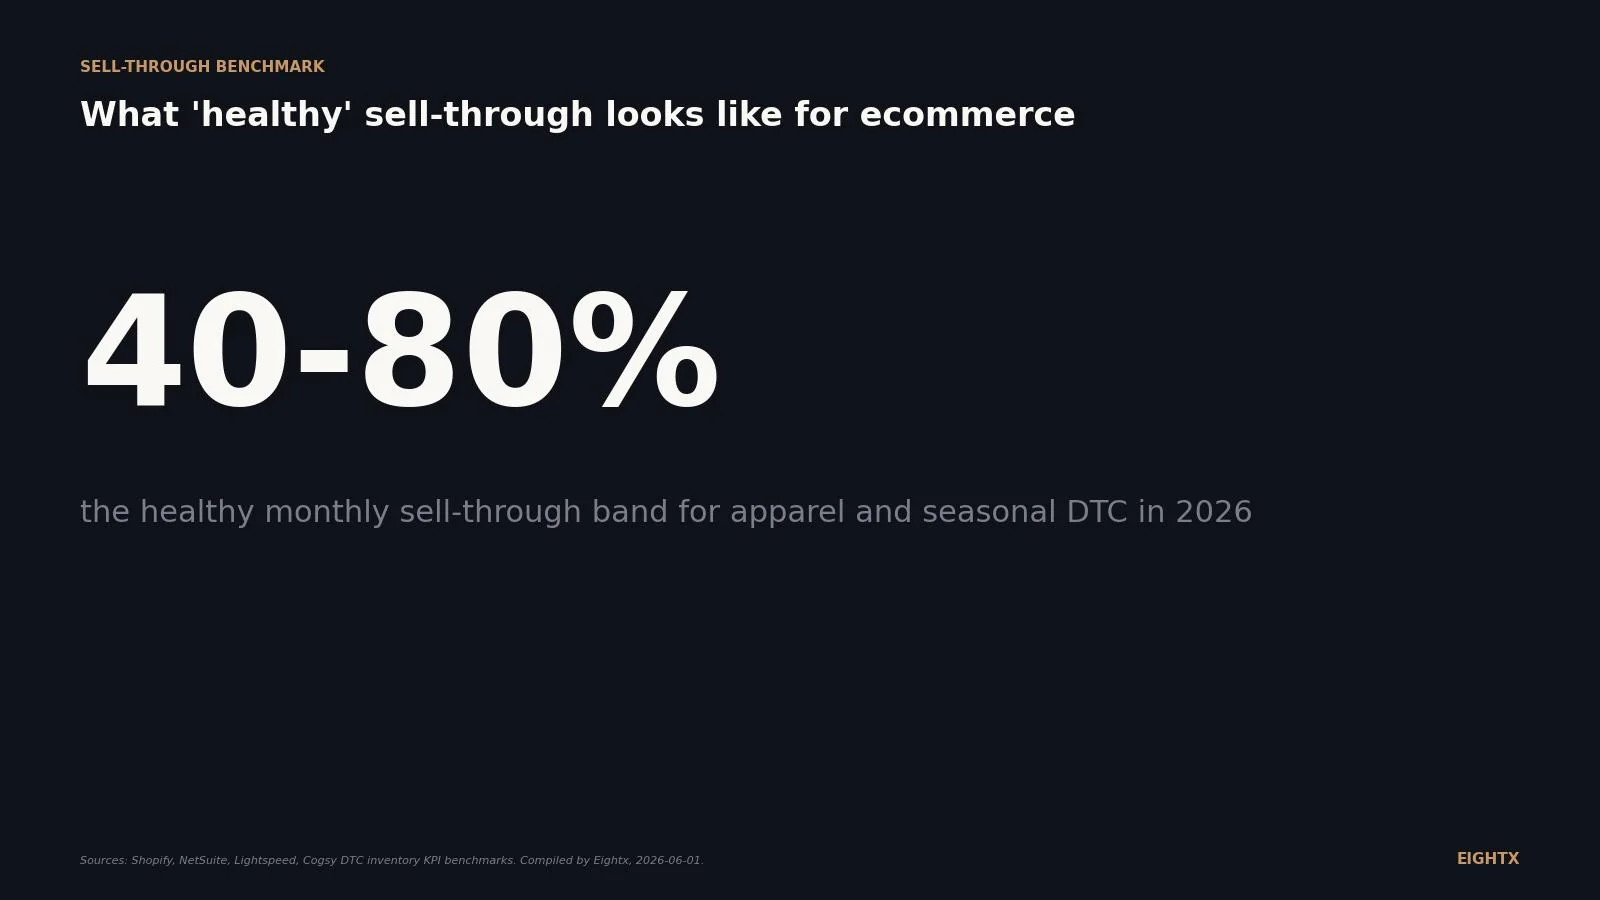
Sell-through rate (STR) is the percentage of inventory you sold in a period, divided by the inventory you had available to sell. For ecommerce and direct-to-consumer (DTC) brands, the broadly published healthy band is 70 to 80 percent per period for general retail (Shopify Retail), with apparel and fashion sitting at 65 to 85 percent and beauty and consumables at 75 to 90 percent (WearView, corroborated by Toolio). Below 40 percent per period is the consistently cited warning zone for overstock or weak product (Lightspeed, WearView, Carriyo). The mistake most operators make is measuring across blended SKUs, which buries the slow-moving inventory that is actually eating their cash.
Sell-through tells you whether you bought the right amount of the right thing. Days of inventory on hand tells you how long stock will last. GMROI (gross margin return on investment) tells you the dollar return per inventory dollar. Sell-through is the leading indicator that sits in front of both, because by the time days-on-hand spikes or GMROI sags, the cash is already trapped. On a $20 million brand running 55 percent cost of goods sold (COGS) and carrying 30 percent of annual COGS in stock (so about $3.3 million of inventory at cost), a 10-point drop in monthly sell-through across that quarter's receipts leaves roughly $275,000 of unsold goods at cost and another $80,000 to $140,000 of margin damage once it hits markdown. The dollar figure changes with your COGS percentage; the operator point does not.
How it works
The canonical formula is units sold divided by units received, multiplied by 100 (Lightspeed). Shopify Retail publishes the equivalent stock-on-hand variant: (Total sales divided by stock on hand) multiplied by 100. Use the units-received denominator when measuring a specific buy. Use the stock-on-hand denominator for evergreen reporting. The standard period is 30 days for most retailers (Lightspeed), monthly per SKU or per category for apparel (WearView), and daily or weekly for fast-moving consumables (Accelerated Analytics). Worked example: an apparel brand receives 5,000 units of a new style on May 1 and sells 3,200 units by May 31. Sell-through is 3,200 divided by 5,000, which is 64 percent. That sits inside the apparel 65 to 85 percent band. Now run it on a slow-mover that received 5,000 units and sold 900: sell-through is 18 percent, which trips the below-40 warning and means the remaining 4,100 units need a discount plan or a clearance channel before the next season's buy lands. Three caveats most operators miss. (1) Returns: Carriyo states "STR usually excludes returns." Most vendors compute STR gross, with returns tracked as a separate rate. If your category runs a 25-plus percent return rate (apparel), pull a net-of-returns view alongside the gross. (2) Pre-orders and backorders: units sold-but-not-yet-received should not sit in the denominator. Wall Street Prep defines stock on hand as inventory "available for sale," excluding products awaiting pickup. The same rule applies to in-transit and backordered units. (3) Staggered receipts: if 5,000 units land across the month (1,000 on day 1, 4,000 on day 20), the all-at-day-1 assumption overstates STR. Use a weighted-average denominator or measure on a receipts-to-date basis.
Common triggers
- You are placing a re-order and need to know whether the first buy is moving fast enough to justify a second.
- Your warehouse is full, your bank balance is tight, and you need to figure out which SKUs are the problem.
- You are heading into a seasonal peak (holiday, back-to-school, Q4) and need a leading indicator before days-on-hand blows out.
- Your 3PL or operations team is asking which styles to mark down, liquidate, or move to a clearance channel.
- You are negotiating with a wholesale buyer or retailer who wants weekly sell-through reporting as a condition of the purchase order.
The most common mistake
Measuring sell-through across blended SKUs at the brand level instead of at the SKU or style-color-size level. Blended sell-through hides the long tail. A brand can show a healthy 70 percent blended monthly sell-through while 30 percent of its individual SKUs are stuck under 20 percent, which is the inventory that ties up cash, triggers markdowns, and forces emergency clearance. Always run sell-through at the SKU level for new styles, weekly for fashion and seasonal goods, monthly for evergreen. The companion mistake is forgetting to net out returns (apparel and footwear in particular) and counting in-transit or pre-sold units in the denominator (drop-ship, pre-order DTC). Both inflate STR and hide cash problems. For the broader inventory picture, layer STR with inventory turnover, GMROI, and days inventory on hand. STR is the leading signal; the others confirm the cash story.
Browse the full ecommerce finance glossary for every metric and money term a DTC operator needs.
Frequently Asked Questions
what's a good sell-through rate for ecommerce in 2026?
70 to 80 percent per period is the broadly cited healthy band for general retail (Shopify Retail). Apparel and fashion sits at 65 to 85 percent (WearView). Beauty and consumables runs higher at 75 to 90 percent because of replenishment behavior. Below 40 percent per period is the warning zone for overstock or weak product (Lightspeed, Carriyo, WearView).
how is sell-through rate different from inventory turnover?
Sell-through is a percentage over a short window, usually one month, and it tells you how fast a specific buy is moving. Inventory turnover is units sold divided by average inventory across a longer window, usually annualized. Sell-through is the leading indicator. Turnover is the lagging summary.
does sell-through rate include returns?
No. Carriyo states it plainly: STR usually excludes returns. Most vendor docs compute STR gross and track returns as a separate rate. If your category runs a 25 percent or higher return rate (typical for apparel and footwear), pull a net-of-returns STR alongside the gross. The gap is where unit economics hide.
how do you handle pre-orders and backorders in sell-through?
Exclude units that are not physically available for sale from the denominator. Wall Street Prep defines stock on hand as inventory available for sale, not products awaiting pickup. Same rule for in-transit and backordered units: do not count them as received until they land. Counting them inflates STR and hides cash problems.
how often should i pull sell-through reporting?
Weekly for fashion, seasonal, and any new launch; monthly per SKU or per category is the standard apparel cadence (WearView). Most retailers calculate every 30 days (Lightspeed). For fast-moving consumables, daily or weekly is standard (Accelerated Analytics). Daily during peak sale events (Black Friday Cyber Monday, end-of-season clearance, major promo windows) so you can re-flow inventory or pause paid spend before stock-outs.