
eCommerce
Australian Ecommerce CAC Benchmark 2026
Australian ecommerce CAC in 2026 runs roughly 20% to 35% above the US average, with vertical bands of about A$40 to A$115 for beauty, A$90 to A$200 for apparel and above A$500 for luxury. Meta CPMs are cheaper here than the US, but a small, quickly-saturated audience pushes the cost of an actual customer up, not down.
Key Takeaways
- Australian DTC CAC runs roughly 20% to 35% above the US average (LoyaltyLion, UpCounting 2025). Against a global blended anchor near US$70 to US$78, that implies an AU-equivalent blended CAC of about US$84 to US$105. Treat it as a vendor estimate, not a government figure.
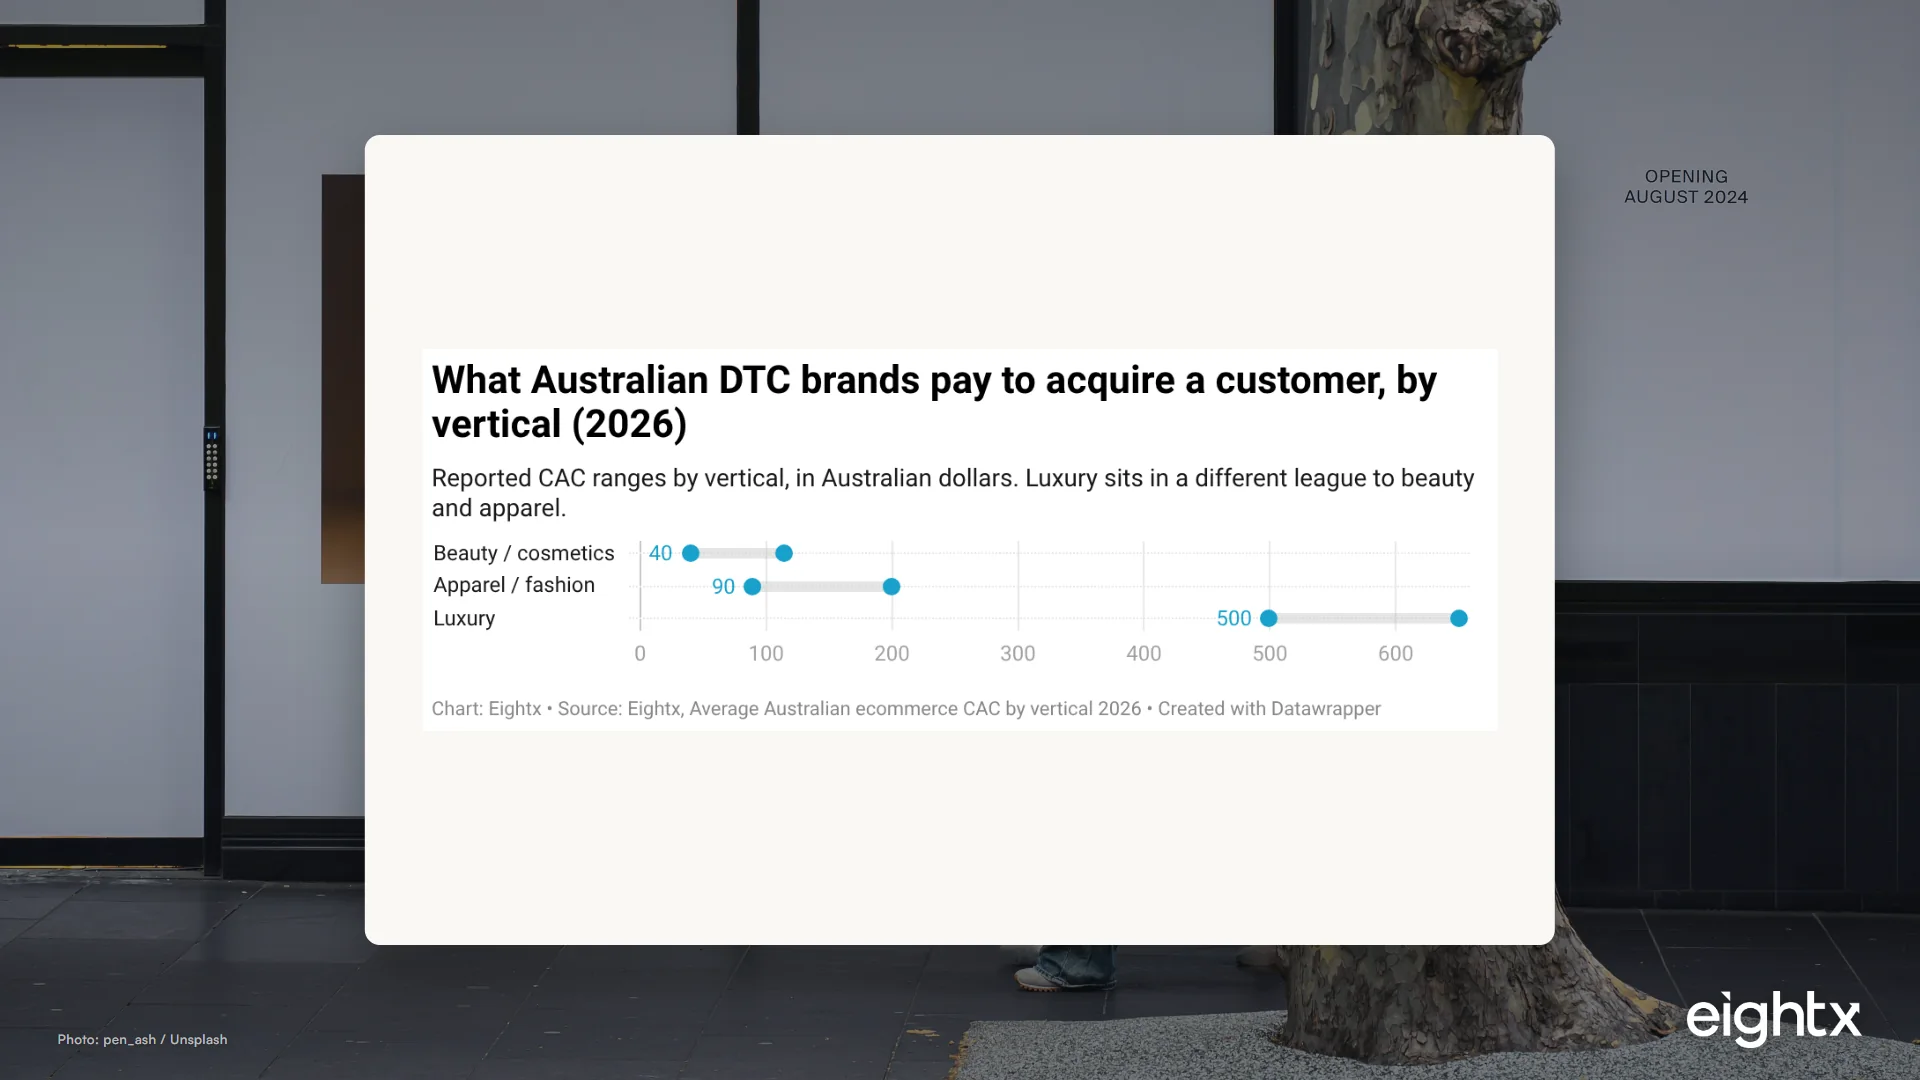
- By vertical, the AU bands are wide: beauty about A$40 to A$115, apparel about A$90 to A$200, luxury above A$500 (Eightx AU vertical benchmark 2026). Benchmark against your own vertical band, not a blended number.
- Meta CPMs in Australia are about 20% cheaper than the US (A$18.50 vs US$23.00) yet still roughly 80% above the UK (AdAmigo.ai 2026). Cheap impressions do not translate into cheap customers once you scale.
- The structural reason is a small, quickly-saturated audience. About 27 million people are being fought over by roughly 153,000 Australian Shopify stores (Storeleads, June 2026). Frequency and auction density climb fast past a few hundred thousand a month in spend.
- The macro is a tailwind, not the problem. Retail turnover hit A$37.9bn in June 2025, up 4.9% YoY (ABS), but real wages are barely keeping pace (WPI +3.2% vs CPI +4.1%). Discount-led first orders bite into already-thin first-purchase margin.
If you run an Australian DTC (direct-to-consumer) brand, you have probably stared at a US benchmark deck and concluded your acquisition is broken. CAC (customer acquisition cost, what you pay to land one new customer) is supposed to be lower than this. Everyone online says CPMs are sky-high in America, so surely a smaller, cheaper market should be easier. It is not, and the reason is the most counter-intuitive fact in Australian ecommerce: media here is cheaper than the US, but customers are more expensive. This is the 2026 Australian CAC benchmark, built on ABS national statistics, a Storeleads Australian store cut and the vendor CAC and Meta CPM reports that actually break the numbers out by country, not US figures with the labels swapped.
What Australian ecommerce CAC actually looks like in 2026
Start with the headline most operators get wrong. Across the vendor reports, Australian blended CAC is estimated at roughly 20% to 35% above the US average (LoyaltyLion, corroborated by UpCounting, 2025). Against a global blended anchor of about US$70 to US$78, that implies an AU-equivalent blended figure of roughly US$84 to US$105. CAC is not an official statistic anywhere, so treat that premium as a vendor estimate, not a government number. The useful part is the direction: up, not down.
A quick definition before the numbers, since this is the metric everything else hangs off: CAC is what you pay, all in, to land one new customer, total acquisition spend divided by new customers won. If you want a second pair of eyes on how your own CAC, payback and LTV actually fit together in your P&L, that is the kind of work our virtual CFO service does. This post is the Australian data line you can benchmark yourself against first.
But blended CAC is close to useless for a real brand, because a beauty store and an apparel store live in different worlds. Here is the vertical scoreboard.
| Vertical | CAC range (AUD) | Read |
|---|---|---|
| Beauty / cosmetics | A$40 - A$115 | Lowest band, helped by organic and creator demand |
| Apparel / fashion | A$90 - A$200 | Crowded auction, the squeeze most operators feel |
| Luxury | >A$500 | Different game entirely; high AOV carries it |
Two things to take from this. First, benchmark against your own vertical band, not a blended average that mixes a A$60 beauty customer with a A$600 luxury one. Second, a lower CAC vertical is not automatically a more profitable one. Beauty wins on acquisition cost but often loses on AOV and margin, so the verticals that look cheapest to acquire into are not always the ones that pay you back fastest. When I talk to founders running a brand this size, the first thing I do is throw out the blended number they have been beating themselves up with and replace it with the band that actually applies to them. A beauty founder panicking about a A$95 CAC against a US$70 global average is actually sitting mid-band for AU beauty; an apparel founder relaxed at that same A$95 is near the bottom of their range and probably has room to push.
Why your CAC is higher here than the US numbers you keep reading
Here is the structural argument the US deck never makes. Australia has about 27 million people. Storeleads counts roughly 153,000 active Australian Shopify stores, of which only about 3,592 are on Shopify Plus, plus another 82,500-odd on WooCommerce. That is a large, fragmented merchant base all bidding for the attention of the same small audience.
A small audience saturates fast. The first dollars of spend reach fresh eyeballs cheaply. But as you scale past a few hundred thousand a month, you start showing the same ads to the same people more often. Frequency climbs, the incremental customer gets harder to find, and the auction tightens because your competitors are fishing the same pond. That is why blended CAC sits above the US even when the cost of a single impression sits below it. America has expensive impressions but a vast audience you can keep finding new pockets of. Australia has cheaper impressions but a ceiling you hit quickly.
The pattern we see again and again is a founder who scaled to about A$200,000 a month in Meta spend on a US-shaped plan, watched CAC creep up quarter after quarter, and assumed the creative had gone stale. Sometimes it had. Just as often, they had simply saturated the buyable audience and were paying the frequency tax. No amount of new creative fixes a structural ceiling, and that distinction is the whole game.
Cheap impressions, expensive customers: the Meta CPM paradox
This is where the numbers get genuinely strange. Australian Meta CPM (cost per thousand impressions) sits at about A$18.50, roughly 20% below the US figure of US$23.00. So on a per-impression basis, Australia really is cheaper than America. The trap is assuming that flows through to CAC.
Look at where Australia sits against the UK, though. UK CPM is about US$10.31, so Australian impressions are roughly 80% more expensive than Britain's. Australia is only cheap relative to America, not cheap in absolute terms. And CPC (cost per click) follows the same order: about A$2.10 in Australia, US$2.69 in the US, US$1.95 in the UK.
| Metric | Australia | United States | United Kingdom |
|---|---|---|---|
| Meta CPM (USD) | 18.50 | 23.00 | 10.31 |
| Meta CPC (USD) | 2.10 | 2.69 | 1.95 |
| Blended CAC vs US | +20% to 35% | baseline | lower |
The lesson is that a cheap impression is not a cheap customer. Australia's digital ad market reached A$16.4bn in 2024, up 11.1% year over year (IAB Australia), so auction density keeps rising and the CPM gap versus the US is unlikely to widen in your favour. Betting your model on a cheaper first click is betting on a number the auction will not hand you once you matter. When we have struggled with this ourselves on a brand spending around A$120,000 a month, the thing that actually moved CAC was not bidding harder, it was getting more buyers out of the same impressions: a landing-page and offer rebuild that lifted conversion enough to pull CAC down close to 15% without touching the bid. The auction did not get cheaper; we just turned more of the impressions we were already paying for into customers.
The macro backdrop: a consumer still spending on thin real-wage gains
The good news is that the demand pool keeps growing. Australian retail turnover hit A$37.9bn in June 2025, up 4.9% year over year and 15.6% since January 2022 (ABS, current prices, seasonally adjusted). Online is about a quarter of all retail spend, with Australians spending A$82.6bn online in 2025 on Australia Post's measure. Measures differ: NAB's narrower index puts online nearer 14.6% of retail (about A$64.9bn in the year to July 2025), so treat the share as a band, not a point. Either way, the customer is still out there and still spending.
The catch is what the consumer has to spend. Wage growth (WPI) ran +3.2% year over year to Q1 2026 against CPI inflation of +4.1%, so real wages are barely keeping pace, if at all. A consumer whose purchasing power is flat is a consumer who needs a nudge to buy from a brand they have never tried, and that nudge is usually a discount. Discount-led first orders are exactly what erode already-thin first-purchase economics. You pay a structurally high CAC to acquire someone, then hand back 15% to 20% of the first order to close it. That is a hard way to make money on order one, which is the point of the next section.
How to benchmark and bring your CAC down
Stop importing US CAC targets. They will tell you that you are failing at something the market has made structurally more expensive. Instead, benchmark against the AU vertical band that applies to you, then solve CAC on the side you can actually control: payback and retention.
Here is the worked example, illustrative only. Take an apparel brand at the midpoint: a A$145 CAC, a A$110 AOV and a 60% contribution margin. The first order throws off about A$66 of gross profit, so it takes a little over two orders just to pay back acquisition. If your numbers look like that, you do not have an acquisition business, you have a retention business, and the second-order rate is the lever that decides whether you make money. Lift it and the same CAC becomes affordable. Leave it and no amount of cheaper clicks saves you.
Three moves do most of the work. Lift AOV with bundles and a free-shipping threshold set off your real basket, not an aspirational one. Push the second-order rate with post-purchase email and SMS flows so the first order is a down payment, not the whole relationship. And protect margin so each first order pays CAC back faster, which means resisting the reflex to discount your way to the first sale. For the AOV and broader KPI context that feeds the payback maths, see the Australia ecommerce KPI benchmark.
Australian DTC operators keep importing US CAC targets and concluding they are broken. They are not. Media here is cheaper than America but the audience is smaller and saturates faster, so the cost of an actual customer goes up, not down. The fix is not a cheaper first click the auction will not give you at scale. It is engineering the second order so the high first-order cost pays itself back.
Sources and methodology
The spine of this post is primary ABS data, pulled via the ABS Australia Statistics interface. Retail Trade is total retail turnover, current prices, seasonally adjusted, in AUD millions, running January 2022 through June 2025 (the latest point available at pull time): A$37,906.6M in June 2025 versus A$36,146.8M a year earlier, a 4.9% lift, and 15.6% above the A$32,794.8M of January 2022. Note the roughly twelve-month lag in the series; it is a backdrop line, not a live read.
The consumer cost base comes from ABS CPI and the Wage Price Index. All Groups CPI rose from a Q1 2022 base to Q1 2026 at +4.1% year over year, while the Wage Price Index (total hourly rates of pay, all industries) rose +3.2% over the same period. Real wages are therefore slightly negative on All-Groups CPI, so the honest phrasing is barely keeping pace, not comfortably positive.
The "about 27 million people" audience denominator is Australia's resident population, roughly 27.2 million on the ABS Estimated Resident Population series; we round it down for readability.
The store-base counts are a Storeleads Australian geo cut, pulled 2026-06-11: roughly 153,140 Shopify stores, 3,592 of them on Shopify Plus, and about 82,481 on WooCommerce. Numeric and category filters did not constrain the result set reliably in this pull, so we cite only the platform and plan counts and do not claim per-vertical store counts from Storeleads.
The CAC and media figures are vendor benchmarks, not government statistics, and are labelled as such throughout. The 20% to 35% AU-versus-US premium is a LoyaltyLion claim corroborated by UpCounting; the vertical bands are from Eightx's AU vertical benchmark; the Meta CPM and CPC figures are from AdAmigo.ai's 2026 country benchmarks; the A$16.4bn digital ad market and double-digit growth are IAB Australia via Rocking Web. Several of these are reported in USD. Where a vendor lists a local figure we treat it as approximately A$1 to US$1; where it is clearly USD, convert at roughly 0.65 USD per AUD. State your own currency assumption when you reuse these.
Triangulation ran across Perplexity and Parallel.ai for web and primary-source corroboration; the operator-voice observations in this post are anonymized patterns from the Eightx founder-call corpus, with figures preserved and any identifying detail removed. CAC itself remains a vendor-estimated metric benchmarked against a primary-source macro backdrop, so read the ABS numbers as the hard floor and the CAC numbers as well-sourced estimates.
A benchmark only pays off when someone acts on it, which is what an outsourced virtual CFO in Australia does for a growing Australian brand.
Frequently asked questions
what is a good cac for an australian ecommerce brand?
There is no single good number, only a good number for your vertical. In Australia in 2026, beauty brands sit around A$40 to A$115, apparel around A$90 to A$200 and luxury above A$500 (Eightx AU vertical benchmark). A good CAC is one your contribution margin can pay back inside one to two orders, so always read it against AOV and margin, not in isolation.
why is my cac higher in australia than the us benchmarks i keep reading?
Because the market is structurally smaller. About 27 million people are being fought over by roughly 153,000 Shopify stores, so the audience saturates fast and the ad auction gets dense once you scale past a few hundred thousand a month in spend. AU CAC commonly runs 20% to 35% above US figures, which is exactly why a US dashboard makes your numbers look broken when they are normal here.
what is a cac benchmark and how do i actually compare against it?
A CAC benchmark is a reference range for what it costs to acquire a customer in your market and vertical, used to judge whether your own number is healthy or broken. To compare properly, do not hold yourself against a single blended figure or a US dashboard. Find your vertical band (in Australia, roughly A$40 to A$115 for beauty, A$90 to A$200 for apparel, above A$500 for luxury), then check your CAC against your own AOV and contribution margin, because a benchmark only tells you if you are in range, not whether you make money at that range.
which ecommerce verticals have the lowest cac in australia?
Beauty and cosmetics tend to have the lowest acquisition cost, roughly A$40 to A$115, helped by strong organic and creator-led demand. Apparel runs higher at about A$90 to A$200 because the auction is crowded, and luxury sits above A$500. Lower CAC verticals are not automatically more profitable, though, because they often carry lower AOV and thinner margin.
why are meta cpms cheaper in australia but my cac is still high?
CPM is the cost to show an ad a thousand times. CAC is the cost to turn that exposure into a paying customer. Australia has cheaper impressions than the US, but a smaller audience means you hit the same people more often (rising frequency) and the auction tightens faster as you scale, so each incremental customer costs more even though each impression costs less.
how long should it take to pay back cac on a first order in australia?
Aim to recover CAC within one to two orders. Take apparel at a A$145 CAC, a A$110 AOV and a 60% contribution margin: your first order throws off about A$66 of gross profit, so it takes a bit over two orders to break even on acquisition. If your maths says you lose money on order one, you are running a retention business whether you meant to or not, so the second-order rate is the number to fix.
what's a healthy ltv to cac ratio for an australian dtc brand?
Above 3:1 on a 12-month LTV, the same global standard, but it is harder to hit here because CAC is structurally higher. If you are below 3:1, the fix is almost always repeat-purchase rate and margin rather than chasing a cheaper first click the auction will not give you at scale. Underwrite to a 3:1 minimum before you approve more spend.
how do i reduce customer acquisition cost for my shopify store in australia?
Stop trying to win the cheap-click race the small auction will not let you win, and solve CAC on the payback side instead. Lift AOV with bundles and free-shipping thresholds, push the second-order rate with post-purchase flows, and protect margin so each first order pays acquisition back faster. Spreading the same spend across better-converting creative beats simply bidding harder.
Related Eightx benchmarks: Average Australian ecommerce CAC by vertical 2026: A$40 to A$115 beauty, A$90 to A$200 apparel, A$500+ luxury and AU online retail just lost its scoreboard: what 12.7% means and what to use instead. For hands-on help with your numbers, talk to our fractional CFO team.