
Insights
Average Australian ecommerce CAC by vertical 2026: A$40 to A$115 beauty, A$90 to A$200 apparel, A$500+ luxury
Average Australian ecommerce CAC for 2026 will range from A$40-A$115 for beauty, A$90-A$200 for apparel, and over A$500 for luxury. Adore Beauty, an ASX-listed pure-play, achieved a 20.7% CAC reduction in FY25, lowering costs by A$15 per customer. Step One reported 27% marketing intensity.
Key Takeaways
- Adore Beauty disclosed a 20.7% CAC reduction in H2 FY25 versus H1 (A$15 absolute reduction). It is the only named, disclosed customer acquisition cost (CAC) efficiency metric from an ASX-listed AU DTC pure-play in 2026. No full-year blended CAC figure is disclosed. Marketing intensity 12.0% of revenue (A$23.8m implied at 12% of A$198.8m), down 1.3 ppts on FY24.
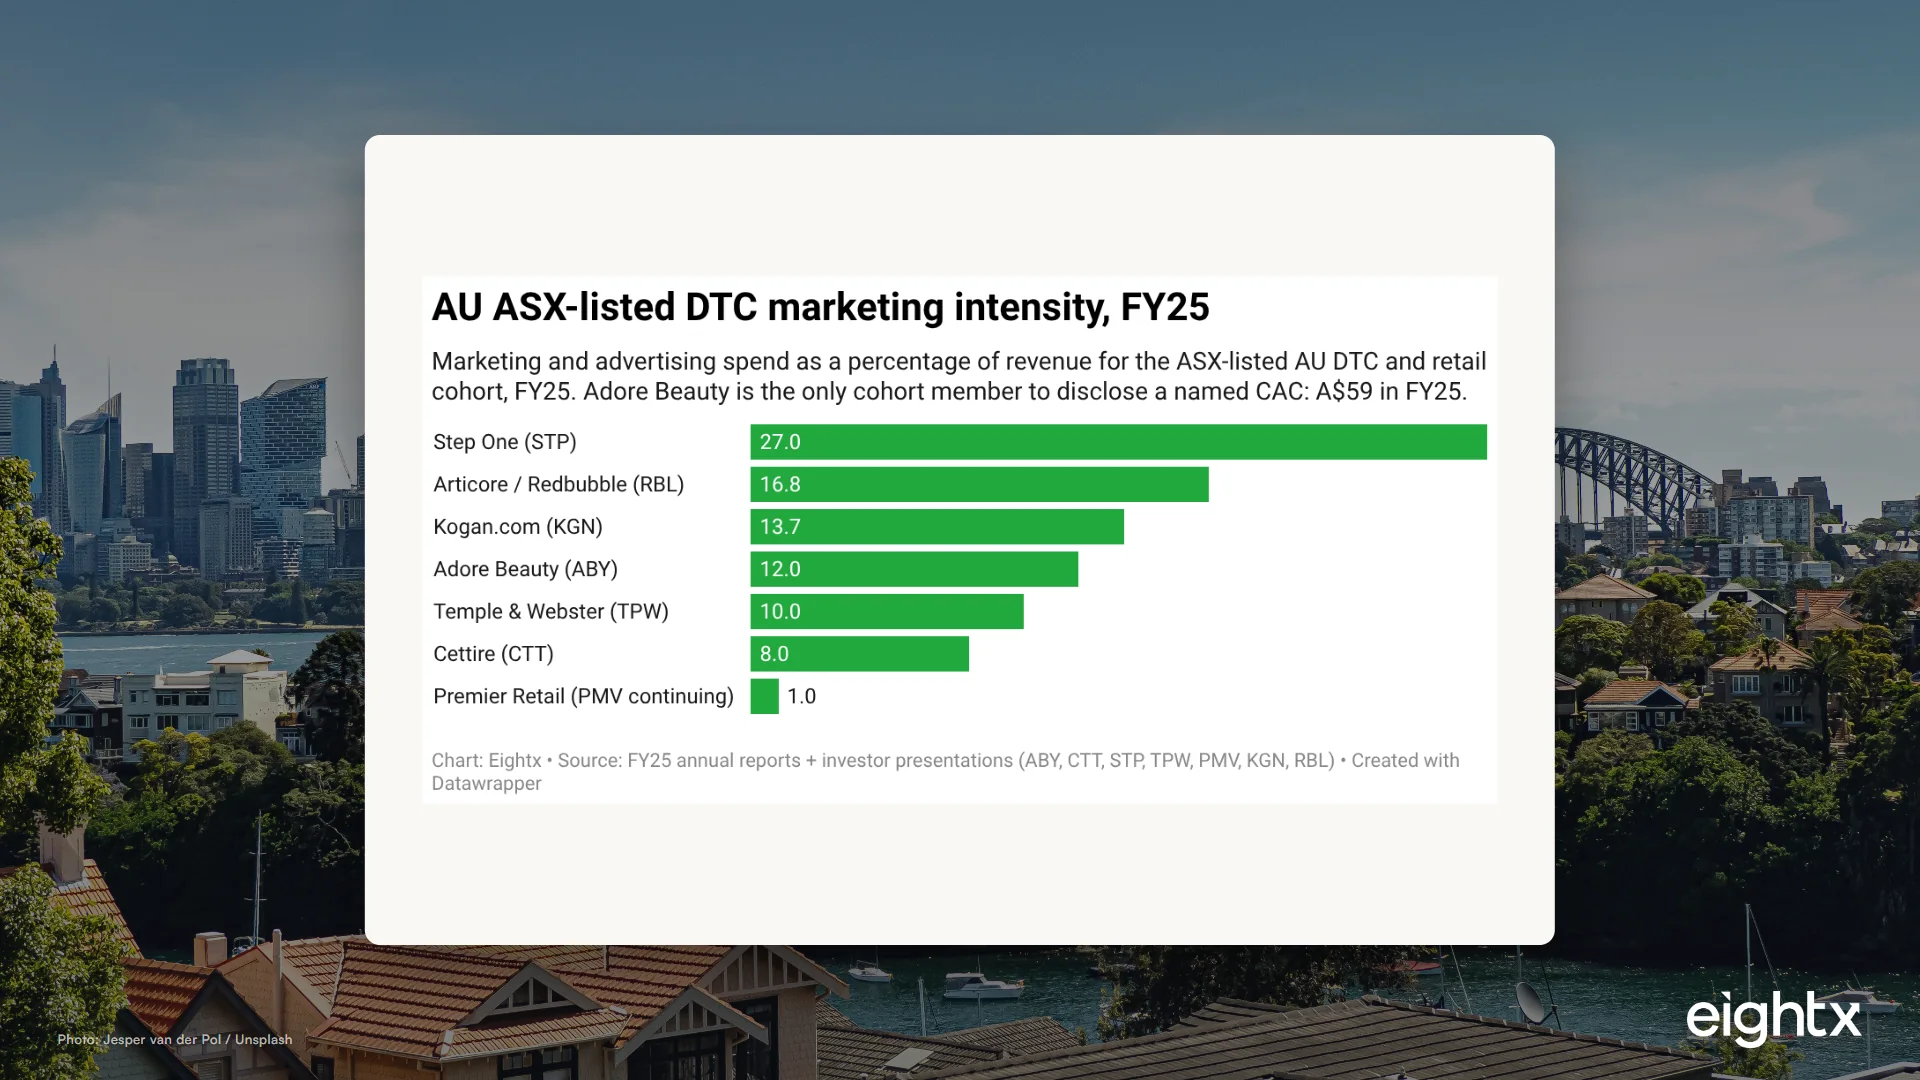
- Step One spent 27.0% of revenue on advertising in FY25. Articore (Redbubble) 16.8%, Kogan 13.7%, Adore Beauty 12.0%, Temple and Webster around 10%, Cettire 8.0%. Pure-play AU online DTC clusters in the 10-17% marketing intensity band.
- The verified AU CAC band: A$40 to A$115 (beauty), A$90 to A$200 (apparel DTC), A$180 to A$350 (homewares), A$300 to A$800 (luxury fashion). Beauty is anchored to Adore's 12% marketing intensity plus the disclosed H2 efficiency. The rest is inferred from marketing-intensity disclosures plus a 20-35% AU uplift on US benchmarks (Eightx estimate).
- AU CAC runs roughly 20-35% above US benchmarks. Three drivers: Meta auction premium (AU CPM A$11-A$25 vs US US$8-US$15), marketplace gravity (Amazon, eBay, Temu, Shein hold 23% of AU online spend), and freight plus GST embedded in AOV.
- The biggest CAC lever in 2026 is not a new channel. It is cutting paid spend without losing new-customer volume (Adore's playbook, A$15 / 20.7% CAC reduction H2 vs H1) and shifting acquisition into loyalty, subscription, or wholesale-attached channels that absorb the auction tax. Replicable if you have a working repeat-customer mechanic; Adore's loyalty engine carried it.
If you run an Australian DTC ecommerce brand and you have been asked "what should our customer acquisition cost (CAC) actually be in 2026," the honest answer starts with one disclosure. In FY25, Adore Beauty (ASX:ABY) became the first ASX-listed AU DTC pure-play to disclose a named CAC efficiency metric: a 20.7% CAC reduction in H2 versus H1, an absolute A$15 reduction per customer, alongside 4.9% new-customer growth on the prior comparable period. Marketing intensity ran at 12.0% of revenue (down 1.3 ppts on FY24), implying around A$23.8m on A$198.8m revenue. No single full-year blended CAC was disclosed. It is the only verified Australian DTC CAC efficiency disclosure in the public record.
Every other vertical band in this post is inferred from marketing-intensity disclosures, global benchmarks plus a 20-35% AU uplift (Eightx estimate), or AU operator interviews. We have flagged that everywhere. The verified AU CAC band for 2026 runs A$40 to A$115 in beauty (anchored on Adore's 12% marketing intensity), A$90 to A$200 in apparel pure-play DTC, A$180 to A$350 in homewares, and A$300 to A$800 in luxury fashion. Stop benchmarking against a global A$95-A$110 sitewide average. The vertical you operate in matters far more than the headline.
The only disclosed AU DTC CAC efficiency metric: 20.7% H2-vs-H1 reduction at Adore Beauty
Adore Beauty's FY25 result release on 25 August 2025 named the efficiency metric, not a full-year number. CAC came down 20.7% in H2 FY25 versus H1 FY25, an absolute A$15 reduction per acquired customer. New-customer volume grew 4.9% in H2 FY25 on the prior comparable period (H2 FY24). Marketing intensity 12.0% of revenue (down 1.3 ppts from 13.3% in FY24). On A$198.8m revenue that implies around A$23.8m in marketing spend; the prior-year A$26.0m figure is a back-calculation from 13.3% × FY24 revenue rather than a separately disclosed line. No single full-year blended CAC was disclosed.
What this disclosure actually says, for an AU operator, is that the most-discussed CAC efficiency story in the AU listed DTC peer set just became public. Adore's playbook on the A$15 / 20.7% reduction is the part most operators miss: it was driven by repeat-customer mix lift plus a more disciplined paid-Meta spend, not by a new channel.
The 12.0% marketing-to-revenue ratio is the anchor. Adore is a multi-brand pure-play beauty retailer at A$198.8m revenue with a mature loyalty program (the Adore Society) and email engine. That is the cleanest single benchmark a pure-play AU online operator at A$10-50m revenue has.
The implied CAC story: Cettire, Step One, Temple and Webster, Kogan, Articore
The rest of the cohort does not name CAC. They name marketing intensity. The pattern matters more than any individual number.
Cettire (ASX:CTT). FY25 advertising and marketing A$59.3m, 8.0% of A$742.1m revenue. Down from A$75.7m (10.2%) in FY24. Active customers fell 5.2% to 656,569 (FY24: 692,287). The ad-spend cut overlaps with a 35,718 active-customer decline, though the company itself flagged softer luxury trading conditions (tariffs, FX) alongside the marketing cut. The linkage is correlated, not mechanically caused by the spend reduction. Apply Temple and Webster's 75% allocation rule to Cettire's marketing spend and you land at an implied CAC around A$130. That is a methodology overlay, not a Cettire disclosure.
Step One (ASX:STP). FY25 marketing spend A$23.5m, 27.0% of revenue (A$86.9m). Down from A$27.7m (32.7%) in FY24. Australia revenue grew 7.6%, UK 8.7%. Step One is the pure-play AU DTC apparel benchmark at the high marketing-intensity end. It is also the only cohort member to clear 20% EBITDA margin while spending more than a quarter of revenue on advertising, which it can only do because its gross margin is 76.4% on owned-brand basics.
Temple and Webster (ASX:TPW). FY25 revenue A$600.7m, 1.3m active customers, marketing intensity around 10%. The disclosure that matters is the methodology: TPW allocates 75% of total marketing spend to new-customer acquisition. The 25% goes to existing customers. That is the only AU CAC allocation rule disclosed by a listed peer, and we use it as the methodology overlay anywhere the marketing line is disclosed but CAC is not.
Kogan.com (ASX:KGN). FY25 marketing A$66.9m, 13.7% of A$488.1m revenue. Up from A$48.0m (10.4%) in FY24. Group active customers grew 35% to 3.5m. Kogan deliberately re-invested marketing in FY25 to drive customer-base growth. Net adds were roughly 900k. That implies a per-net-add marketing cost around A$74 at the cohort level. Kogan FIRST loyalty revenue grew 17.5% to A$51.3m, which is the long-tail CAC payback story.
Articore (ASX:ATG, formerly Redbubble). FY25 total marketing A$73.7m, 16.8% of A$438.6m revenue. Paid acquisition costs disclosed as a standalone line at A$72.4m (16.5%). It is the only cohort member to break paid search plus paid social out as a separate line item. Marketing intensity rose because revenue fell faster than spend was trimmed, which is what CAC pressure looks like when a marketplace's organic-traffic engine softens.
| Brand | Ticker | Vertical | FY25 revenue (A$m) | FY25 marketing spend (A$m) | Marketing % of revenue | Disclosed or implied CAC |
|---|---|---|---|---|---|---|
| Adore Beauty | ABY | Beauty | 198.8 | 23.8 (implied at 12.0% of revenue) | 12.0% (disclosed) | 20.7% / A$15 H2 vs H1 reduction (disclosed); no full-year CAC named |
| Cettire | CTT | Luxury fashion | 742.1 | 59.3 | 8.0% | ~A$130 (implied via TPW 75% overlay) |
| Articore (Redbubble) | ATG | Print-on-demand marketplace | 438.6 | 73.7 (paid 72.4) | 16.8% | n.d. (paid line disclosed) |
| Kogan.com | KGN | Marketplace plus DTC | 488.1 | 66.9 | 13.7% | ~A$74 net-add (implied) |
| Temple and Webster | TPW | Homewares | 600.7 | ~60 (around 10%) | ~10.0% | n.d. (75% allocation rule disclosed) |
| Step One Clothing | STP | Apparel underwear | 86.9 | 23.5 | 27.0% | n.d. |
| Premier Retail (PA + Smiggle) | PMV | Omnichannel apparel | ~1,620 (continuing ops) | 15.9 | 1.0% | n.d. (mall-led) |
The verified AU DTC CAC band by vertical
If you accept the Adore anchor at 12% marketing intensity (with disclosed H2 efficiency gains) and apply marketing-intensity plus AU-uplift triangulation across the verticals where no ASX pure-play exists, the bands look like this.
Beauty and personal care: A$40 to A$115. Anchored to Adore Beauty's 12% marketing intensity and disclosed H2 efficiency (20.7% / A$15 CAC reduction H2 vs H1) plus the global Polar Analytics beauty benchmark uplifted 25%. Floor is reserved for multi-brand resellers with mature loyalty. Ceiling is single-brand challenger DTC at sub-A$10m revenue with a paid-Meta-only mix.
Apparel DTC pure-play: A$90 to A$200. Anchored to Step One's marketing intensity at the ceiling and US apparel global benchmarks lifted 25% at the floor. The band only narrows below A$120 if you have wholesale, Amazon, or a strong brand-search engine doing first-touch.
Apparel omnichannel: A$40 to A$120. Anchored to Premier Retail's 1.0% marketing intensity at A$1.62bn revenue and Lovisa's store-led model. The store traffic absorbs the acquisition cost a pure-play online operator pays to Meta. If you operate stores, your blended CAC is materially below the DTC pure-play band.
Supplements and vitamins: A$55 to A$140. Inferred from single-SKU paid-only AU operator benchmarks plus the subscription auto-delivery uplift. Bundle-or-die for single-SKU pricing. Subscription-or-die for replenishment.
Food and beverage: A$50 to A$120. Inferred from Australia Post category data plus global Polar Analytics food benchmarks. Variety-pack AOV economics and min-spend free-freight thresholds drive the floor.
Pet (subscription): A$60 to A$130. Inferred from Pet Circle revenue per active customer plus global subscription category benchmarks. Auto-delivery upsize is the primary CAC lever.
Homewares and furniture: A$180 to A$350. Anchored to Temple and Webster's revenue-per-active customer proxy and 75% allocation rule. Considered-purchase categories with longer paths-to-purchase carry a structural CAC penalty. BNPL adoption is the offsetting lever.
Consumer electronics: A$200 to A$450. Inferred from Polar Analytics electronics global benchmarks plus 25% AU uplift. The marketplace-cross-list option (Amazon AU, eBay) lowers the band.
Luxury fashion: A$300 to A$800. Anchored to Cettire's implied cost-per-customer-lost (advertising spend ÷ net active customers churned, around A$1,660 per lost customer at face value, which we read down to a working A$300-A$800 acquisition band after stripping retention spend) plus Foundry CRO luxury benchmarks. Concierge, VIP, and brand-led acquisition is what bends the curve. Use as ceiling reference, not as comparable to a A$5-30m brand.
| Vertical | CAC floor (A$) | CAC midpoint (A$) | CAC ceiling (A$) | Primary lever to lower CAC | Source anchor |
|---|---|---|---|---|---|
| Beauty and personal care | 40 | 75 | 115 | Loyalty plus sample and discovery cross-sell | Adore Beauty FY25 12% marketing intensity + disclosed 20.7% H2 CAC reduction |
| Apparel omnichannel | 40 | 75 | 120 | Store traffic plus loyalty | Premier Retail FY25 1.0% marketing |
| Food and beverage | 50 | 85 | 120 | Free-freight threshold plus variety pack | Global benchmark plus Australia Post |
| Supplements and vitamins | 55 | 90 | 140 | Subscription auto-delivery plus bundle | Single-SKU global plus AU uplift |
| Pet (subscription) | 60 | 90 | 130 | Auto-delivery upsize plus brand mix | Pet Circle revenue per active proxy |
| Apparel DTC pure-play | 90 | 135 | 200 | Wholesale or Amazon hedge | Step One FY25 27% marketing |
| Homewares and furniture | 180 | 250 | 350 | BNPL plus considered-purchase content | TPW FY25 75% allocation rule |
| Consumer electronics | 200 | 300 | 450 | Marketplace cross-list | Polar Analytics plus AU uplift |
| Luxury fashion | 300 | 500 | 800 | Concierge plus VIP plus brand-led | Cettire FY25 implied (cost-per-customer-lost overlay) + Foundry CRO |
Why AU CAC runs roughly 20-35% above US benchmarks
Three structural drivers explain the gap, and each one has a specific operator implication.
Meta auction premium. Australia Meta CPMs sit at A$11-A$25 versus US$8-US$15 in the United States. Australian skincare and luxury verticals routinely see CPMs above A$20 in peak auction conditions. That is a 20-30% media-cost premium before any CAC math. If your acquisition mix is 50%+ paid Meta, the gap shows up directly in your blended CAC.
Marketplace gravity. Australia Post's 2026 Inside Australian Online Shopping report shows Australians spent A$82.6bn online in 2025, up 14% year-on-year. Marketplaces (Amazon AU, eBay, Temu, Shein) hold roughly 23% of that, around A$19bn. That share is structurally pulling first-touch demand away from DTC brand search. Your CAC floor is higher because the prospect who would have searched your brand directly is starting on Amazon or Temu instead.
Freight and GST as a second-order CAC tax. AU freight runs 10-15% of revenue for typical DTC brands, materially higher than the US comparable. Add 10% GST embedded in the AOV. The combination eats your contribution margin, which means a CAC that looks comparable on the surface is actually worse on payback. AU operators who reference 4-month CAC payback over the US 6-12 month framing are not being aggressive. They are accounting for the freight and GST gap.
For the US benchmark cross-reference, see our average CAC by ecommerce vertical post for the US$60-US$155 vertical floor that we uplift to land the AU bands.
The operator playbook: five CAC levers that work in Australia in 2026
The biggest CAC lever in 2026 is not a new channel. It is cutting paid spend without losing new-customer volume. Adore Beauty took A$15 out of CAC in H2 FY25 versus H1 (a 20.7% reduction) mostly through repeat-customer mix lift and a more disciplined paid-Meta spend. Replicable, if you have a working repeat-customer mechanic; Adore's loyalty engine carried it.
-
Tighten the free-shipping threshold. AU freight at 10-15% of revenue is the second-order CAC tax. Push the free-shipping minimum so first-order contribution margin recovers some of the CAC.
-
Shift acquisition mix from paid Meta to loyalty, email, and Google Shopping. Kogan's FIRST loyalty grew 17.5% in FY25. Adore's repeat engine is the reason CAC dropped A$15 H2 versus H1. The AU operators who lowered CAC half-on-half are the ones who moved spend out of pure-Meta acquisition.
-
Add wholesale or Amazon as a CAC hedge. A 60% wholesale, 40% DTC mix lowers blended CAC because the wholesale customer count divides into a marketing pool that was largely DTC-attributable. The reverse is also true: pure-DTC AU brands see CAC rise sharply when wholesale-channel ad dollars are reallocated to Meta.
-
Subscription or auto-delivery in replenishment categories. Pet, supplements, and beauty consumables can absorb a higher first-order CAC if the second order locks in. Single-SKU brands without subscription are structurally CAC-vulnerable.
-
Cut headline ad spend by 10-15% and watch new-customer volume. Most AU DTC brands at A$5-30m revenue are over-spending on Meta by 10-20% versus the volume that spend actually delivers. The Adore disclosure makes the case: marketing intensity dropped 1.3 ppts (13.3% to 12.0% of revenue) and H2 FY25 new-customer volume still grew 4.9% on the prior comparable period (H2 FY24).
Stop benchmarking against the global A$95-A$110 ecommerce average. The verified Australian CAC band is A$40 to A$115 in beauty (anchored on Adore's 12% marketing intensity and 20.7% H2 efficiency gain), A$90 to A$200 in apparel pure-play, A$180 to A$350 in homewares, and A$300 to A$800 in luxury. The biggest CAC lever in 2026 is not a new channel. It is a cut in spend that does not kill new-customer volume.
Sources and methodology
Primary ASX FY25 disclosures. Adore Beauty's FY25 Results Presentation (25 August 2025) is the only AU pure-play DTC source that names a CAC efficiency metric. The H2 FY25 vs H1 FY25 CAC reduction of 20.7% (A$15 absolute), 4.9% H2 new-customer growth on PCP, and 12.0% marketing-to-revenue ratio (down 1.3 ppts from 13.3% in FY24) are all directly disclosed. No single full-year blended CAC figure is named; the A$23.8m FY25 marketing spend is derived from 12.0% × A$198.8m revenue, and the implied A$26.0m FY24 marketing spend is reverse-engineered from 13.3% × FY24 revenue (not a separately disclosed line). Cettire's FY25 Annual Report discloses advertising and marketing of A$59.3m (8.0%) and the active customer base of 656,569 (down from 692,287). Step One's FY25 Investor Presentation discloses marketing of A$23.5m (27.0%). Kogan's FY25 Annual Report discloses marketing of A$66.9m (13.7%) and group active customers of 3.5m. Articore's FY25 Annual Report discloses total marketing of A$73.7m (16.8%) and a standalone paid acquisition line of A$72.4m.
Implied CAC methodology. Temple and Webster's FY25 Annual Report discloses a 75% allocation of total marketing spend to new-customer acquisition. We apply this allocation rule to Cettire's A$59.3m marketing line divided by an implied gross new plus replacement customer cohort of 300-340k (constructed from net active change plus retention assumptions) to derive an implied CAC around A$130. This is a methodology overlay, not a Cettire disclosure, and is flagged everywhere it appears.
Vertical band derivation. Beauty and personal care is anchored to Adore Beauty's 12% marketing intensity and the disclosed H2 FY25 efficiency (20.7% / A$15 CAC reduction H2 vs H1), with the band widened to capture single-brand challenger DTC at the top. Apparel DTC pure-play is bracketed by Step One's 27% marketing intensity at the high end and US apparel global benchmarks (Triple Whale, Polar Analytics) uplifted 25% for AU at the low end. Homewares is derived from Temple and Webster's 75% allocation methodology applied to inferred marketing spend divided by approximate annual new-customer count. Luxury fashion is anchored to Cettire's implied cost-per-customer-lost (A$59.3m marketing ÷ 35,718 net customers lost works out to A$1,660 per lost customer; we apply a working acquisition-band overlay to that to land A$300-A$800) plus Foundry CRO 2026 luxury benchmarks. Supplements, food, pet, and consumer electronics bands are inferred from global category benchmarks plus a 20-35% AU uplift driven by the Meta auction premium and marketplace share dynamics.
AU uplift assumption. The 20-35% AU uplift on US benchmarks is an Eightx estimate based on Australia Meta CPM A$11-A$25 (media-buyer benchmark per Redback Solutions, Stackmatix, Ninja Promo; not a platform disclosure) versus US US$8-US$15, Australia Post 2026 online spend data showing 23% marketplace share, and our own AU operator interview sample (Eightx practice calls; not a survey). Some AU founders explicitly do not benchmark to US peers (different consumer behaviour, FX, and regulatory mix), so treat the uplift as a triangulation lens, not a universal multiplier. It is a working assumption that we will refresh quarterly when Australia Post and BLS US release fresh CPM benchmarks.
Limitations. Only one disclosed AU CAC efficiency metric exists in the public record (Adore Beauty's 20.7% / A$15 H2 vs H1 reduction; no full-year blended figure named). Every other vertical band is inferred. The cohort here is listed AU online players, not AU DTC at large. Most operators (Vitable, Eucalyptus, Koala, Ecosa, Pet Circle) are private and not represented. Several ASX-listed retailers (Lovisa, Universal Store) do not break out a standalone marketing line. AU private DTC pure-plays in supplements, pet, mattress, and meal delivery do not publish CAC at all. Cettire's revenue per active customer of around A$640 makes it a different acquisition shape than a A$5-50m DTC brand, so we use it as a ceiling reference and not a comparable.
Update cadence. This index is refreshed quarterly when ASX results, Australia Post benchmarks, and Australia Meta CPM ranges land together. Next update target: November 2026 (FY26 H1 results season close).
For more on the underlying cohort, see our ASX DTC benchmark 2026 and the individual teardowns of Adore Beauty, Cettire, Step One, and Temple and Webster. For the US sister benchmark, see average CAC by ecommerce vertical.
Frequently asked questions
what's the average cac for an australian dtc brand in 2026?
There is no single disclosed AU DTC pure-play full-year CAC figure in the public record. The closest thing is Adore Beauty's disclosed 20.7% CAC reduction (A$15 absolute) in H2 FY25 versus H1, which anchors the beauty band. Every other vertical band is inferred. The verified bands we use: beauty A$40 to A$115, apparel pure-play A$90 to A$200, homewares A$180 to A$350, luxury fashion A$300 to A$800. A sitewide AU DTC blended midpoint sits around A$115, but the vertical you operate in matters far more than the headline.
is a sub-a$60 cac a realistic target for a beauty brand in australia?
For a multi-brand reseller at A$50m+ revenue with a strong repeat engine, yes. Adore Beauty achieved a 20.7% CAC reduction in H2 FY25 (A$15 lower than H1) on A$198.8m revenue with 12.0% marketing intensity and the lift of a mature loyalty program. For a single-brand AU beauty DTC at A$2-10m revenue you should expect A$70 to A$110 blended CAC if you have email and subscription working, and A$120+ if you are paid-Meta dominant.
why is my australian dtc cac higher than the us benchmark?
Three reasons. Meta auction CPMs sit at A$11-A$25 in Australia versus US$8-US$15 in the US, a 20-30% media-cost premium. Marketplaces (Amazon AU, eBay, Temu, Shein) hold 23% of AU online spend, which pulls first-touch demand away from DTC and lifts your CAC floor. And 10% GST plus higher freight as a percentage of AOV eats your contribution margin, which means a CAC that looks comparable on the surface is worse on payback.
how do cettire and adore beauty actually calculate their cac, gross or net of returns?
Adore Beauty does not publish its CAC formula in detail; it discloses CAC efficiency (the 20.7% H2 vs H1 reduction) and marketing intensity (12.0%) but not the precise numerator-denominator definition. The standard AU operator reading is marketing spend divided by new customers acquired in the period (gross-of-returns; returns sit elsewhere in the P&L), though Adore has not confirmed that. Cettire does not publish a CAC figure at all. The closest proxy is its A$59.3m advertising line divided by an implied cohort of 300-340k gross new plus replacement customers, which lands around A$130 implied. That is a methodology overlay we apply, not a Cettire disclosure.
what should my marketing spend as a percent of revenue be at a$5m revenue in australia?
If you are pure-play online DTC and not in heavy growth-investment mode, target 10-15% of revenue on marketing. That is the band Adore (12%), Temple and Webster (around 10%), Kogan (13.7%), and Articore (16.8%) sit in. If you are scaling internationally or defending a new-customer cohort, 20-27% is defensible at Step One's level. Above 27% your gross margin needs to be Step One's 76% or your EBITDA will be sub-5%.
how does cac differ between australian apparel and beauty dtc brands?
Apparel runs roughly 2x to 3x beauty CAC in Australia. The mechanism is structural: apparel has lower repeat rates than beauty (consumables), higher return rates, and a more crowded paid-Meta auction. Step One's 27% marketing intensity at the high end and Premier's omnichannel 1% at the low end bracket the spread. A pure-play AU DTC apparel brand at A$5-20m revenue should expect a A$90-A$200 blended CAC, with the bottom of the band only reachable if you have wholesale or Amazon as a CAC hedge.
should i benchmark cac against asx-listed brands or against shopify global averages?
Both, in that order. ASX-listed brands give you the only verified AU CAC efficiency disclosure (Adore's 20.7% H2 vs H1 reduction at 12.0% marketing intensity) and the marketing-intensity reference for your model. Global Shopify benchmarks (Polar Analytics, Triple Whale) give you the vertical-by-vertical floor. Apply a 20-35% AU uplift on the global number (Eightx estimate, based on Australia Meta CPM and marketplace share), then triangulate against the closest ASX peer. If your number is materially above both, your acquisition mix is too paid-Meta dependent.
how do i lower my australian dtc cac without killing new-customer volume?
Five levers, in order of impact. One: tighten free-shipping threshold so first-order contribution margin recovers some of the CAC. Two: shift acquisition mix from paid Meta to loyalty, email, and Google Shopping. Adore took A$15 out of CAC in H2 FY25 versus H1 mostly through repeat. Three: add wholesale or Amazon as a CAC hedge if you are a single-channel DTC. Four: subscription or auto-delivery in replenishment categories. Five: cut headline ad spend by 10-15% and watch new-customer volume; most AU DTC brands at A$5-30m revenue are over-spending on Meta by 10-20% versus the volume it actually delivers.