
eCommerce
Australia Ecommerce Return Rate Benchmark 2026
Australia has no NRF-style national return rate table. The one hard datapoint is AusPost's 2026 figure that 41% of online shoppers returned an item in 2025, which is shopper prevalence, not a per-order rate. The working per-order benchmark: apparel around 31%, footwear low-20s, electronics around 11%.
Key Takeaways
- 41% of Australian online shoppers returned at least one item in 2025 (AusPost 2026 eCommerce Report). That is shopper prevalence, not a per-order return rate, and it is routinely misquoted as 'Australia's return rate is 41%.'
- The working per-order benchmark: apparel around 31%, footwear low-20s, homewares around 19%, beauty around 12%, electronics around 11%. Apparel uses the AU-specific Power Retail marker; other verticals are global 2026 category benchmarks placed against the AusPost anchor.
- Australia plausibly sits between the APAC average (5-15%) and UK fashion (30-35%), roughly in line with US online apparel at 24.4%. No primary AU per-order table exists, so treat the cross-country AU figures as estimates.
- A return costs an AU fashion brand roughly A$13.45 per gross order at A$150 AOV and a 31% return rate, about 9% of revenue, before any resale recovery. That is A$3-7 to process plus A$10-25 to ship each return back.
- Returns already show up in ASX margins. Cettire (ASX:CTT) delivered margin fell to 16.1% in FY25 from 20.9% in FY24, reflecting refund-related costs. Stop benchmarking against the US 19.3% number and model returns on your own P&L.
If you run an Australian online store and you have tried to benchmark your return rate, you have probably hit the same wall we do. Australia does not publish an NRF-style national returns table, so most "AU return rate" numbers floating around are US figures with the country name swapped out. This post fixes that. We take the one hard Australian datapoint, build a defensible per-order benchmark by category around it, and then put a dollar figure on what each return actually costs your margin. AOV here means average order value, and delivered margin is gross margin after all the shipping and fulfilment costs to get an order to a customer and back.
The one number Australia actually publishes (and why 41% isn't your return rate)
The single hard, primary Australian datapoint comes from Australia Post's 2026 eCommerce Report: 41% of online shoppers returned at least one item in 2025. It is a real number from a real national dataset, and it is the right place to anchor.
It is also the most misquoted number in Australian ecommerce. "41%" is shopper prevalence, the share of online shoppers who returned something at least once during the year. It is not a per-order return rate. If 41 of every 100 shoppers returned one item out of the ten orders they placed, the per-order return rate is nowhere near 41%. When we talk to founders running an AU brand for the first time, the thing they keep doing is quoting the 41% straight into their P&L model and then panicking. Slow down: that is not the number that hits your margin.
The number that hits your margin is your per-order return rate, the share of orders that come back. If the difference between shopper prevalence and a per-order rate is new to you, our return rate pillar walks through how the metric is defined and benchmarked before you try to model it. Australia has no published, NRF-equivalent table for that figure by category. So the honest answer to "what is my benchmark" is that you have to build one, by placing global category shapes against the AusPost prevalence anchor and the macro backdrop. That is exactly what the rest of this post does. Everywhere a number is inferred rather than measured, we say so.
Australian return rate by category: the working benchmark
Returns are mostly structural, not geographic. An apparel order comes back because the fit was wrong, the size was a guess, or the shopper bought three sizes intending to keep one. None of that changes at the Australian border. That structural read is the central modelling assumption of this whole benchmark: that the global category shape transfers to Australia, with the AusPost anchor and AU consumer behaviour setting the level. It is a defensible assumption, not a measured fact, and it is why we can build a working AU benchmark even without a local table. Where market-specific friction matters, free-returns prevalence and parcel economics push the AU level around rather than reorder the categories.
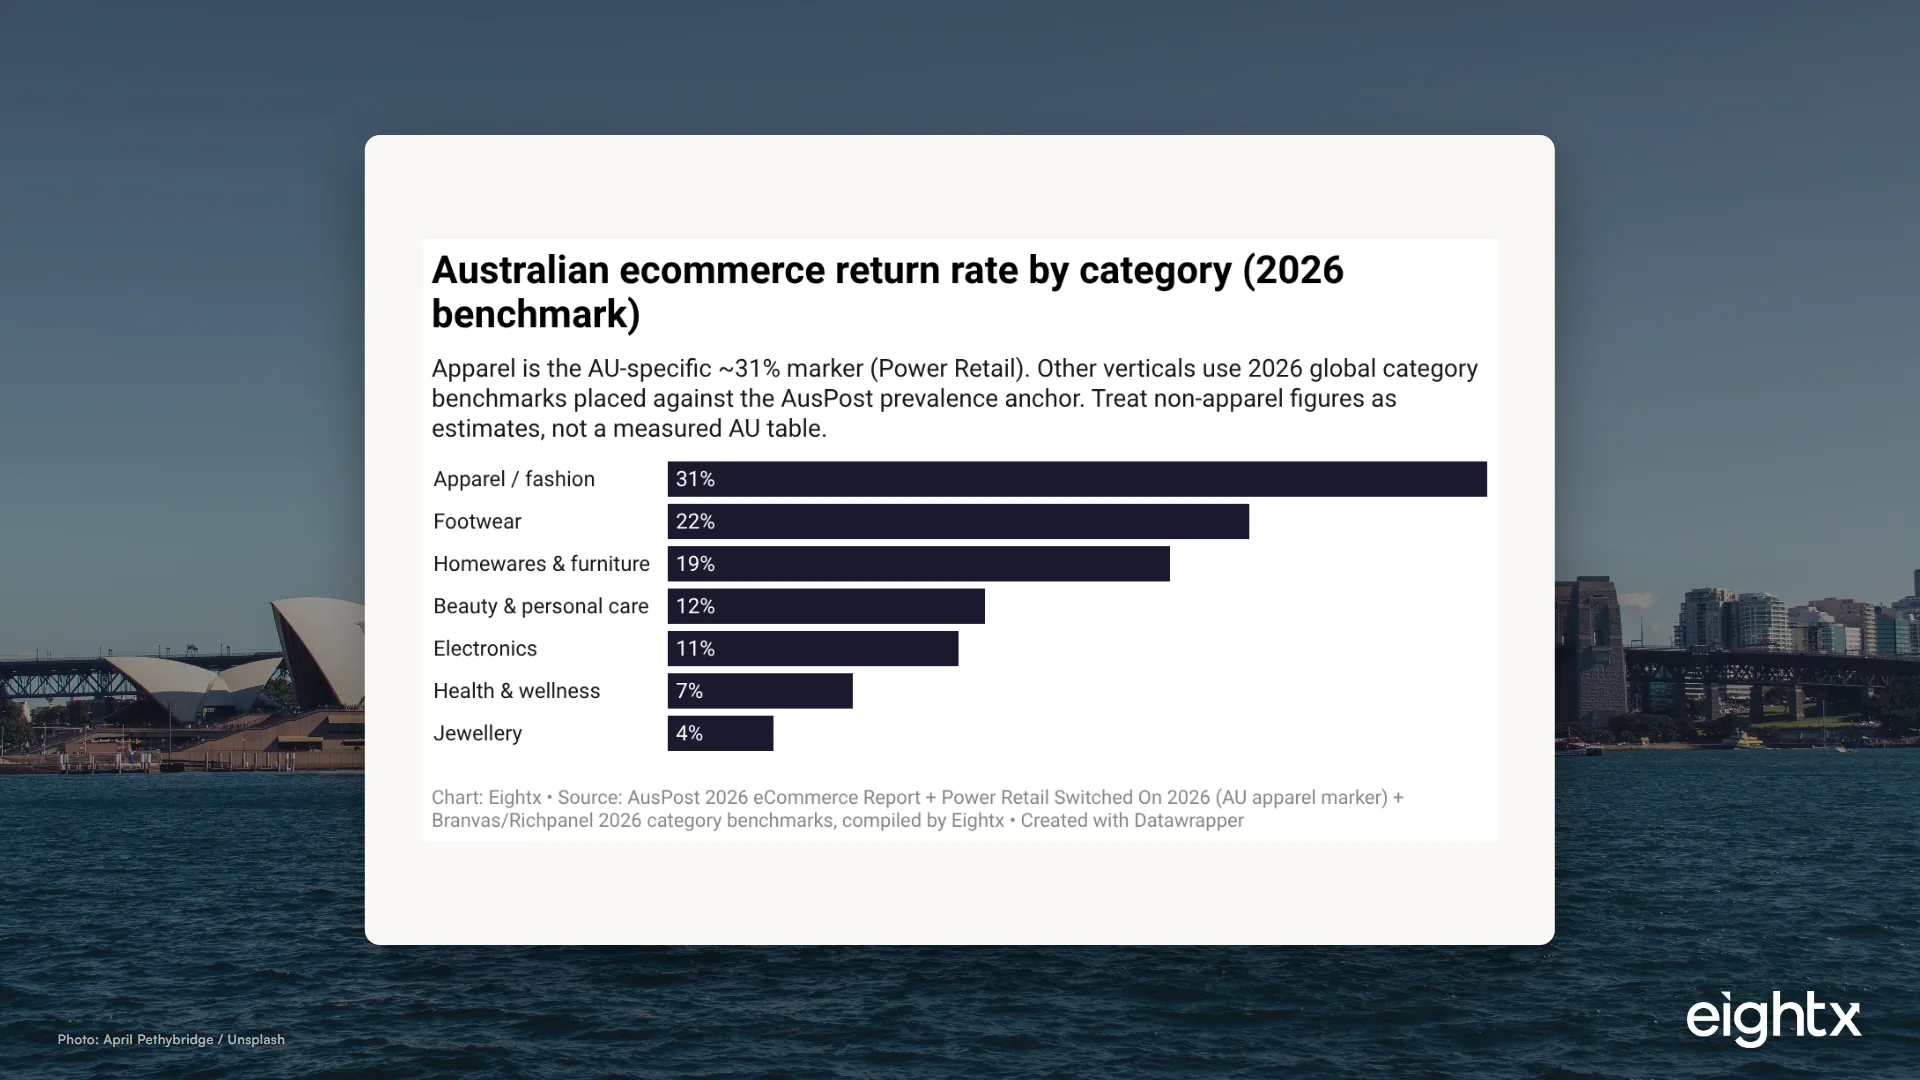
Here is the working per-order benchmark. Apparel uses the AU-specific marker (around 31%, surfaced via Power Retail's Switched On 2026 coverage); the other verticals use 2026 global category benchmarks placed against the AusPost anchor and labelled as estimates.
The spread is wide and predictable. Apparel and footwear sit at the top because fit and bracketing drive them. Beauty and personal care stay low because hygiene rules limit returns. Electronics returns are mostly defects and compatibility, not taste. Jewellery is a high-consideration purchase, so it barely comes back at all.
| Category | AU return rate benchmark | Primary driver |
|---|---|---|
| Apparel / fashion | ~31% (low-mid 20s central) | Fit / sizing / bracketing |
| Footwear | 17-25% | Sizing / comfort |
| Homewares & furniture | ~19% | Colour/size mismatch / damage |
| Beauty & personal care | ~12% | Hygiene rules keep it low |
| Electronics | ~11% | Defect / compatibility |
| Health & wellness | ~7% | Consumable / hygiene |
| Jewellery | ~4% | High consideration purchase |
The structural read matters for where you spend your energy. If you sell apparel, your return rate is a product and merchandising problem before it is a logistics problem. If you sell electronics or beauty, returns are a smaller line and your effort is better spent elsewhere. The pattern we see again and again is operators treating returns as one undifferentiated cost when the category mix should tell them exactly where to push. For a deeper AU vertical-by-vertical view, see our AU return rate by vertical breakdown.
How Australia compares to the US and UK
The temptation is to grab the US headline number and call it your benchmark. Do not. The US online return rate was 19.3% of online sales in 2025 (NRF), and US online apparel ran 24.4% (Coresight, for the 12 months to March 2023). The UK is higher, with fashion-driven overall returns reported around 35%. The APAC average is far lower, 5-15% overall, dragged down by markets where returns carry cultural and logistical friction.
Australia does not behave like the rest of APAC. Its consumers expect Western-style returns policies, its ecommerce penetration is high, and free or cheap returns are common. So AU sits above the APAC average and a little below UK fashion, roughly in line with US online apparel.
The estimate flag is important here. The US and UK bars are measured. The Australian bars are inferred, placed between the APAC average and UK fashion using the AusPost prevalence anchor and known AU consumer behaviour. We label them "est." because there is no primary AU per-order table to measure them against. The same series exists for other markets if you want to cross-check: see our Canada ecommerce return rate benchmark for the equivalent build.
The operator takeaway is simple. If you are benchmarking your AU apparel brand against the US 19.3% all-category number, you are setting the bar too low and you will think your returns are a crisis when they are normal. Benchmark fashion against fashion. A low-to-mid 20s per-order rate is normal for AU apparel; over 30% is worth investigating; under the high-teens may mean friction is suppressing legitimate returns and quietly hurting repeat purchase.
What a return actually costs an Australian brand
A return is not a neutral event where revenue simply reverses. The revenue reverses, but the costs do not. You paid to ship the order out, you pay again to ship it back, and you pay a third time to inspect, process and restock it. In Australia, reverse logistics runs roughly A$3-7 per item to process plus A$10-25 per parcel to ship back.
Put that on a real brand. Take a fashion store at A$150 AOV running a 31% return rate. The all-in cost of a returned order lands around A$43 once you add reverse shipping to processing. That A$43 is back-solved from the A$13.45-per-gross-order figure, so it sits above the summed component midpoints (top-of-range shipping plus processing gets you to roughly A$32); the gap is the labour, restocking and write-down friction the headline ranges understate, so treat A$43 as the implied all-in rather than a bottom-up total. Spread across every gross order, that is about A$13.45 per order, or roughly 9% of revenue, before you recover anything by reselling the returned item.
| Line item | Amount (AUD) | Note |
|---|---|---|
| Return shipping (per returned parcel) | 10-25 | Domestic reverse leg |
| Processing / inspection / restock (per item) | 3-7 | 3PL handling |
| All-in cost per returned order (mid) | ~43 | Implied from ~A$13.45 / 0.31 |
| Reverse-logistics cost per GROSS order | ~13.45 | = 31% return rate x all-in cost |
| As % of A$150 revenue | ~9% | Before any resale recovery |
This is not just a private-brand problem you can wave away. It shows up in public ASX disclosures. Cettire (ASX:CTT) reported delivered margin of 16.1% in FY25, down from 20.9% in FY24, with refund-related costs part of the compression. When a listed luxury-ecommerce business loses nearly five points of delivered margin in a year, that is the public read on what returns do to a P&L. When we have struggled with this alongside operators, the fix has never been to ban returns; it has been to make returns a named line on the P&L so the cost is visible and managed rather than buried inside "shipping."
Stop treating returns as a footnote to gross margin. On a A$150 AOV apparel brand at a 31% return rate, returns cost about A$13.45 per gross order, roughly 9% of revenue, before resale recovery. That is the difference between a brand that thinks it is profitable and one that actually is.
Why the macro backdrop is pushing returns up
Returns do not rise in a vacuum. They rise when the consumer gets more price-conscious and starts bracketing harder, buying multiple sizes or options with the intent to return most of them. The Australian macro picture is doing exactly that to shoppers right now.
Retail turnover keeps climbing: ABS retail trade hit A$37.9bn in June 2025, up 4.87% year on year. But prices climbed faster than pay. CPI rose 4.09% year on year to the March 2026 quarter, while the Wage Price Index grew only 3.22% over the same period. Prices outran wages, so real incomes are still being squeezed.
A squeezed consumer is a careful consumer. They order more options to avoid paying for shipping twice, they keep the one that fits, and they send the rest back. That behaviour shows up as a higher return rate even when nothing about your product changed. It is also why a generous free-returns policy that worked fine in 2021 can quietly become a margin leak in 2026: the same policy now sits in front of a more deliberate, more value-conscious shopper who uses it harder.
The size of the exposure is real. The Storeleads AU geo cut shows 153,140 Australian Shopify stores, and apparel is the single biggest category at 32,968 stores. The highest-return-rate vertical is also the most crowded one, which means a lot of AU operators are carrying this cost whether they have measured it or not.
The levers: cutting returns without cutting conversion
The goal is not zero returns. A store with suspiciously low returns is often suppressing legitimate ones with friction, and that hurts repeat purchase. The goal is to cut the returns you do not want, the bracketed and avoidable ones, without taxing the customers you do want.
Start with fit and sizing, because that is where most apparel returns are born. Better size guides, fit-finder tools, consistent sizing across SKUs and honest product photography do more to cut returns than any policy change. Next, push exchanges over refunds: an exchange keeps the revenue and the customer, where a refund loses both. Then look at your bracketers. If a small group of customers drives a large share of your returns, a paid-return option for repeat returners, while keeping a free first return, can trim volume without scaring off first-time buyers.
Mind the guardrails. Under Australian Consumer Law you cannot charge a customer to return goods that are faulty, not as described, or otherwise in breach of consumer guarantees. Paid returns can only apply to change-of-mind returns, and even then you need a clear, visible policy. When we talk to founders running an AU brand this size, the operators who win here are the ones who treat returns as a product and merchandising problem first and a policy problem second. The policy levers cap the bleeding; the product levers stop the wound.
The operator decision is the same one every time. Stop benchmarking against the US 19.3% online number. Build your own per-order benchmark by category, model returns as a real line item on your P&L using your actual AOV and reverse-logistics cost, and pull the product and policy levers before returns quietly eat your delivered margin the way they did at Cettire.
Sources and methodology
The single primary Australian datapoint is the AusPost 2026 eCommerce Report, which states that 41% of online shoppers returned at least one item in 2025. We treat this as shopper prevalence, not a per-order return rate, and anchor the post to it rather than presenting it as a return rate. There is no published Australian NRF-equivalent per-order return rate table by category, which is the central limitation of any AU returns benchmark and the reason this post builds a working benchmark rather than reporting a measured one.
The apparel figure of approximately 31% is the strongest AU-specific marker, surfaced via Power Retail's Switched On 2026 coverage as a secondary citation rather than a primary-source table; we flag it as directional. All other category figures (footwear, homewares, beauty, electronics, health and wellness, jewellery) are 2026 global category benchmarks from Branvas and Richpanel, placed against the AusPost anchor and labelled as estimates. They are not measured Australian data.
Cross-country comparisons use measured sources for the US and UK and inferred placement for Australia. US figures are the NRF 2025 Retail Returns Landscape (15.8% overall retail, 19.3% of online sales) and Coresight Research (24.4% online apparel, for the 12 months to March 2023, so treat it as a category-shape comparator rather than a current-year figure). UK and European fashion figures (UK around 35% overall, Europe fashion average around 26%, APAC overall 5-15%) come from Prime AI's synthesis of Statista and NRF data. The Australian bars in the comparison are inferred from APAC and US/UK placement and labelled "est."
The cost model uses AU reverse-logistics cost data (A$3-7 processing per item plus A$10-25 return shipping per parcel) compiled in the Eightx / Pikpak AU returns guide, applied to a A$150 AOV fashion brand at a 31% return rate, giving roughly A$13.45 of reverse-logistics cost per gross order (about 9% of revenue) and an implied all-in cost of about A$43 per returned order. Resale recovery is not netted. The Cettire delivered-margin figures (16.1% in FY25 versus 20.9% in FY24) come from the Cettire (ASX:CTT) FY25 Annual Report, lodged 27 August 2025; Cettire does not disclose an explicit return rate.
The macro backdrop uses ABS data via the ABS Statistics MCP: Retail Trade (cat. 8501.0, current prices, seasonally adjusted; June 2025 = A$37,906.6m, up 4.87% year on year), Consumer Price Index (cat. 6401.0; up 4.09% year on year to the March 2026 quarter) and the Wage Price Index (cat. 6345.0; up 3.22% year on year over the same period). All three series are indexed to 100 at the 2023-Q1 base in the chart so the "prices outran wages" read is legible without a secondary axis. Market sizing uses the Storeleads AU geo cut (June 2026): 153,140 AU Shopify stores, with apparel the largest category at 32,968 stores.
A benchmark only pays off when someone acts on it, which is what an Australian virtual CFO does for a growing Australian brand.
Frequently asked questions
what is the average ecommerce return rate in australia?
There is no official figure. The hard datapoint is that 41% of online shoppers returned at least one item in 2025 (AusPost), which is the share of people who returned something, not the share of orders returned. As a working per-order benchmark, fashion sits around 31% and the all-category online rate is likely in the high-teens to low-20s.
is australia's return rate really 41%?
No. The 41% is shopper prevalence: 41 of every 100 online shoppers returned at least one item during the year. Your per-order return rate, the number that actually hits your P&L, is lower. For apparel it is roughly 31% of orders, for electronics closer to 11%.
which product categories have the highest return rates for australian online stores?
Apparel and footwear, by a wide margin. Fashion sits around 31% on the AU marker, footwear in the low-20s, then homewares around 19%, beauty around 12% and electronics around 11%. Jewellery is the lowest at around 4%. The driver is fit, sizing and bracketing, not geography.
how does australia's ecommerce return rate compare to the us and uk?
Australia sits between the APAC average (5-15% overall) and UK fashion (30-35%), roughly in line with US online apparel at 24.4% (Coresight, 12 months to March 2023). AU consumer behaviour is Western, so it is far above the APAC average and a little below UK fashion-driven returns.
what does a high return rate cost an australian dtc brand per order?
On a A$150 AOV fashion brand at a 31% return rate, returns cost about A$13.45 per gross order, roughly 9% of revenue, before any resale recovery. That is A$3-7 to process and inspect each return plus A$10-25 of return shipping.
how can i reduce my return rate without killing conversion?
Attack the fit and sizing data first, since that is where most apparel returns come from. Then push exchanges over refunds, and consider paid returns for serial bracketers while keeping a free first return. Just watch Australian Consumer Law: you cannot charge for returns of faulty goods.
should i charge for returns in australia or keep them free?
Keep the first return free; it protects first-time conversion, which is where a paid policy does the most damage. The decision really turns on your bracketing concentration: if a thin slice of customers drives the bulk of your returns, a paid-return option that only kicks in for repeat returners trims that volume without taxing everyone else.
how do returns show up in my margin and p&l?
Returns hit delivered margin: revenue reverses, but the outbound shipping, reverse shipping and processing costs do not. Cettire's delivered margin fell to 16.1% in FY25 from 20.9% a year earlier, partly on refund-related costs. Model returns as their own line, not as a footnote to gross margin.
Related Eightx benchmarks: Average Australian ecommerce return rate by vertical 2026: what AusPost, Power Retail and the ASX actually disclose and AU online retail just lost its scoreboard: what 12.7% means and what to use instead. For hands-on help with your numbers, talk to our fractional CFO team.