
eCommerce
Canada Ecommerce Return Rate Benchmark 2026
Canada publishes no national ecommerce return rate. The working per-order benchmark, built from North American and global category data applied to Canadian planning, is roughly 1 in 5 online orders (~19-21% blended): apparel around 30%, footwear around 23%, electronics around 11%, beauty around 8%. A single return costs 50-66% of order value fully loaded.
Key Takeaways
- There is no Statistics Canada national ecommerce return rate. Every category and blended figure here is a North American / global merchant benchmark applied to Canadian planning, not a measured Canadian number. Treat them as working benchmarks, not a census.
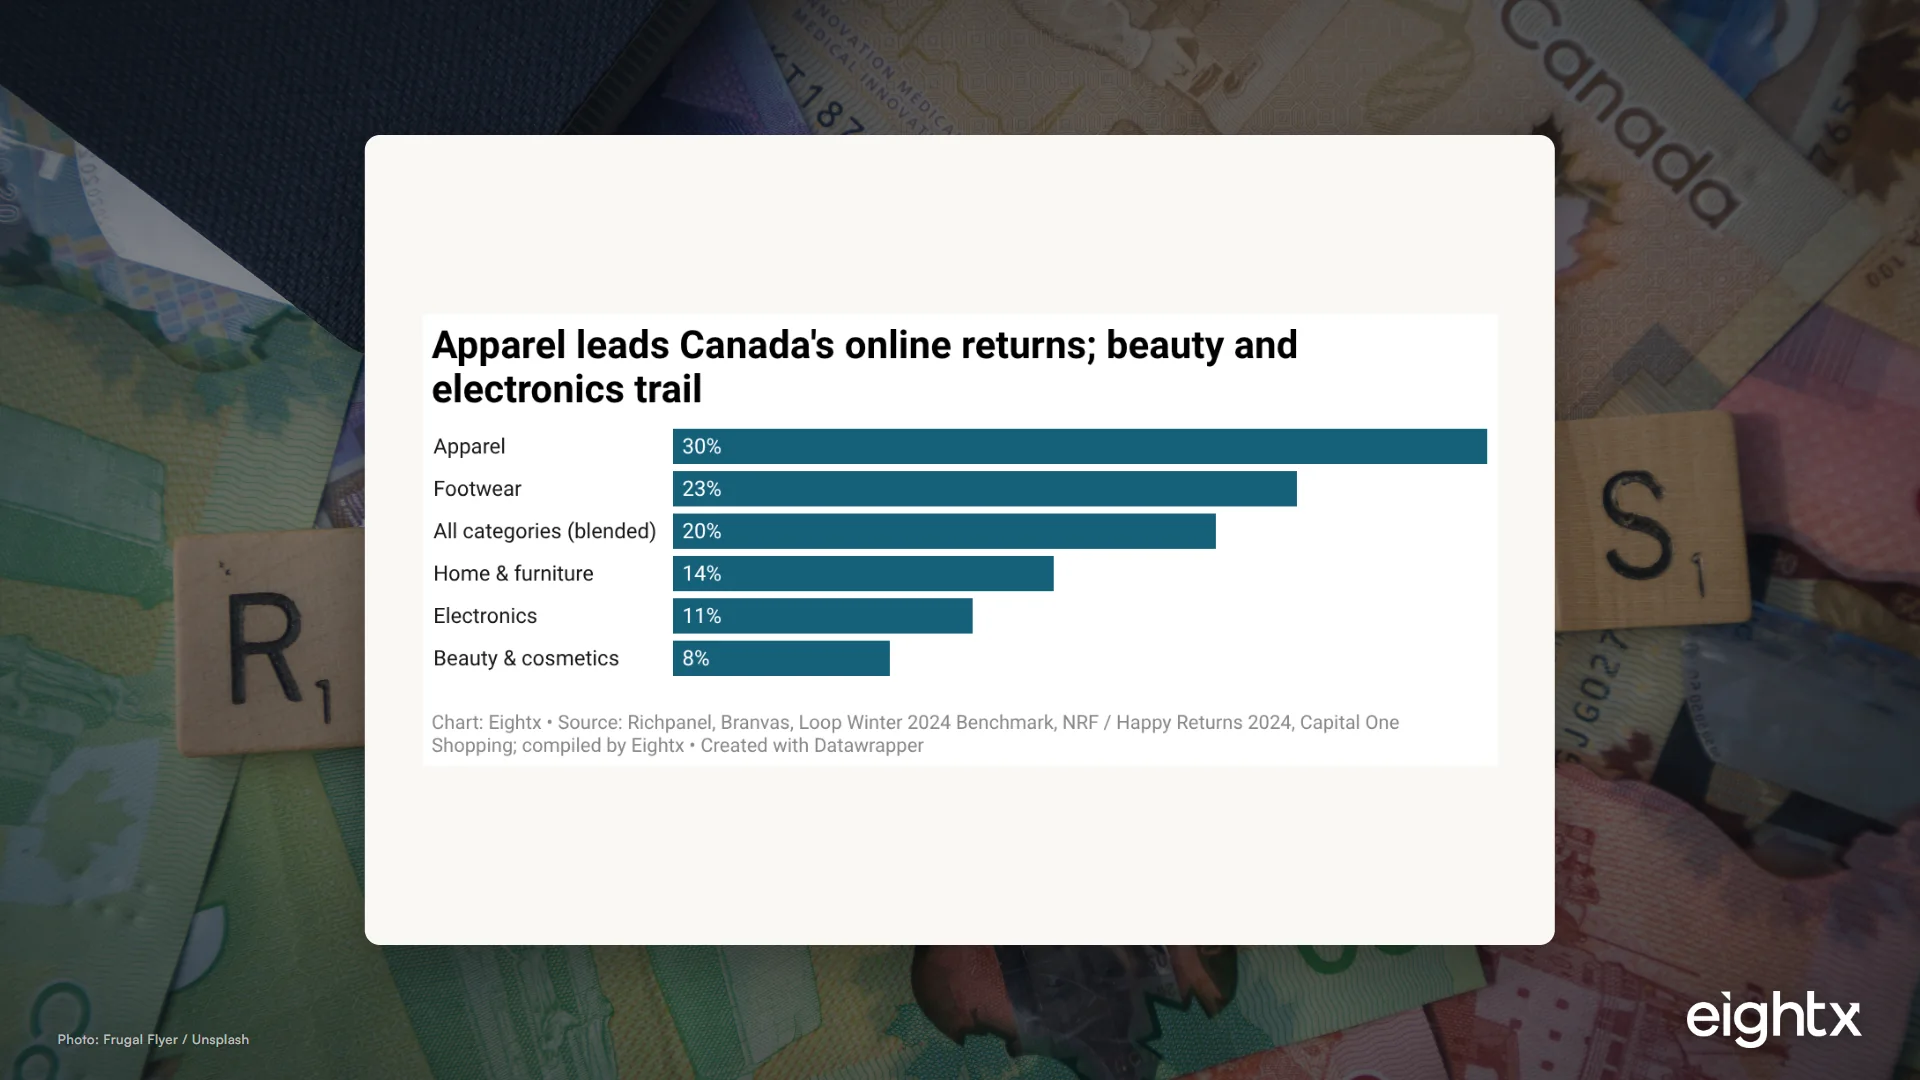
- The working per-order benchmark is roughly 1 in 5 online orders, about 19-21% blended. By category: apparel around 30%, footwear around 23%, home and furniture around 14%, electronics around 11%, beauty around 8%.
- Canada is structurally different from the US. Ecommerce was just 6.1% of total retail trade in December 2024 (StatCan), roughly half US penetration, so Canadian brands have less scale to absorb the fixed cost of reverse logistics per return.
- A single return costs 20-30% of order value in pure reverse logistics and 50-66% fully loaded once you add processing, restocking, customer service and markdowns. On a $60 order that is roughly $17 to $40+ per returned order.
- The weak loonie is a quiet FX tax on returns. CAD/USD sat at 0.7179 on June 10, 2026 (Bank of Canada), so every USD-denominated return-shipping or 3PL invoice inflates when converted. Stop benchmarking against US headlines and model returns on your own P&L.
If you run a Canadian online store and you have tried to benchmark your return rate, you have probably hit the same wall we do. Canada does not publish an NRF-style national returns table, so most "Canadian return rate" numbers floating around are US figures with the country name swapped out. This post fixes that. We take the macro numbers Canada does publish, build a defensible per-order benchmark by category on top of the best North American and global data, and then put a dollar figure on what each return actually costs your margin. AOV here means average order value, and delivered margin is gross margin after all the shipping and fulfilment costs to get an order to a customer and back.
What counts as a normal return rate in Canada
Start with the honest part. There is no Statistics Canada series for ecommerce returns. StatCan publishes plenty of retail data, including ecommerce sales, but it does not publish a national online return rate, let alone one broken out by category. So when someone quotes you "Canada's return rate," they are almost always quoting a US or global benchmark and attaching the word "Canada" to it. We are not going to pretend otherwise. Every return-rate figure in this post is a North American or global merchant benchmark applied to Canadian planning, and we say so everywhere it appears.
With that caveat locked in, the working benchmark is clear. Roughly 1 in 5 online orders comes back, about 19-21% blended across categories. The US National Retail Federation and Happy Returns put online returns near 20.4% in their 2024 study (16.9% all-channel), and Optoro has cited ecommerce returns up to 17.6%. Those are the closest defensible anchors we have, and the drivers behind them, fit, sizing and bracketing, do not change at the Canadian border. If the difference between a return rate and shopper prevalence is new to you, our true cost of apparel returns breakdown walks through how returns actually hit your margin before you try to model it.
So the honest answer to "what is my benchmark" is that you build one, by placing global category shapes against the numbers Canada does publish and the macro backdrop. That is exactly what the rest of this post does.
Returns by category: where your mix decides your fate
Returns are structural, not geographic. An apparel order comes back because the fit was wrong, the size was a guess, or the shopper bought three sizes intending to keep one. None of that changes in Canada. That is why the global category shape transfers cleanly here, and why we can build a working Canadian benchmark with confidence even without a local table.
Here is the working per-order benchmark. Each figure is a midpoint of the cited range, applied to Canadian planning. These are not measured Canadian numbers; they are the best available category shape placed against Canadian context.
The table below carries the full range and the primary driver behind each category, since the midpoint alone hides how wide the spread runs.
| Category | Typical return-rate range | 2026 midpoint | Primary driver |
|---|---|---|---|
| Apparel / fashion | 20-40% | ~30% | Fit / sizing / bracketing |
| Footwear | 17-30% | ~23% | Sizing / comfort |
| Home & furniture | 8-20% | ~14% | Colour/size mismatch / damage |
| Electronics | 8-15% | ~11% | Defect / compatibility |
| Beauty & cosmetics | 5-12% | ~8% | Hygiene rules keep it low |
| Blended (all categories) | 19-21% | ~20% | Mix-weighted |
The spread is wide and predictable. Apparel and footwear sit at the top because fit and bracketing drive them. Beauty and personal care stay low because hygiene rules limit returns. Electronics returns are mostly defects and compatibility, not taste. The structural read matters for where you spend your energy. If you sell apparel, your return rate is a product and merchandising problem before it is a logistics problem. If you sell electronics or beauty, returns are a smaller line and your effort is better spent elsewhere. The pattern we see again and again with operators is treating returns as one undifferentiated cost when the category mix should tell them exactly where to push.
A practical guardrail: benchmark fashion against fashion. If you are grading your apparel brand against the blended 20% number, you are setting the bar too low and you will think your returns are a crisis when they are normal. For Canadian apparel, a low-to-mid 20s per-order rate is healthy, around 30% is normal, over 35% is worth investigating, and a suspiciously low rate may mean friction is suppressing legitimate returns and quietly hurting repeat purchase.
Canada is not the US: penetration, the loonie, and what it changes
Here is where the Canadian context actually bites, and it is not the return rate itself. It is everything around it.
First, penetration. Canadian retail ecommerce was $4.3 billion in December 2024, just 6.1% of total retail trade (Statistics Canada, The Daily, February 21, 2025). That is roughly half US online penetration, which sits in the mid-teens. Lower penetration means Canadian return volumes are smaller, but the per-order economics are harder: there is less scale to spread the fixed cost of a reverse-logistics operation across. A US brand processing ten times the return volume amortizes its 3PL and warehouse intake cost far more efficiently than a Canadian brand processing the same category mix.
Second, the loonie. CAD/USD sat at 0.7179 on June 10, 2026 (Bank of Canada), down from about 0.74 in late January 2026. For any Canadian brand that ships or processes returns cross-border, a weak loonie inflates every USD-denominated return-shipping and 3PL invoice the moment you convert it. That is a quiet FX tax on returns that a US competitor never pays.
Third, the macro backdrop is scaling the drag. Total Canadian retail sales hit $72.67 billion in March 2026, up 3.4% year over year from $70.27 billion a year earlier (StatCan Table 20-10-0056-01, seasonally adjusted). Topline retail is growing, so the absolute dollar value of returns drag scales right along with it. Meanwhile the Bank of Canada has held the overnight rate at 2.25% since October 2025, down from 3.25% in early 2025. Cheaper capital slightly eases the working-capital cost of returned inventory sitting in reverse-logistics limbo, but it does nothing to change the per-order margin hit.
| Metric | Value | Date | Source |
|---|---|---|---|
| Retail ecommerce sales | $4.3B (6.1% of retail) | Dec 2024 | StatCan, The Daily |
| Total retail sales | $72.67B (+3.4% YoY) | Mar 2026 | StatCan 20-10-0056-01 |
| Bank of Canada overnight rate | 2.25% | Jun 2026 | BoC V39079 |
| CAD/USD | 0.7179 | 2026-06-10 | BoC FXCADUSD |
| Active Canadian Shopify stores | 170,499 | 2026-06-11 | StoreLeads |
How does that stack up internationally? Return rates by category are roughly comparable across Western markets because the drivers are structural, but penetration differs sharply. Canada's 6.1% online share of retail sits below the United States (mid-teens), the United Kingdom (mid-20s percent) and Australia. We flag those comparison figures as latest-available national approximations with definitions that differ by country; only the Canadian 6.1% is locked to a cited primary source here. The same benchmark series exists for other markets if you want to cross-check the build: see our Australia ecommerce return rate benchmark for the equivalent country-level analysis.
The real cost of a return (the margin math operators skip)
A return is not a neutral event where revenue simply reverses. The revenue reverses, but the costs do not. You paid to ship the order out, you pay again to ship it back, and you pay a third time to receive, inspect, restock and often mark down the item. The benchmark stack: a single return costs 20-30% of order value in pure reverse logistics, and 50-66% fully loaded once you count markdowns and write-offs. Industry compilations put the all-in figure near 66% of the original item price. In dollars, that is roughly $10-30 per return for soft goods and $30-65 for electronics or bulky items.
Put that on a worked example. Take a $60 order. Here is where the money goes on a fully-loaded return, illustrative, not a measured Canadian average.
| Cost component | Low (CAD) | High (CAD) |
|---|---|---|
| Return shipping (reverse logistics) | $5 | $15 |
| Processing labour (receive / inspect / restock) | $8 | $15 |
| Restocking / refurbishment | $2 | $10 |
| Customer service handling | $2 | $5 |
| Markdown / write-off on resale | $0 | COGS |
| Fully-loaded total | ~$17 | ~$40+ (≈50-66% of value) |
Now spread that across every gross order. A store at a 20% blended return rate, paying roughly $25 all-in per returned order on a $60 AOV, carries about $5 of reverse-logistics cost per gross order, or roughly 8% of revenue, before recovering anything on resale. Push the mix toward apparel at a 30% rate and that drag climbs past 12% of revenue fast. When we have worked through this alongside operators, the fix has never been to ban returns. One apparel brand we worked with was running returns in the mid-30s percent and had the whole cost buried inside "shipping," with a roughly $2M pile of returned inventory nobody had counted, much of which could not go back on the shelf at full price. The fix was to make returns a named line on the P&L so the cost is visible and managed, rather than buried where nobody owns it.
Stop treating returns as a footnote to gross margin. At a 20% return rate and roughly $25 all-in per returned order on a $60 AOV, returns cost about 8% of revenue before resale recovery, and an apparel-heavy mix pushes that past 12%. That is the difference between a brand that thinks it is profitable and one that actually is.
Why the macro backdrop is pushing returns up
Returns do not rise in a vacuum. They rise when the consumer gets more price-conscious and starts bracketing harder, ordering multiple sizes or options with the intent to keep one and send the rest back. The Canadian macro picture is doing exactly that. Retail keeps growing in dollar terms, up 3.4% year over year, but with CPI running near 2.8% year over year (StatCan), a meaningful share of that growth is price, not volume, and a value-conscious shopper is a careful, deliberate one.
A careful shopper orders more options to avoid paying for shipping twice, keeps the one that fits, and returns the rest. That behaviour shows up as a higher return rate even when nothing about your product changed. It is also why a generous free-returns policy that worked fine in 2021 can quietly become a margin leak in 2026: the same policy now sits in front of a more deliberate shopper who uses it harder.
The size of the exposure is real. StoreLeads tracks 170,499 active Canadian Shopify stores, the addressable base of DTC operators this benchmark serves. We could not retrieve a reliable per-category Canadian store count this run, so we are not going to invent one, but apparel-heavy storefronts sit at the high-return end of the category mix, and a lot of Canadian operators are carrying this cost whether they have measured it or not.
How Canadian brands actually pull the rate down
The goal is not zero returns. A store with suspiciously low returns is often suppressing legitimate ones with friction, and that hurts repeat purchase. The goal is to cut the returns you do not want, the bracketed and avoidable ones, without taxing the customers you do want.
Start with fit and sizing, because that is where most apparel returns are born. Better size guides, fit-finder tools, consistent sizing across SKUs and honest product photography do more to cut returns than any policy change. Next, push exchanges over refunds: an exchange keeps the revenue and the customer, where a refund loses both. Then look at your bracketers. If a small group of customers drives a large share of your returns, a paid-return option for repeat returners, while keeping a free first return, can trim volume without scaring off first-time buyers.
Mind the cross-border math while you are at it. With the loonie near 0.72, any return leg that touches a US 3PL or a USD-priced carrier costs you more in Canadian dollars than the headline rate suggests. Where you can, keep the reverse leg domestic. The operators who win here treat returns as a product and merchandising problem first and a policy problem second. The policy levers cap the bleeding; the product levers stop the wound.
The operator decision is the same one every time. Stop benchmarking against the US headline. Build your own per-order benchmark by category, model returns as a real line item on your P&L using your actual AOV and reverse-logistics cost, and pull the product and policy levers before returns quietly eat your delivered margin.
Sources and methodology
There is no published Canadian NRF-equivalent per-order return rate table, by category or otherwise. That is the central limitation of any Canadian returns benchmark and the reason this post builds a working benchmark rather than reporting a measured one. Every return-rate figure here is a North American or global merchant benchmark applied to Canadian planning, and is labelled as such throughout.
The category benchmark (apparel 20-40%, footwear 17-30%, home 8-20%, electronics 8-15%, beauty 5-12%, blended 19-21%) is compiled from Richpanel, Branvas, the Loop Returns Winter 2024 Benchmark Report, and NRF / Happy Returns 2024 (16.9% all-channel, approximately 20.4% online). Single-point 2026 midpoints (apparel approximately 30%, footwear approximately 23%, electronics approximately 11%) are the centre of those ranges, not measured Canadian data.
The cost model uses an NRF-aligned reverse-logistics cost stack via Richpanel (20-30% of order value for pure reverse logistics) and industry compilations (fully loaded approximately 66% of item price), worked on an illustrative $60 order. The per-gross-order drag (roughly 8% of revenue at a 20% return rate, rising past 12% for an apparel-heavy mix) is derived from that stack and is illustrative; resale recovery is not netted.
The Canadian macro context is primary-source and locked. Retail ecommerce sales of $4.3 billion, 6.1% of total retail trade in December 2024, come from Statistics Canada, The Daily (February 21, 2025). Total retail sales of $72.67 billion in March 2026, up 3.4% year over year from $70.27 billion, come from StatCan Table 20-10-0056-01 (vector v1446859483, seasonally adjusted). The Bank of Canada overnight rate of 2.25% (held since October 2025, series V39079) and CAD/USD of 0.7179 on June 10, 2026 (series FXCADUSD) come from the Bank of Canada. Market sizing uses the StoreLeads Canadian geo cut (June 2026): 170,499 active Canadian Shopify stores. Per-category Canadian store counts were not retrievable this run and are not reported.
Cross-country penetration comparisons (US mid-teens, UK mid-20s percent, Australia) are latest-available national-statistics approximations whose definitions differ by country; only the Canadian 6.1% figure is locked to a cited primary source here, so treat the international comparison as directional.
Frequently asked questions
what is the average ecommerce return rate in canada?
There is no official Statistics Canada figure. The working per-order benchmark, built from North American and global category data, is roughly 1 in 5 online orders, about 19-21% blended. Apparel runs higher at around 30% and electronics lower at around 11%. Treat these as planning benchmarks, not a measured Canadian census.
is there an official statistics canada number for online return rates?
No. StatCan publishes retail and ecommerce sales (ecommerce was $4.3B, or 6.1% of total retail trade, in December 2024), but it does not publish a national online return rate by category. Any "Canada return rate" you see is a North American or global benchmark applied to Canada, so treat it as a working number.
how do return rates differ by product category for canadian online retailers?
Apparel and footwear are the bleeders. Apparel runs around 30% of orders, footwear around 23%, home and furniture around 14%, electronics around 11% and beauty around 8%. The driver is fit, sizing and bracketing, not geography, which is why the global category shape transfers to Canada.
how does canada's ecommerce return rate compare to the us, uk, and australia?
Return rates are roughly comparable by category because the drivers are structural. What differs is penetration: Canadian ecommerce was 6.1% of retail in December 2024, well below the UK (mid-20s percent), the US (mid-teens) and Australia. Lower penetration means Canadian brands have less scale to absorb reverse-logistics fixed cost per return.
what does a high return rate cost a canadian dtc brand in gross margin?
A single return costs 20-30% of order value in pure reverse logistics and 50-66% fully loaded once you add processing, restocking, customer service and markdowns. In dollars that is roughly $10-30 all in for soft goods and $30-65 for electronics or bulky items, with industry compilations putting the fully-loaded figure near 66% of the original item price. Spread across gross orders at a 20% return rate, returns can quietly cost about 8% of revenue, and an apparel-heavy mix pushes that past 12%, before any resale recovery.
how does the weak canadian dollar affect cross-border return costs?
CAD/USD sat at 0.7179 on June 10, 2026 (Bank of Canada), down from about 0.74 in late January. If you ship or process returns cross-border, every USD-denominated reverse-shipping and 3PL invoice inflates when you convert it to Canadian dollars, so a weak loonie quietly raises your effective cost per return.
how can canadian shopify brands reduce their return rate?
Attack fit and sizing first, since that is where most apparel returns are born: better size guides, fit tools, consistent sizing and honest photography. Then push exchanges over refunds to keep the revenue and the customer, and consider paid returns for serial bracketers while keeping a free first return. Product and merchandising fixes beat policy changes.
what return rate should i budget for if i sell mostly clothing in canada?
Budget around 30% for apparel and benchmark fashion against fashion, not against the blended 20% number. A rate in the low-to-mid 20s is healthy, around 30% is normal for apparel, and over 35% is worth investigating. A suspiciously low rate can mean friction is suppressing legitimate returns and quietly hurting repeat purchase.
Related Eightx benchmarks: Canada ecommerce KPI benchmark 2026: AOV, CAC, conversion and return rate by vertical and Canada e-commerce share of retail 2026: StatCan says 5.7%, forecasters say 12%. Use the right one. For hands-on help with your numbers, talk to our fractional CFO team.