
eCommerce
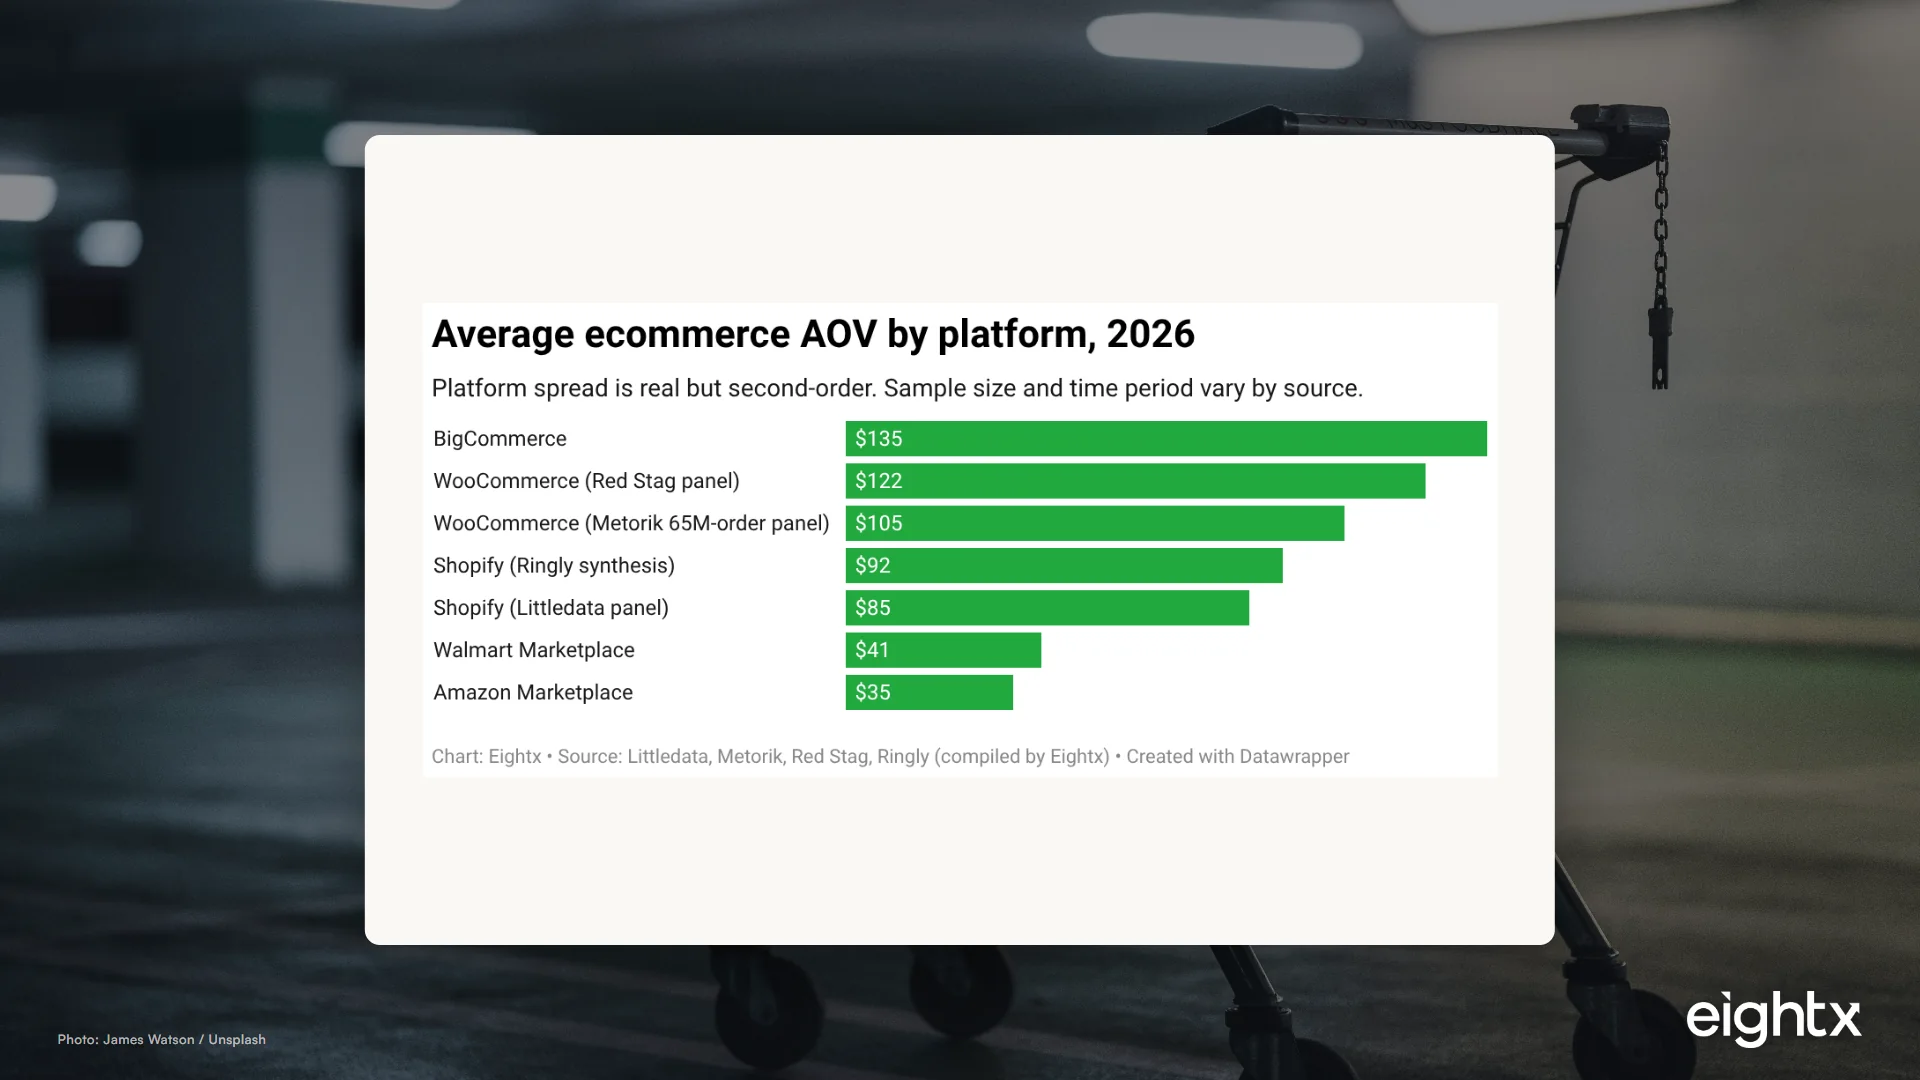
Average ecommerce AOV by platform 2026: Shopify $85, WooCommerce $105 to $122, BigCommerce $120 to $150
Shopify averages $85 AOV, WooCommerce $105 to $122, BigCommerce $120 to $150. Platform alone does not drive AOV but the merchant mix on each platform does. If your AOV is below your platform average, the gap is usually product bundling, price anchoring, or checkout flow, not traffic quality. Fix the economics before scaling spend.
Key Takeaways
- Shopify $85 (Littledata), WooCommerce $105 to $122 (Metorik plus a B2B-weighted panel), BigCommerce $120 to $150 (vendor synthesis). The cross-platform spread is real, roughly $30 to $70, but smaller than founders expect.
- The on-platform spread is wider than the cross-platform spread. Littledata's top-decile Shopify AOV is $311. The bottom decile is under $40. That is 8x inside one platform, versus 1.5x across Shopify and BigCommerce.
- Three Shopify Plus brands, three different worlds. FIGS reports $120 AOV, A.K.A. Brands $77, BARK $31 (all 10-K disclosures, FY2025). Same platform. AOVs 4x apart. Customer and product mix drove it, not Shopify.
- WooCommerce's higher AOV is a B2B artifact, not a platform feature. Both Metorik (65 million orders) and the second published panel flag B2B and wholesale weighting. A pure-DTC WooCommerce store sits in the same $60 to $100 band as Shopify.
- Replatforming for AOV is almost always a bad reason to replatform. The 5 to 15% lift brands report post-migration is usually the merchandising and UX work, not the platform. Do that work without the migration first.
If you are evaluating a replatform from WooCommerce to Shopify Plus and the case for the move is "we'll lift AOV," stop. The 2026 cross-platform data says the published panel spread between Shopify ($85) and BigCommerce (~$135 midpoint) is about 1.5x, while customer mix, vertical, and basket mechanics swing AOV 4x to 10x. Holding a single store constant, replatform lift typically lands at 5 to 15% (and most of that is the merchandising rebuild that ships alongside the migration, not the platform itself). Three public DTC brands on the exact same Shopify Plus instance report AOVs of $31, $77, and $120 in their 2026 10-Ks. The platform is identical. AOV (average order value) is what each shopper spends in a single transaction. This post pulls the only three publicly defensible 2026 panel benchmarks (Littledata for Shopify, Metorik for WooCommerce, and a cross-platform vendor synthesis) plus three SEC 10-K disclosures to show what the platform actually drives and what it doesn't.
What happened: the 2026 cross-platform AOV numbers
The only directly comparable 2026 source covering Shopify, WooCommerce, BigCommerce, Amazon, and Walmart in one publication is a 2026 cross-platform vendor synthesis of ecommerce AOV data. Cross-referenced against the larger single-platform panels (Littledata for Shopify, Metorik for WooCommerce), the picture looks like this.
The spread between the lowest storefront platform (Shopify at $85 per Littledata's opt-in panel) and the highest (BigCommerce midpoint at $135) is about $50, or roughly 1.5x. That is meaningful but not a step-change. For context, the spread across verticals on Shopify alone (EasyApps 2026 benchmark: $48 food and beverage to $458 luxury) is roughly 10x. The within-platform vertical effect dwarfs the between-platform effect.
A second observation: Amazon and Walmart Marketplace sit at $35 and $41 to $42 respectively. That gap to storefront platforms is real, but it reflects how marketplaces are used (single-item, search-driven purchases) rather than the platforms themselves. Don't compare Amazon AOV to your Shopify AOV. They are different shopper behaviors.
The 'Shopify AOV' is a distribution, not a number
Quoting "$85" or "$92" as the Shopify AOV is roughly as useful as quoting one number for "the average US household income." It is technically true and operationally useless. Littledata's Shopify panel publishes thresholds. The median is $85, the top 20% of stores clear $192, the top 10% clear $311.
CartyLabs' 5,000-store Shopify cohort tells the same story with different bands: median $65 to $95, top quartile $110 to $180, top decile $180+, bottom decile under $40. The on-platform spread between top-decile and bottom-decile Shopify stores is 8x. The spread between Shopify and the next platform up (WooCommerce, BigCommerce) is 1.2x to 1.6x. The same pattern shows up inside a single store: our mobile vs desktop AOV benchmark finds a 31% gap on Shopify ($97.40 desktop vs $74.20 mobile), and that is one variable inside one platform. Within-platform variance routinely runs larger than between-platform variance.
If you are benchmarking your Shopify AOV against "the Shopify average," you are using the wrong reference. Benchmark against the decile band of stores that look like you (similar vertical, similar revenue size, similar customer type). The variance inside Shopify is so wide that the platform-level average is almost noise.
Three Shopify Plus brands, three completely different planets
The cleanest proof that platform is not the AOV driver comes from public-company filings. Three public DTC brands disclosed AOV in their FY2025 10-Ks. All three are on Shopify Plus (confirmed via Storeleads). All three reported wildly different AOVs.
Brand (ticker) Platform FY2023 AOV FY2024 AOV FY2025 AOV Vertical A.K.A. Brands (AKA) Shopify Plus $80 $79 $77 Apparel (Princess Polly, Petal & Pup, mnml) FIGS (FIGS) Shopify Plus n/d $113 $120 Medical scrubs apparel BARK (BARK) Shopify Plus n/d $31.34 $31.04 Subscription dog box
FIGS at $120, A.K.A. Brands at $77, BARK at $31. Same platform. AOVs ranging 4x. FIGS sells multi-item kits of medical scrubs to healthcare workers building out a full uniform. A.K.A. Brands sells fast-fashion apparel to Gen Z shoppers buying one or two pieces at the trend cycle. BARK sells a single monthly subscription box. The platform is identical. The customer journey, basket mechanics, and product economics are not.
If platform were the AOV lever founders think it is, three brands on the exact same Shopify Plus instance would have AOVs within 20% of each other. They have AOVs 4x apart. Platform is the third or fourth factor in AOV. Product price, basket mechanics, and customer mix are the first three.
What we don't know: Adobe Commerce, Salesforce Commerce Cloud, custom and headless
A real limitation of the 2026 data: no first-party AOV benchmark exists for Adobe Commerce (Magento), Salesforce Commerce Cloud, or custom and headless stacks. Adobe does not publish platform-wide AOV in its IR materials. Salesforce does not break out Commerce Cloud AOV. Storeleads does not index BigCommerce or Magento stores at our subscription tier (and 402-errors on custom platforms like the headless stacks Solo Stove and Athleta run on).
The inferred ranges based on enterprise B2B weighting are $150 to $300+ for Adobe and Salesforce, but that is an inference based on the merchant tier each platform serves, not a measured panel. Adobe publishes customer case studies with "+15% AOV after migration" outcomes, but rarely the absolute pre and post values verifiable to a primary source. Use Adobe and SFCC AOV figures only as directional.
The honest read: if you are on Adobe Commerce or a custom stack and want to benchmark your AOV, you have to do it against your own historical trend and against the public 10-K disclosures from peers in your vertical, not against a published platform average. That benchmark does not exist.
What actually moves AOV (platform is third on the list)
Three levers in order of impact:
1. Product price point and category mix. A $40 mascara brand and a $200 outerwear brand will report different AOVs regardless of platform. The vertical effect on Shopify alone is 10x ($48 food and beverage to $458 luxury per EasyApps 2026). This is by far the biggest driver. If your AOV is "low for your platform," check your category benchmark first; our AOV by ecommerce vertical benchmark is the right reference, not a single cross-platform average.
2. B2B share and bulk-order patterns. This is why WooCommerce's reported AOV is higher than Shopify's. CartyLabs' B2B-tier Shopify data shows median B2B AOV of $650 to $1,400 and top-decile $4,500+. If your store has any B2B share (wholesale, distributor, large-volume B2C shoppers), your blended AOV reflects that mix. Pure-DTC stores on WooCommerce and Shopify sit in roughly the same $60 to $100 band by vertical.
3. Bundle, free-shipping threshold, and upsell stack. EasyApps' 2026 benchmark puts bundle and threshold lift at 15 to 35% AOV. This is post-platform-choice merch work. You can do it on any platform. Brands that report a "post-replatform AOV lift" usually rebuilt their upsell flow at the same time. The lift is the upsell work.
Platform comes in around fourth on the list, behind those three. Founders have asked us this exact question on calls: "We're thinking of moving from WooCommerce to Shopify Plus to lift AOV." The honest answer is do the merchandising and basket-mechanics work first, on your current platform. If you still need to migrate after that, fine. But you'll capture most of the AOV lift before you spend six figures on the platform switch.
How to read your AOV against the 2026 benchmarks
Three steps:
Step 1: Identify your platform tier. Not the platform brand. Tier. Shopify SMB is roughly Basic and Shopify plans. Shopify Plus is mid-market. BigCommerce Standard and Plus are SMB; BigCommerce Enterprise is mid-market and enterprise. Adobe Commerce is enterprise. Custom and headless is enterprise and marketplaces.
Step 2: Pull your vertical's AOV band. Use CartyLabs' industry breakdown, EasyApps' Shopify-by-industry, or the public 10-K disclosures from listed peers in your category. The vertical effect is 5 to 10x larger than the platform effect.
Step 3: Adjust for B2B share and basket mechanics. If your blended AOV looks "high for your vertical," check your B2B share. If it looks "low for your vertical," check your bundle, threshold, and upsell stack. Those are the operational levers. Platform is rarely the answer.
If after all three you still think your platform is the constraint, the right next step is not to replatform. It is to talk to a CFO who has watched dozens of brands run this exact migration project, because the unit-economics math on a six-figure replatform rarely works on AOV alone.
Sources and methodology
This post pulls four primary classes of source. First, the Littledata Shopify panel, an opt-in merchant sample with server-side GA4 tracking that publishes the median Shopify AOV ($85), top-20% threshold ($192), and top-10% threshold ($311). Second, the Metorik "Insights for WooCommerce" 2026 edition, which analyzes 65 million WooCommerce orders and publishes an average order value of $105 across that sample. The Metorik panel is by far the largest WooCommerce data set publicly accessible.
Third, public-company 10-K filings pulled via SEC EDGAR full-text search for the phrase "average order value" across forms 10-K and 10-Q filed between 2025-06-01 and 2026-05-29. Three Shopify Plus brands disclosed AOV cleanly: A.K.A. Brands (accession 0001865107-26-000008, filed 2026-03-05, FY2025 AOV $77 across Princess Polly, Petal & Pup, and mnml), FIGS (accession 0001628280-26-012333, filed 2026-02-26, FY2025 AOV $120), and BARK (accession 0001819574-25-000024, filed 2025-06-04, FY2025 AOV $31.04). Storeleads confirmed each is currently on Shopify Plus.
Fourth, a 2026 cross-platform vendor ecommerce AOV synthesis (the only single publication comparing Shopify, WooCommerce, BigCommerce, Amazon, and Walmart with numerical AOVs), a second B2B-weighted WooCommerce panel (2024 to 2025, $122 AOV), CartyLabs' 5,000-store Shopify cohort distribution, and EasyApps' Shopify-by-industry 2026 benchmark.
Cross-checks. Shopify Inc.'s most recent 10-Q (period ended Sept 30, 2025) discloses $254.6B in GMV over the trailing nine months but no order count, so a SHOP-derived platform-wide Shopify AOV cannot be calculated from primary IR. Adobe (Commerce segment) and BigCommerce (BIGC) likewise do not disclose AOV in their IR materials. All cross-platform AOV figures in this post are from third-party benchmarks, not investor relations, and treated accordingly.
Limitations. The cross-platform panel does not disclose sample size or geography; treat it as directional. The single Shopify panel (Littledata) is opt-in, which biases toward merchants who use server-side analytics tooling (slightly larger, more sophisticated stores). The 10-K AOV figures are blended (online plus retail where applicable) and reflect each company's reporting convention. No platform-wide benchmark exists for Adobe Commerce, Salesforce Commerce Cloud, or custom and headless in 2025 to 2026. Marketplaces (Amazon, Walmart) are listed for reference but are not comparable to storefront platforms.
Update cadence. This is a living index, refreshed quarterly when new public-company 10-Ks land and when Littledata or Metorik republish their panels. Next planned refresh: August 2026 after Q2 earnings season closes.
Frequently asked questions
what's the average aov on shopify vs woocommerce vs bigcommerce in 2026?
Shopify sits at $85 (Littledata's opt-in panel) or $92 (multi-source vendor synthesis). WooCommerce sits at $105 (the 65-million-order Metorik panel) or $122 (a more B2B-weighted panel). BigCommerce sits at $120 to $150+ per the same 2026 vendor synthesis, enterprise-weighted. Amazon and Walmart marketplaces are far lower at $35 to $42. No public benchmark for Adobe Commerce, Salesforce Commerce Cloud, or custom or headless in 2025 to 2026.
will replatforming from woocommerce to shopify hurt my aov?
Only if you also strip out the B2B and bulk-order mechanics that were inflating your WooCommerce AOV in the first place. If your WooCommerce store has wholesale tiers, custom pricing, or large-cart shoppers, you need to rebuild those flows on Shopify before you migrate. Otherwise the AOV drop you see post-migration is the loss of those mechanics, not the platform. Pure-DTC stores on either platform sit in roughly the same $60 to $100 band by vertical.
does shopify plus have a higher aov than basic shopify?
Directionally yes, because Plus skews to higher-revenue brands with more mature merchandising. Littledata's top-20% Shopify threshold ($192) and top-10% threshold ($311) sit largely in the Plus cohort. But it is the merchant maturity that drives AOV, not the plan upgrade itself. Moving from $300 a month Advanced to $2,500 a month Plus does not move AOV; the merchandising and bundle work you do alongside the upgrade does.
why is woocommerce's reported aov higher than shopify's if shopify has the bigger brands?
Because WooCommerce's published panels are B2B and wholesale weighted. Both published WooCommerce panels explicitly call this out. WooCommerce is the default platform for B2B catalog stores, distributors, and wholesale shops where order values are $200 to $500+ by definition. Strip out the B2B share and pure-DTC WooCommerce sits next to Shopify.
is there published aov data for magento or adobe commerce in 2026?
No. Adobe does not disclose platform-wide AOV in IR. Salesforce does not break out Commerce Cloud AOV. No third-party panel has published Adobe Commerce or SFCC AOV in 2025 or 2026 with sample-size disclosure. Inferred ranges based on enterprise B2B weighting are $150 to $300+, but that is an inference, not a measured benchmark. If anyone tells you 'Adobe Commerce AOV is $X' confidently, ask them where the sample came from.
what should my aov be if i'm on shopify doing $5m?
Depends on your vertical, but the framework is: hit the Shopify median band ($65 to $95 per CartyLabs' 5,000-store sample) and you are at par; clear $110 to $180 (top quartile) and you are doing the merch and bundle work right; above $192 (Littledata's top-20% threshold) and you are in elite territory. Below $40 means something specific is wrong, usually single-item buys with no upsell stack.
how much aov lift can i actually expect from a replatform?
Brands typically report 5 to 15% in the year after migration, but most of that lift is the merchandising rebuild, the upsell-stack install, and the bundle-page redesign you do as part of the migration project. If you ran the same redesign and merch work without changing platforms, you would capture most of the lift. We tell founders to budget the platform migration cost against the upside math, not against marketing's lift number.
why do figs and bark both run on shopify plus but have aovs 4x apart?
FIGS sells $50 scrub tops as part of $120 multi-item baskets to healthcare workers buying full kits. BARK sells $31 monthly subscription dog boxes, sold one box at a time. Same platform, identical underlying tech, completely different customer journeys and product economics. Platform is the third or fourth factor in AOV. Product price, basket-size mechanics, and customer mix are the first three.