
eCommerce
Average Australian ecommerce AOV by vertical 2026: A$96 sitewide, A$820 luxury, A$95 beauty
The average Australian ecommerce AOV is A$96 sitewide, according to Australia Post's 2026 Year in eCommerce report. However, average order values vary significantly by vertical, showing an 8x spread; luxury brands average A$820, while beauty products average A$95.
Key Takeaways
- The Australia Post 2025 sitewide online basket is A$96, down from A$98.10 in 2024 and roughly A$10 lower than five years ago. The number drops because cost-of-living pressure split a constant wallet into more, smaller orders, not because shoppers spent less in total.
- The sitewide A$96 hides an 8x spread across DTC verticals. Cettire (ASX:CTT) reported A$820 AOV in FY25, Adore Beauty (ASX:ABY) reported A$114.20 in FY24, and Temple & Webster (ASX:TPW) reported A$456 revenue per active customer in FY25. Pick your benchmark by vertical, not by the headline.
- Beauty and supplements sit at the bottom of the AOV table, not the top. Repeat-purchase categories run A$55-A$130 per order because the basket is refill-driven. The LTV story shows up in revenue per active customer, where Adore Beauty's A$235 is roughly 2x its A$114 AOV.
- Shopify Plus stores carry 5-7x higher AOV than the all-Shopify baseline. All-Shopify global AOV runs US$87-93 (around A$135-140), Shopify Plus runs US$210-214 (around A$320-330). For AU brands on Plus, expect to clear A$200 per order or check your pricing.
- Free-shipping threshold is the single biggest AOV lever in low-ticket verticals. Operators set the threshold at the median basket plus 30-40%: A$45 for refill subscriptions, A$60-A$100 for beauty and supplements, A$160 for some apparel brands. Move the threshold, move the average.
If you sell direct-to-consumer in Australia, the average order value (AOV) on your Shopify dashboard probably looks low next to the headlines. Australia Post's 2026 Year in eCommerce coverage puts the national online basket at A$96 for 2025 trade, down from A$98.10 in the 2024 Inside Australian Online Shopping report and roughly A$10 lower than five years ago. Founders read that number and assume their brand is underperforming. The sitewide average is the wrong benchmark.
Across the ASX-listed AU DTC pure-plays, the spread between verticals is closer to 8x: Cettire (ASX:CTT) disclosed A$820 AOV in FY25, Adore Beauty (ASX:ABY) reported A$114.20 in FY24, and Temple & Webster (ASX:TPW) reported A$456 revenue per active customer in FY25. Beauty and supplements sit at the bottom of the table, not the top. Luxury fashion and sleep sit at the top. Pick your AOV strategy from the vertical band, not from the national average.
A$96 is the wrong benchmark for any single DTC brand
The Australia Post number describes the entire online retail market. It blends supermarkets, electronics, fashion, household goods, and everything else into one figure. As a directional read, it tells you the AU online consumer is splitting a roughly constant wallet into more, smaller orders. As a target for your brand, it is useless.
The generational skew alone is wider than the sitewide number suggests. Australia Post's 2025 Year in eCommerce coverage put the average online basket at A$80 for Gen Z, A$95 for Gen Y, A$110 for Gen X, and A$109 for Baby Boomers. Boomers spend roughly 36% more per order than Gen Z. Important caveat: these are sitewide all-online figures, not DTC-vertical-specific. A young-skewed beauty brand should not pin its AOV target to Gen Z's A$80 sitewide basket because that A$80 is dominated by groceries and electronics, not beauty. Use the generational data to read directional skew on your customer base, not as a target.
The vertical skew is the bigger story. Australia Post's category-spend breakdown for 2025 (Food & Liquor A$16.0b, Fashion & Apparel A$11.6b, Health & Beauty A$3.8b) shows the relative scale of each category by total dollars flowing through online channels. It does not tell you the per-order AOV. For that you have to go to the ASX disclosures and the published vendor benchmarks vertical by vertical.
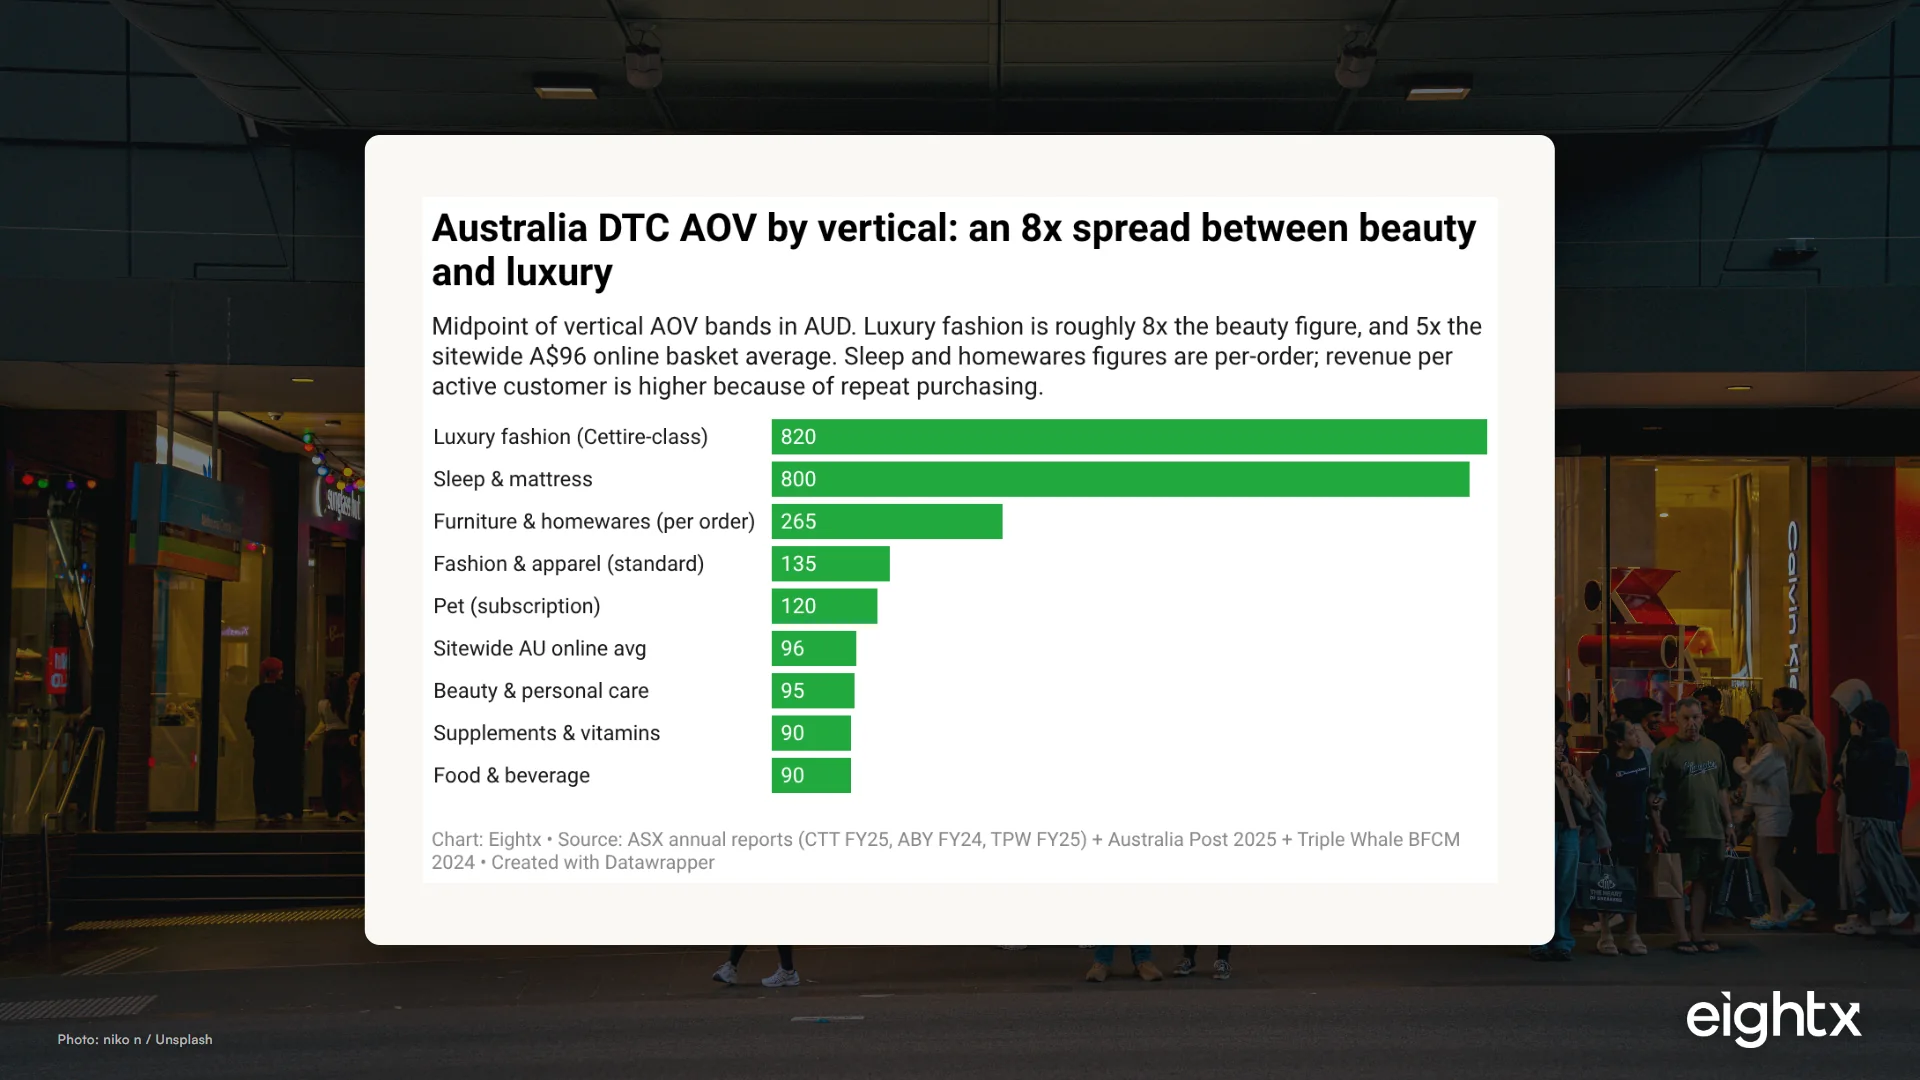
The chart above shows the midpoint of the band for each vertical. The table at the end of the next section shows the full floor-ceiling range and the primary lever to lift AOV in each category.
What the three ASX pure-plays disclose
The three AU DTC brands listed on the ASX are useful primary sources because they have to disclose their KPIs in annual reports. Each one represents a different vertical and a different AOV strategy.
Cettire (ASX:CTT), luxury fashion: A$820 AOV in FY25. Cettire's August 2025 results and trading update disclosed FY25 AOV of A$820, up 3% from A$798 in FY24. Sales revenue was A$420m on 656,569 active customers (down 5% from 692,287 active in FY24), implying revenue per active customer of A$640 (A$420m / 656,569). Repeat share of gross revenue climbed to 68% from 61% the prior year. The strategy: fewer, higher-value customers, with repeats carrying the year. Cettire's AOV is reported gross of returns, which matters when you compare to Adore Beauty (reported net).
Adore Beauty (ASX:ABY), beauty: A$114.20 AOV in FY24. Adore Beauty's FY24 annual report disclosed A$114.20 AOV on 814,000 active customers and A$235 revenue per active customer. That implies roughly 2.06 orders per active customer per year. Compared to FY21 (A$102.30 AOV, A$219 revenue per active), the four-year trajectory is +12% on basket and +7% on revenue per active. Beauty's AOV is half its revenue per active because the category wins on repeat purchasing, not basket build.
Temple & Webster (ASX:TPW), homewares: A$456 revenue per active customer in FY25. TPW reports revenue per active customer, not AOV per order, because furniture buying frequency is sub-2 per year and AOV varies hugely by category mix. FY25 active customers grew 16% to 1.3m (from roughly 1.12m in FY24), and FY25 revenue per active held effectively flat at A$456 versus A$461 in FY24. The operator story is "held basket while growing customers," not a shrinking business. The FY24 investor presentation flagged a roughly 3% decline in revenue per active driven by a roughly 5% AOV decrease as cost-of-living hit homewares baskets, but TPW has since absorbed that and grown the active base materially. Implied AOV per order sits at A$230-A$300 (A$456 revenue per active divided by an assumed 1.5-2 orders per year).
| Brand | Ticker | Vertical | Reporting period | AOV (A$) | Revenue per active customer (A$) | Orders/customer/year (implied) |
|---|---|---|---|---|---|---|
| Cettire | ASX:CTT | Luxury fashion | FY25 | 820 | 640 | 0.78 |
| Cettire | ASX:CTT | Luxury fashion | FY24 | 798 | n/d | n/d |
| Adore Beauty | ASX:ABY | Beauty | FY24 | 114.20 | 235 | 2.06 |
| Adore Beauty | ASX:ABY | Beauty | FY21 | 102.30 | 219 | 2.14 |
| Temple & Webster | ASX:TPW | Homewares | FY25 | ~265 (per-order, implied) | 456 | ~1.7 |
| Temple & Webster | ASX:TPW | Homewares | FY24 | ~270 (per-order, implied) | 461 | ~1.7 |
The chart above makes the point more directly than the table can. Cettire's AOV sits above its revenue per active because frequency is below one per year. Adore Beauty's AOV is half its revenue per active because the average buyer reorders about twice. That gap is the difference between a basket-build strategy and a repeat-purchase strategy, and it is the part of the AOV story that gets lost when operators benchmark against a single headline number.
Vertical-by-vertical AOV bands across nine categories
Across the nine AU DTC verticals where either an ASX disclosure or a defensible price-ladder inference is available, here is the 2026 band. Where the figure is inferred from public pricing rather than disclosed in an annual report, it is flagged as such in the notes.
| Vertical | AOV floor (A$) | AOV midpoint (A$) | AOV ceiling (A$) | Primary lever to lift AOV |
|---|---|---|---|---|
| Beauty & personal care | 70 | 95 | 114 | Sample/discovery sets + bundle of three |
| Fashion & apparel | 90 | 135 | 180 | Free-shipping threshold + try-before-you-buy |
| Supplements & vitamins | 55 | 90 | 130 | Bundle of 2-3 + subscription upgrade |
| Homewares (per order) | 230 | 265 | 300 | BNPL placement + room bundle |
| Sleep & mattress | 500 | 800 | 1500 | Sleep accessory bolt-on + installment financing |
| Pet (subscription) | 80 | 120 | 180 | Auto-delivery upsize + brand mix |
| Food & beverage | 60 | 90 | 120 | Minimum spend for free freight + variety pack |
| Luxury fashion | 650 | 820 | 900 | High-value SKU mix + concierge / VIP |
| Sitewide AU online | 90 | 96 | 110 | n/a (national average) |
A few notes on the bands. The beauty figure is anchored to Adore Beauty's disclosed A$114.20 plus the lower end of the Triple Whale BFCM 2024 set (A$65), giving a defensible floor-ceiling band of A$70-A$114. The apparel figure leans on the Triple Whale BFCM A$88 figure adjusted upward for standard-period (BFCM AOVs run 15-25% below standard) and on Polar Analytics' US$82.50 Shopify benchmark (A$125 at 1.52 FX). Sleep and mattress are inferred from public price points at Koala (A$650-A$2,400 mattress plus A$200-A$500 accessories), Ecosa (A$700-A$2,400), and Sleep Republic (A$899-A$2,899). The pet band is anchored to Pet Circle's revenue per customer (over A$300 per year on more than one million customers) and inferred order frequency.
Why AU AOV runs different from US AOV
Three structural differences shape the gap between AU and US AOV benchmarks, and they all run in the direction of "lower nominal AU AOV."
Currency. The AUD trades at roughly 1.52 per USD in early 2026. Polar Analytics' 2026 Shopify benchmark reports apparel and accessories at US$82.50, which translates to about A$125. Beauty and personal care reports US$66, which translates to about A$100. The Shopify Plus benchmark of US$210-214 translates to roughly A$320-A$330. Before you call your AOV low, FX-adjust the comparator.
Freight economics. Australian per-parcel freight costs are higher than US equivalents because of population density and the dominant rail-and-road mix. AU brands compensate with lower free-shipping thresholds (A$45-A$100 is typical, where US peers might sit at US$75-US$100). The lower threshold encourages smaller baskets in the standard order, which holds AU AOV down nominally even when contribution per order is similar.
Payment mix. BNPL penetration is materially higher in AU than the US, with Afterpay, Klarna, and Zip the dominant players. BNPL lifts effective basket on installment for the same nominal AOV (a customer splitting a A$200 order into four interest-free payments is more likely to add the marginal SKU). The effect on reported AOV is small because the metric is still nominal, but the effect on conversion and on willingness to clear a higher threshold is real. If you are on Plus and have not optimised your BNPL placement above the cart, operators commonly find AOV lift here on ticket-sensitive categories.
Five AOV levers that move the AU number
Across the AU portfolio brands we work with, five levers move AOV reliably. They are not all equally suited to every vertical.
Free-shipping threshold tuning. Set the threshold at your median basket plus 30-40%. If your median order is A$70, threshold at A$95-A$100. In low-ticket verticals (beauty, supplements, food), this is the single biggest lever and is the one operators tune most aggressively. A flash express-free-shipping promo run on a known-converting cohort spikes AOV by 15-25% on the day.
Bundle architecture. A bundle-of-three SKU at a 5-8% per-unit discount lifts standard AOV without breaking the per-SKU margin. It works best in supplements, beauty, and food. It does not work in fashion (where size and fit dominate the purchase decision) or in homewares (where customers are buying one big-ticket item).
Post-purchase upsell. Rebuy, AfterSell, and ReConvert apps add a one-click cross-sell at the order confirmation page. The accept rate is small (3-8%) but the order-economics are excellent (no incremental shipping cost, no marketing cost, no friction). Useful in beauty, supplements, and pet. Less useful in apparel where the post-purchase moment is a returns moment.
BNPL placement above the cart. Putting an Afterpay or Klarna logo with the four-payment breakdown above the add-to-cart button on the product page, not just at checkout, lifts willingness to add a higher-ticket SKU to the basket. Most impactful in homewares, apparel premium, and sleep where AOV is sensitive to ticket-size friction.
Sample or discovery sets for first-order AOV. Bundling a sample pack of complementary SKUs into the second order, not the first, lifts AOV2 without inflating CAC. Works well in beauty, supplements, and food. Skip it in apparel and homewares.
Australia Post's A$96 figure describes the entire online retail market, not your brand. Your real benchmark is the ASX disclosure for your closest pure-play comparable: A$820 if you are luxury fashion, A$265 per order if you are homewares, A$114 if you are beauty. Set your AOV target from the vertical band, then pick the one or two levers that fit your category.
Sources and methodology
The post draws on three layers of source data. The primary layer is ASX-listed corporate disclosures: Cettire's FY25 Results and Trading Update (ASX:CTT, 27 August 2025) for A$820 AOV and A$798 FY24, Adore Beauty's FY24 and FY21 Annual Reports (ASX:ABY) for A$114.20 and A$102.30 AOV plus active customer counts, and Temple & Webster's FY25 Annual Report and FY24 Investor Presentation (ASX:TPW) for revenue per active customer and the disclosed ~5% AOV decline.
The secondary layer is the Australia Post Inside Australian Online Shopping eCommerce Industry Report 2024 and the 2026 Year in eCommerce coverage for sitewide basket size (A$96 in 2025, A$98.10 in 2024) and the generational basket breakdown (Gen Z A$80, Gen Y A$95, Gen X A$110, Boomers A$109). The category-spend breakdown (Food & Liquor A$16.0b, Fashion & Apparel A$11.6b, Health & Beauty A$3.8b) is from the same report family.
The vendor-benchmark layer covers verticals where no ASX pure-play exists. Triple Whale's BFCM 2024 report (covered by retail-today.com) supplied apparel (A$88) and health and beauty (A$65) promo-period AOV. Polar Analytics' 2026 Shopify benchmarks (across 4,000+ brands globally) supplied the per-vertical USD figures used as the cross-reference for the AU bands. SQ Magazine and Technology Checker Shopify statistics for 2026 supplied the all-Shopify (US$87-93) and Shopify Plus (US$210-214) global AOV figures used as the platform-peer proxy.
The inferred-from-pricing layer covers mattress and sleep, supplements, pet, and Step One apparel. These verticals do not have an ASX-listed pure-play that discloses AOV, so the figures are triangulated from public price ladders at Koala, Ecosa, Sleep Republic, Vitable, Pet Circle, and Step One plus public revenue and customer-count disclosures where available. Each inferred figure is flagged in the body as inferred rather than disclosed.
The operator-voice signal is drawn from the Eightx founder-call library of 5,400+ recorded segments. Nine segments were retrieved on AU DTC AOV, free-shipping threshold, and basket-builder operator language. All client names were removed per the publishing checklist. The themes that surfaced (free-shipping threshold as the primary low-ticket lever, shipping income inclusion in dashboard AOV, single-SKU brands optimising CAC first then bundling later) shaped the body sections and the FAQ answers.
The limitations to flag. First, the Cettire AOV is reported gross of returns and the Adore Beauty AOV is reported net, so they are not strictly comparable. Second, no AU-specific Shopify AOV benchmark exists publicly (the Plus number is a global proxy). Third, no ASX-listed pure-play exists in supplements, pet, or sleep, so the bands for those verticals are inferred. Fourth, the Triple Whale figures are BFCM promo-period AOVs and run 15-25% below standard-period; we have adjusted upward in the band tables but the underlying source is a promo window. The Polar Analytics figures are global Shopify, not AU-specific. Fifth, Parallel.ai deep-research confirmed Adore Beauty FY24 A$114.20, the Australia Post 2024 A$98.10 vs 2025 A$96 split, and TPW's FY24 roughly 3% decline in revenue per active. It could not surface published AOV-by-vertical figures in NORA, Power Retail Switched On, Shopify Plus Future of Commerce ANZ, Klaviyo AU, or BigCommerce ANZ, which validates the "vertical AOV bands are inferred, not disclosed" framing rather than fills it in. None of these limitations changes the headline (the sitewide A$96 hides an 8x spread), but each one matters when you benchmark your own brand against a specific number.
For more on Australian ecommerce operating metrics, see our ASX DTC benchmark for FY25, the Australian online retail spend breakdown for 2026, and our virtual CFO services for Australian DTC brands. For the equivalent US data, our average AOV by ecommerce vertical post benchmarks the same categories on US Shopify and US DTC pure-plays.
Frequently asked questions
is the australia post a$96 sitewide basket figure inclusive of gst?
Yes. Australia Post's sitewide basket figure reflects the total amount paid online by Australian shoppers, which includes GST on GST-applicable goods. When you benchmark your own dashboard AOV against the A$96 number, decide whether your Shopify AOV is reported GST-inclusive (the default in most AU stores) or net of tax. A 10% gap between dashboards is enough to make your brand look 10% off the sitewide average when it is not. Confirm the tax basis before drawing conclusions.
what is a good aov for an australian beauty brand on shopify?
A$95-A$115 is the published pure-play band. Adore Beauty reported A$114.20 in FY24 on the ASX, up from A$102.30 in FY21. Triple Whale's BFCM 2024 data put beauty closer to A$65 at promo periods, which is typical (BFCM AOVs run 15-25% below standard). If you are above A$120 standard-period and your repeat rate is healthy, you are pricing or bundling well for the vertical.
why is my aov lower than the us benchmark even though i sell similar products?
Three reasons. The Australian dollar is weaker than the US dollar (about 1.52 AUD per USD as of 2026), so AU AOV in AUD reads lower in USD terms than a US peer. Freight is more expensive per parcel in AU, so brands set lower free-shipping thresholds and customers build smaller carts. And BNPL penetration (Afterpay, Klarna, Zip) is higher in AU, which lifts the share of small-basket installment orders. Adjust for FX first, then benchmark.
is a$96 a realistic aov target if i run a a$5m apparel brand in australia?
No. A$96 is the sitewide all-online average, which mixes groceries, electronics, beauty, and fashion together. The Triple Whale BFCM 2024 figure for apparel was A$88 in promo periods, and standard-period apparel AOV sits at A$90-A$180. Set your target at the midpoint of your vertical band and adjust for your price-point ladder, not the headline.
how do i lift aov on a beauty subscription without killing repeat purchase?
Three tactics that work without breaking the refill economics. First, sample or discovery sets bundled into the second order, not the first (protects acquisition CAC, lifts AOV2). Second, a bundle-of-three SKU at a small per-unit discount (lifts standard AOV, slows churn). Third, a free-shipping threshold set 30-40% above your median basket. Brands in our portfolio that run all three carry A$100-A$130 AOV without compressing the subscription frequency.
what aov should i set my free shipping threshold at for an australian shopify store?
Median basket plus 30-40% is the rule of thumb. If your median order sits at A$70, the threshold lands at A$95-A$100. Operators in the Eightx founder-call library run thresholds at A$45 (single-SKU subscriptions), A$60-A$100 (beauty and food), and A$160 (premium apparel). The threshold IS the AOV lever in low-ticket verticals.
how do cettire and adore beauty actually report their aov, is it gross or net of returns?
Cettire reports gross sales AOV (A$820 in FY25, before returns). Adore Beauty reports net (A$114.20 in FY24, after returns and adjustments). They are not directly comparable. When you benchmark your own AOV against either, confirm whether your number includes shipping revenue (the dashboard often excludes it, which understates true revenue per order by 5-8%) and whether it is reported gross or net of returns.
should i benchmark my aov against the all-shopify average or the shopify plus average?
Match the average to your stage. All-Shopify global AOV is around US$87-93 (about A$135-140) and represents the broad small-to-mid Shopify base. Shopify Plus AOV runs US$210-214 (about A$320-330) and represents brands at the enterprise tier. If you are on Plus, the Plus number is the relevant peer, and if you sit materially below A$200 standard-period you are likely under-pricing relative to your platform peer group.