
Insights
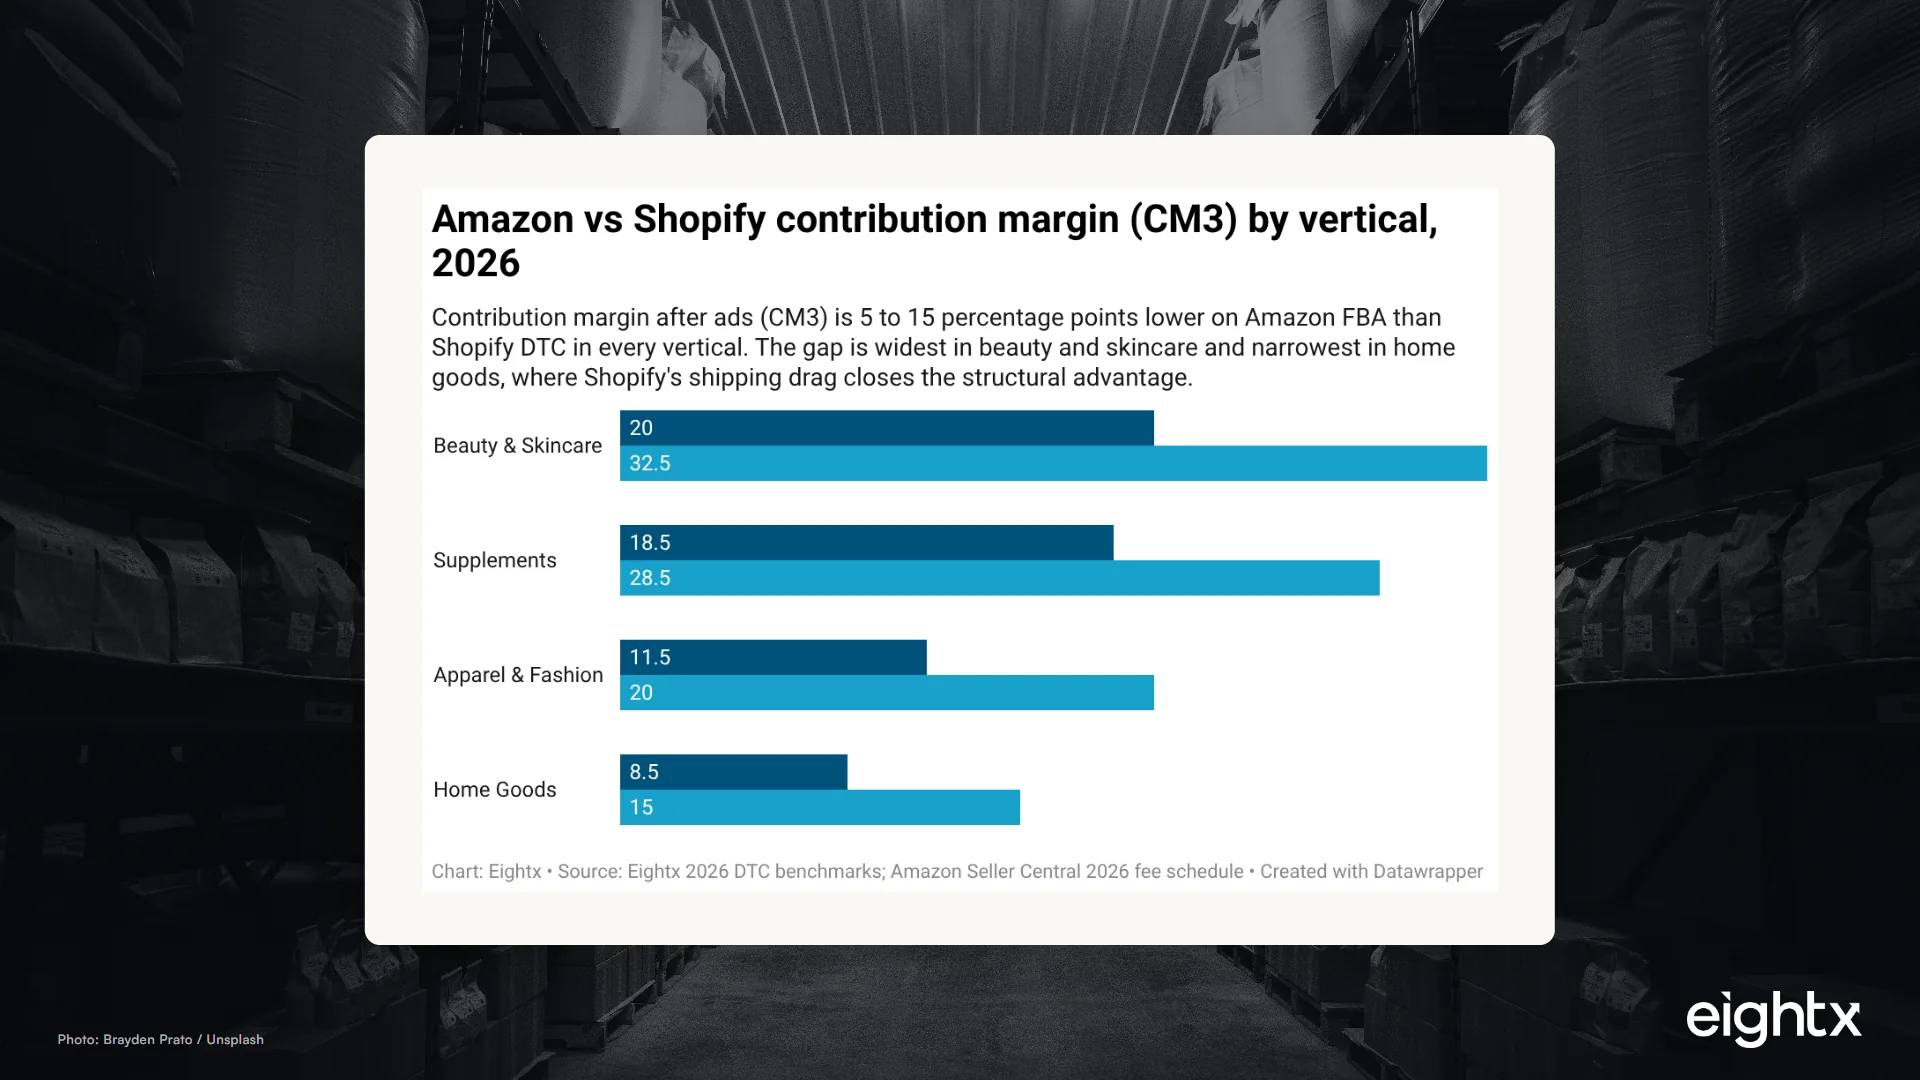
Average ecommerce contribution margin: Amazon vs Shopify by vertical, 2026
Amazon FBA contribution profit (CM3) averages 8 to 15 percentage points below Shopify DTC on the same SKU in 2026. Shopify consistently offers a higher cash retention per sale before fixed overhead, although the specific margin difference varies by product vertical.
Key Takeaways
- Amazon FBA contribution margin (CM3) runs 8 to 15 percentage points below Shopify DTC on the same SKU in 2026. Beauty and skincare 20% vs 32%, supplements 18% vs 28%, apparel 11% vs 20%, home goods 8% vs 15%. The gap narrows in shipping-heavy categories where Shopify's logistics drag closes the structural advantage.
- Amazon takes 30 to 45% of revenue in fees before PPC. Stack 15% referral, $3 to $6 per unit FBA fulfillment, and $0.78 to $2.40 per cubic foot storage. Add 8 to 15% TACoS and the effective channel cost lands at 38 to 60% of revenue.
- Shopify CAC offsets most of the savings. 2026 DTC ads run 15 to 25% of revenue at a 2.5 to 3% site conversion rate, while Amazon TACoS runs 8 to 15% on product pages that convert 3 to 5x higher. Acquisition cost per order ends up roughly comparable.
- Public DTC channel mix ranges from 15 to 49% Amazon share. YETI is 15% Amazon, FitLife is 49% Amazon, Solo Brands roughly 18%. There is no single right answer; the mix is a CM3 trade-off you make per category.
- Fix bookkeeping before channel strategy. Amazon referral, FBA, and storage belong below gross profit in variable selling costs, not in COGS. Until that is fixed, your channel P&L is lying to you about which SKU belongs where.
You ask a Shopify operator and an Amazon operator the same question (what is the contribution margin on this SKU?) and you get two different numbers. The Shopify operator says 22%. The Amazon operator says 18%. The interesting question is whether the same SKU sold on both channels actually leaves you with the same dollar of cash at the end. Mostly, no. Amazon contribution margin (CM3, the cash you keep after channel fees and ads, before fixed overhead) runs 8 to 15 percentage points below Shopify DTC on the same product in 2026. The gap is real, it varies by vertical, and the decision is rarely "leave Amazon." It is figuring out what each channel should carry on your P&L.
This post anchors the CM3 ranges by vertical, walks the 2026 Amazon fee math, and shows where the channels meet in a realistic operator scenario. The short version: Shopify wins on margin per order, Amazon wins on conversion. The channels do different jobs.
The contribution margin gap is real but smaller than most operators think
Contribution margin (CM3) by vertical in 2026 lands roughly here, on a midpoint basis from Eightx 2026 client P&L aggregates and cross-checked against published 2026 industry benchmarks.
Beauty and skincare has the widest gap (20% Amazon vs 32% Shopify) because beauty SKUs are light, high-margin, and Shopify subscribers carry repeat economics that Amazon never gives back to the seller. Supplements behaves similarly (18% vs 28%) for the same reasons. Apparel narrows (11% vs 20%) because Shopify DTC apparel carries 20 to 30% return rates and the reverse-logistics cost lives entirely on the brand. Home goods narrows further (8% vs 15%) because Shopify shipping on bulky items at $12 to $25 per order eats most of the structural advantage; Amazon's negotiated freight rates close the gap on weight-heavy SKUs.
| Vertical | Channel | CM1 (gross margin) | Channel fees as % rev | CM2 | Ad spend / TACoS | CM3 |
|---|---|---|---|---|---|---|
| Beauty & Skincare | Amazon FBA | 75% | 30 to 40% | 35 to 45% | 8 to 15% | 15 to 25% |
| Beauty & Skincare | Shopify DTC | 75% | 10 to 15% | 60 to 65% | 15 to 25% | 25 to 40% |
| Supplements | Amazon FBA | 70% | 30 to 40% | 30 to 40% | 10 to 15% | 15 to 22% |
| Supplements | Shopify DTC | 70% | 10 to 15% | 55 to 60% | 20 to 25% | 22 to 35% |
| Apparel & Fashion | Amazon FBA | 55% | 32 to 40% | 15 to 23% | 10 to 15% | 8 to 15% |
| Apparel & Fashion | Shopify DTC | 55% | 10 to 15% | 40 to 45% | 15 to 25% | 15 to 25% |
| Home Goods | Amazon FBA | 50% | 35 to 45% | 5 to 15% | 8 to 15% | 5 to 12% |
| Home Goods | Shopify DTC | 50% | 12 to 18% | 32 to 38% | 15 to 25% | 10 to 20% |
The Eightx aggregate is consistent with published 2026 benchmark work that back-solves from 10-K data and operator P&Ls and lands at a 10 to 15 margin-point gap in favor of DTC across most consumer categories. The benchmarks above stay within that band and explain the within-vertical spread (size tier, ASP, rate of returns) that produces it.
There is a real counter-case. One operator at a roughly $5M home and lifestyle brand told us their Amazon channel was more profitable than Shopify, because FBA outbound shipping was cheaper than their 3PL plus DHL or UPS rate card. In low-ASP, light-weight categories where Shopify shipping economics are punishing, the CM3 gap can flip. The headline ranges above assume mid-category logistics; your category-specific number sits inside the band based on weight, fulfillment cost, and CAC discipline.
Amazon or Shopify — which channel actually nets more?
Get our Contribution Margin calculator and compare your real per-order margin by channel.
Check your inbox — we'll send the Contribution Margin calculator shortly.
What you're actually paying Amazon in 2026
The fee stack on Amazon is four lines. None of them moves with your effort; they move with category, size tier, and price tier.
The compression of FBA fulfillment as a share of revenue is the lever most operators ignore. At a $15 ASP / 8 oz small standard, the per-unit FBA fee is roughly $3.43 (about 23% of revenue) and the total channel take before PPC is 41%. At a $75 ASP / 3 lb large standard, the per-unit fee is roughly $6.05 (8% of revenue), and the channel take drops to 25%. Your ASP, not your effort, is doing most of the work on Amazon CM3.
Referral fee. 15% baseline for most consumer goods. 8% for beauty and grocery under the $10 to $15 threshold (and 15% above). 8% for consumer electronics. 17% for apparel. 20% for jewelry. 45% for Amazon Device Accessories. Minimum $0.30 per item. Category placement can be worth more in margin than a year of PPC optimization.
FBA fulfillment fee. 2026 US non-peak rates by size tier are below. Standard size in 2026 saw a roughly $0.08 per unit average increase, with standard-size $50+ items up about $0.31 per unit.
| Size tier | Weight band | FBA fee per unit (USD) |
|---|---|---|
| Small Standard | 2 oz or less | $3.06 |
| Small Standard | 4 to 6 oz | $3.24 |
| Small Standard | 10 to 12 oz | $3.53 |
| Small Standard | 14 to 16 oz | $3.65 |
| Large Standard | 4 oz or less | $3.68 |
| Large Standard | 4 to 8 oz | $3.90 |
| Large Standard | 1 to 1.5 lb | $5.05 |
| Large Standard | 2 to 2.5 lb | $5.70 |
| Large Standard | 2.5 to 3 lb | $6.05 |
| Large Standard | over 3 lb | $6.05 + $0.32 per additional 0.5 lb |
| Large Bulky | any | $9.61 + $0.38/lb above 1 lb |
| Extra Large 0 to 50 lb | any | $26.33 + $0.38/lb above 1 lb |
Storage. $0.78 per cubic foot January through September on standard. $2.40 per cubic foot October through December. The 3x peak step is the reason inventory placement timing in August and September matters. Aged-inventory surcharge starts at 181 days and escalates to $6.90 per cubic foot or $0.15 per unit (whichever is greater) past 365 days. Slow movers in the wrong tier compound this fast.
Total Amazon fee load lands at 30 to 45% of revenue before PPC for a typical FBA seller. Layer 8 to 15% TACoS and the effective channel cost runs 38 to 60% of revenue. That is your starting point on CM3.
What you're actually paying to run Shopify DTC
The Shopify cost stack is structurally lighter at the order level. The drag sits in customer acquisition cost (CAC), not in platform fees.
Payment processing. Shopify Payments at 2.5 to 2.9% plus $0.30 per order on Plus and Advanced plans; closer to 3.5% on Basic and Shopify plan. Roughly 3% of revenue at most AOVs.
Shipping and fulfillment. 3PL pick-pack at $3 to $8 per order plus outbound shipping. For an average-weight SKU, the all-in shipping and fulfillment cost runs 8 to 12% of revenue. Bulky and oversized SKUs are higher (15 to 20% of revenue), which is why home goods Shopify CM3 narrows the gap with Amazon.
Platform and apps. $2,300 per month Plus plan plus an app stack (subscriptions, reviews, upsell, attribution, shipping protection) at 1 to 2% of revenue when amortized.
Customer acquisition cost. 2026 CAC ran $66 to $72 for fashion DTC, $61 to $68 for beauty DTC, and 15 to 25% of revenue across mature brands at a 2.5 to 3% site conversion rate. CAC is the variable that breaks parity with Amazon. Amazon TACoS at 8 to 15% is cheaper than DTC paid social and Google, but Amazon converts at 3 to 5x the rate of a DTC site. The two channels meet at roughly comparable acquisition cost per order even though their CAC numbers look very different.
The Shopify edge is below the CAC line, in repeat economics. Email, SMS, and subscription bring CAC on repeat orders to near zero, which is the structural source of the 8 to 15 point CM3 advantage over Amazon. Amazon does not give you the customer; you cannot rebuild that asset on the marketplace.
Public DTC channel mix: what 15 to 49% Amazon share looks like in the wild
US public brands don't generally disclose channel-level contribution margin (an SEC EDGAR full-text search for "contribution margin" AND "FBA" returns zero hits), but channel mix is reported in 10-K narratives. The spread is wide.
| Company | Ticker | FY | Amazon (% of net sales) | Own DTC ecommerce (% of net sales) | Wholesale + retail (% of net sales) | Filing |
|---|---|---|---|---|---|---|
| YETI Holdings | YETI | FY2024 | 15% | 44% | 41% | 10-K (acc# 0001670592-25-000008) |
| FitLife Brands | FTLF | FY2025 | 49% | 2% | 49% | 10-K (acc# 0001437749-26-010680) |
| Solo Brands | DTC | FY2024 | about 18% (estimated) | about 52% (estimated) | about 30% | 10-K (acc# 0001870600-25-000029) |
YETI runs at 15% Amazon share and keeps the rest of DTC on yeti.com plus wholesale. FitLife is the inverse: 49% of total sales through the Amazon US Marketplace, only 2% on its own ecommerce store, the balance through wholesale. Solo Brands sits in the middle. None of the three is wrong; each reflects a different bet on where the customer relationship lives.
The pattern in our client base, consistent with what Pinecone segments from the Eightx founder-call library show, is that brands under $5M lean Amazon-heavy because conversion plus low CAC carries early growth, and once they cross $10M the Shopify CM3 advantage starts paying for the higher CAC, and they migrate spend. Founders who shift Amazon-vs-Shopify mix quarter to quarter without a blended CM3 model often discover the shift hurts total margin even when the new channel grows faster. The mix decision is a CM3 trade-off, not a growth-rate trade-off.
Where each channel should win on your P&L
By vertical, the operator decision rule we use with clients looks like this.
Beauty and supplements. Shopify-led, with Amazon as a discovery tier for hero SKUs. The CM3 gap is 10 to 13 points, and beauty repeat-buyer economics make the Shopify advantage compound. Keep highest-margin SKUs (bundles, premium variants, subscription) Shopify-only; run a small Amazon catalog for first-touch discovery. Cap Amazon TACoS at 10% to defend channel CM3.
Apparel and fashion. Balanced, with returns discipline on both. Amazon CM3 at 11% is below the threshold where the channel earns its keep unless TACoS is exceptionally tight. Shopify CM3 at 20% pays the rent on returns processing. Run Amazon for evergreen basics where returns are low (5 to 10%) and Shopify for new collections where margin per kept-order has to absorb the 20 to 30% return rate.
Home goods. DTC-led for bulky, Amazon-led only for SIPP-eligible (Ships in Product Packaging) and Small Bulky tier SKUs. Standard Large Bulky pick-pack alone runs 25 to 30% of revenue on a $40 SKU, and once you layer the 15% referral, fulfillment plus referral lands at 40 to 45% of revenue before PPC. If your home goods SKU does not qualify for Small Bulky or SIPP, run it DTC. The Amazon channel cost stack is structurally too heavy.
Hard goods, electronics, accessories. Vary by ASP and category referral rate. Consumer electronics at 8% referral is far more Amazon-friendly than apparel at 17%. Run the ASP scenario from the fee chart above before you set the channel-mix target.
The CM3 gap between Amazon and Shopify is real, but it doesn't mean leave Amazon. It means know the per-channel CM3 you should be defending, then decide which SKUs each channel should carry. Beauty repeat economics belong on Shopify. Hero SKU discovery belongs on Amazon. Bulky home goods rarely belong on Amazon at all. The mix isn't a single right answer; it's a portfolio call you re-make each quarter.
What changed in 2026 (and what to do about it before Q4)
Three Amazon changes hit the operator math this year. The Shopify cost stack barely moved.
FBA fulfillment up $0.08 per unit on average; standard-size $50+ items up $0.31 per unit. Effective January 2026. At 200,000 annual units, that is $16,000 of margin gone on the base increase. On standard-size $50+ items at 100,000 units, it is $31,000.
New Small Bulky tier (down 21 to 23% for qualifying SKUs). This is the one positive lever. If you have an SKU that previously sat in Large Bulky and now qualifies for Small Bulky (dimensions under specific thresholds), the fulfillment rate drop is material. Audit your catalog for SKUs that may have been miscategorized.
Low Inventory Level fee tightened at the FNSKU level in 2026. If your inventory cover drops below 28 days at the FNSKU level, the fee triggers regardless of total brand cover. This rewards tighter forecasting and punishes lean operators who used to manage by brand-level inventory only.
What to do this week. First, audit your Amazon ASIN catalog for category-placement and size-tier opportunities; the referral rate and tier can move CM3 5 to 10 points on a single SKU. Second, run a 90-day channel P&L with channel fees out of COGS and below gross profit (the convention every public DTC reporter uses). You will see for the first time what each channel is actually contributing. Third, set CM3 targets per channel per vertical and let SKU allocation flow from there, not the other way around.
Sources and methodology
Amazon Seller Central 2026 US FBA fee schedule. Pick-pack-ship rates by size tier (Small Standard, Large Standard, Small Bulky [new 2026 tier], Large Bulky, Extra Large) pulled from the 2026 US FBA fulfillment fee changes help page. Referral fees by category pulled from the category referral fee schedule. Storage fees pulled from the FBA storage fees help page (Jan-Sep $0.78 standard / $0.56 oversize per cubic foot; Oct-Dec $2.40 / $1.40). Aged-inventory surcharge schedule sourced from Amazon's own announcements on the Selling Partners site.
SEC EDGAR 10-K filings. Channel-mix disclosures for YETI Holdings (CIK 0001670592, 10-K FY2024 filed 2025-02-24, accession 0001670592-25-000008), FitLife Brands (CIK 0001374328, 10-K FY2025 filed 2026-03-31, accession 0001437749-26-010680), and Solo Brands (CIK 0001870600, 10-K FY2024 filed 2025-03-12, accession 0001870600-25-000029). YETI explicitly discloses DTC at 59% of net sales and Amazon Marketplace at approximately 15%. FitLife discloses approximately 49% through Amazon US Marketplace. Solo Brands discloses 70.2% DTC with Amazon included but not separately quantified; the 18% Amazon estimate above is back-solved from category-mix disclosure and should be read as directional.
Eightx 2026 client P&L aggregate. The CM3 ranges by vertical (Amazon FBA 15 to 25% beauty, 15 to 22% supplements, 8 to 15% apparel, 5 to 12% home goods; Shopify DTC 25 to 40% beauty, 22 to 35% supplements, 15 to 25% apparel, 10 to 20% home goods) are derived from anonymized aggregate client P&Ls across 2026, with a 5+ brand minimum per stat band and a GMV scope of $5M to $150M. Client names are not disclosed. These ranges are cross-checked against published 2026 industry benchmark work and operator-aggregator analyses that arrive at a 10 to 15 margin-point CM3 gap in favor of DTC.
Pinecone (Eightx founder-call library). Operator-language patterns on the Amazon-vs-Shopify channel decision and the bookkeeping trap (booking marketplace fees in COGS vs below gross profit). 8 segments retrieved.
Limitations. SEC EDGAR full-text search for "contribution margin" AND "FBA" returns zero hits because US public brands don't disclose channel-level CM in 10-Ks; they disclose at the segment level (DTC vs Wholesale), not the marketplace-vs-website split. The Amazon-specific CM3 benchmarks here are synthesized from the Eightx aggregate, industry analyses, and operator P&Ls, not from SEC disclosure. CAC and TACoS bands assume mid-category brands at $5M to $150M GMV; smaller brands typically run higher TACoS for rank defense and higher CAC. The 30 to 45% Amazon fee load excludes returns processing, inbound placement, and the Low Inventory Level fee, which vary by category and SKU; including these can push the effective channel cost to 35 to 50% before PPC for return-heavy categories.
Update cadence. Refreshed quarterly when Amazon fee changes and public-company 10-K and quarterly filings land together. Next update target: August 2026, after the Q2 earnings cycle closes and Amazon Q3 fee-change announcements are typically published.
For deeper reading on the bookkeeping side, see our breakdown of how to calculate contribution margin in ecommerce, the companion analysis on gross margin Shopify vs Amazon, and the Amazon vs DTC margin gap across 10 public 10-Ks. For help untangling channel-level reporting on your own P&L, see our interim CFO services overview.
Frequently asked questions
is amazon actually less profitable than shopify for the same sku in 2026?
On contribution margin, yes, by 8 to 15 percentage points for most categories. Beauty runs Amazon 20% vs Shopify 32%, supplements 18% vs 28%, apparel 11% vs 20%, home goods 8% vs 15%. Gross margin (CM1) is roughly the same on both channels if you book fees consistently; the channel gap shows up below gross profit in CM3, after referral, FBA, storage, and PPC stack on the Amazon side.
how much of my amazon revenue actually goes to amazon in fees in 2026?
Roughly 30 to 45% of topline before PPC, and 38 to 60% after. The stack is 15% referral, $3 to $6 per unit FBA fulfillment, and $0.78 per cubic foot storage Jan to Sep ($2.40 peak Oct to Dec). Layer 8 to 15% TACoS on top and the effective channel cost lands close to half your revenue on most categories.
what's a healthy cm3 on amazon for a beauty or apparel brand right now?
Beauty and skincare lands in a 15 to 25% band on Amazon (target 20%+); apparel lands in an 8 to 15% band (target 12%+). On the Shopify DTC side, the equivalent bands are 25 to 40% (beauty) and 15 to 25% (apparel). Below the band, the leak is usually PPC too hot, the wrong size tier (sub-1 lb small standard is cheapest), or category placement carrying the 17% apparel referral instead of the 8% beauty rate (under the $10 threshold). On Shopify, the drag is usually CAC running over 25% of revenue or returns processing not reserved properly.
should i pull my best skus off amazon and run them dtc only?
Almost never. Amazon does the discovery work for you at a conversion rate Shopify cannot match. Pulling a discovery SKU off Amazon usually drops total brand revenue meaningfully without a corresponding lift in Shopify, because the Amazon traffic was incremental, not substitutable. The right move is portfolio: lead with a hero SKU on Amazon for awareness and repeat-buyer harvesting, keep your highest-margin SKUs and bundles Shopify-only, and run subscription on Shopify exclusively. Different channels do different jobs in the same brand.
why is my amazon profit margin so much worse than my dtc margin even with way lower cac?
Because TACoS is not your only acquisition cost on Amazon. The 8 to 15% TACoS sits on top of a 30 to 45% fee load that already happened before you bought a single click. Your Shopify cost stack is 3 to 7% of revenue plus 15 to 25% ad spend, total about 18 to 32% of revenue. Your Amazon cost stack is 30 to 45% fees plus 8 to 15% TACoS, total 38 to 60%. The Amazon side feels like better acquisition economics on the click but worse channel economics on the order.
is amazon worth it for home goods given the bulky fees?
Marginally, and only for SIPP-eligible (Ships in Product Packaging) or Small Bulky tier SKUs. Standard Large Bulky pick-pack is $9.61 + $0.38/lb above 1 lb, which on a $40 home good runs roughly 25 to 30% of revenue in fulfillment alone, and once you stack the 15% referral on top, fulfillment-plus-referral lands at 40 to 45% of revenue before PPC. Home goods CM3 on Amazon at 5 to 12% is in many cases below the threshold where the channel earns its keep. If your SKU does not qualify for Small Bulky or SIPP, run it DTC-led and use Amazon only for spillover demand.
how much does the 2026 fba fee increase cost the average seller?
About $0.08 per unit on average across standard sizes, with standard-size $50+ items up about $0.31 per unit. A brand shipping 200,000 units per year is paying roughly $16,000 more on the base increase, and a brand shipping 100,000 units of standard-size $50+ SKUs is paying about $31,000 more. Real money on volume, invisible per order, which is why it does not show up in your daily PPC dashboards but does show up at the CM2 line.
how do i calculate true amazon contribution margin when amazon doesn't break out my fees cleanly?
Pull the Date Range Reports from Seller Central monthly and reclassify in your accounting software. Revenue is product sales (gross). Subtract product COGS and inbound freight to FBA to get CM1. Subtract referral, FBA fulfillment, FBA storage, and returns processing to get CM2. Subtract sponsored ads (PPC) to get CM3. The clean way is a single ledger account per fee type, then a class or tracking tag for the Amazon channel so you can run a channel P&L every month.