
Insights
Average ecommerce gross margin: Shopify vs Amazon FBA, 2026 channel benchmark
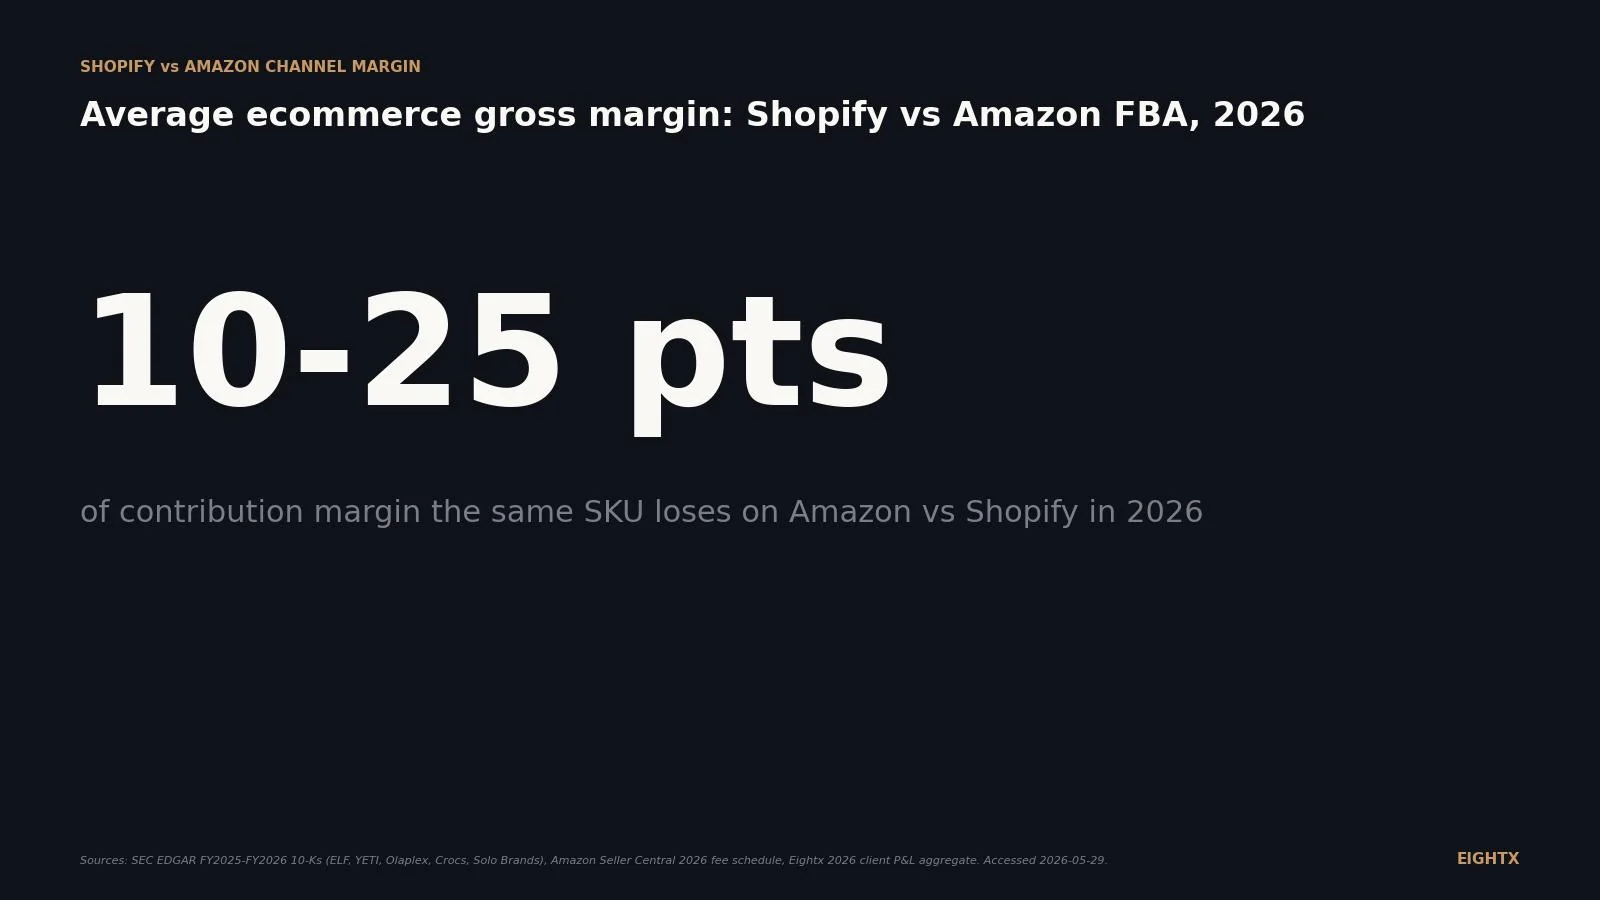
On the same SKU at the same price, gross margin is roughly equal across channels, but contribution margin runs 10 to 25 points lower on Amazon FBA than Shopify DTC. Amazon takes 30 to 50% of topline (referral, FBA, storage, PPC) versus 3 to 7% on Shopify. Healthy DTC gross margin is 60 to 75%; FBA net margin 15 to 20%.
Key Takeaways
- Same SKU, same selling price: gross profit margin (CM1) is roughly identical on Shopify and Amazon when you book channel fees consistently. The 10-25 point gap operators feel sits below gross profit, in unit contribution margin (CM3).
- Public DTC peer-set consolidated gross margins cluster at 55-73% in FY2025-FY2026: ELF 73.0%, Olaplex 69.4%, Solo Brands 60.6%, Crocs 58.1%, YETI 55.3%. Zero of 10 reviewed 10-Ks separately disclose Amazon channel gross margin.
- On a $100 order, Shopify retains about $63 after COGS, payments, and platform fees; Amazon retains about $44 after COGS, referral, FBA, and storage. That $19 gap is the channel-mix story, before either channel spends a dollar on ads.
- 2026 Amazon fee changes: FBA fulfillment up about $0.08 per unit on average, standard-size $50+ items up about $0.31 per unit, plus a 3.5% fuel and logistics surcharge applied to fulfillment fees from April 17, 2026. The Shopify cost stack barely moved.
- Fix the chart of accounts first. Move Amazon referral, FBA, and storage out of COGS and into a Variable Selling Costs section below gross profit. Until that is fixed, your channel P&L is lying to you.
You ask 10 operators which channel has better gross margin and you get 10 different answers. Half say Shopify by 20 points because "Amazon fees are crazy." The other half say "it depends how you book it." Both halves are right, which is why this question keeps coming up.
This post resolves the accounting question first, then anchors the numbers in public-company filings, the 2026 Amazon fee schedule, and the cost stack on a $100 order. The short version: same SKU, same selling price, gross margin (CM1) is roughly identical between Shopify and Amazon if you book channel fees consistently. The real gap, 10-25 points, sits below gross profit in contribution margin. The interesting work is in fixing your chart of accounts so you can see it.
The two ways operators talk about Shopify vs Amazon margin
There are two conventions in the wild, and they answer the question differently.
The clean accounting view (CM1): revenue minus product COGS and inbound freight only. Amazon referral, FBA, storage, and PPC sit below gross profit as variable selling costs and marketing. This is the convention most public DTC reporters use, including YETI, Olaplex, and Crocs, which all classify Amazon Marketplace inside their DTC channel and absorb the related fees through SG&A rather than cost of sales. Under this view, the same SKU at the same price posts the same gross margin on Shopify and Amazon, because product cost is identical. The channels diverge below the line.
The operator economic view (effective channel margin): revenue minus product COGS, inbound freight, and channel-specific variable fees (referral, FBA, payment processing). Marketing sits below. This is how most Shopify-first operators run their P&L by habit, because it bundles "what the channel cost me to sell." Under this view, Amazon "gross margin" looks 15-25 points worse because the fees have already been taken out at the top.
Neither view is wrong. The problem is when one channel uses each convention. If your Shopify rows treat payment processing as below-the-line and your Amazon rows treat referral and FBA as COGS, you have stacked the deck against Amazon by 15-20 points before the comparison even starts.
The fix is consistency. Pick a convention, document it in your accounting policy memo, and apply it the same way to both channels. The clean accounting view is what we recommend, because it matches how the public DTC peer set reports and because it lets you spot the channel-margin leak in contribution margin without product COGS noise on top.
What public DTC brands actually disclose in their 10-Ks
We pulled FY2025 and FY2026 10-Ks for 10 public DTC and consumer brands (ELF, YETI, Olaplex, Crocs, FIGS, Revolve, Hims, Kenvue, Coty, Solo Brands). Zero of them break out Amazon channel gross margin separately. The structural disclosures (where Amazon shows up in the P&L) are useful, but the number every operator actually wants is not in any filing.
The peer set anchors gross margin between 55% and 73% across major categories. That is the clean accounting view, with Amazon-related fees sitting in SG&A. The spread is mostly category-driven (beauty at the top, hard goods and outdoor at the bottom) and not Amazon channel mix doing the work.
Company Ticker Reported gross margin Period Filing e.l.f. Beauty ELF 73.0% Fiscal 2026 (Apr 2025 to Mar 2026) 10-K filed 2026-05-21 Olaplex OLPX 69.4% FY2025 (CY2025) 10-K filed 2026-03-05 Solo Brands DTC 60.6% FY2025 Q4 Press release / 8-K Crocs CROX 58.1% TTM May 2026 10-K filed 2026-02-12 + Q1 2026 10-Q YETI YETI 55.3% TTM May 2026 Q1 2026 press release / 10-Q
Three of the five (Olaplex, Crocs, YETI) classify Amazon Marketplace inside their DTC channel and absorb referral and FBA fees through SG&A. ELF reports Amazon as a named wholesale customer at 11% of FY26 net sales, which means it takes a lower wholesale ASP into revenue and the fee drag hits cost of sales instead of SG&A. Solo Brands has a mixed DTC and wholesale model with Amazon embedded in the DTC line.
The story the 10-Ks tell is consistent: gross margin is mostly a category and brand-strength signal. The Amazon channel signal, when it exists, is buried in SG&A on the DTC reporters and in cost-of-sales on the wholesale reporter. Either way, you cannot back out an Amazon-channel-isolated gross margin from any 10-K in the comp set. The number every private operator wants for benchmarking does not exist as a public number.
For the deeper read on how each brand classifies Amazon and what that does to the P&L line by line, see our companion analysis on the Amazon vs DTC margin gap across 10 public 10-Ks.
Same SKU, two channels: where the gross margin actually goes
The interesting picture is the $100 order. Same SKU, same selling price, mid-category fees, no ads loaded. Below is the operator view (channel fees treated as variable COGS) so the dollar of cash you keep is visible at the bar.
Under this view, Shopify retains about $63 of the $100 order at the gross margin line. Amazon retains about $44. The $19 gap is the channel-mix story before either channel spends a dollar on advertising. Under the clean accounting view (channel fees in SG&A), both bars would post 68% gross margin and the $19 would resurface below the gross profit line. Same total cash kept, different label on the line.
Cost bucket Shopify DTC ($) Amazon FBA ($) Note Selling price 100.00 100.00 Same SKU, same price Product COGS 30.00 30.00 Identical product cost Inbound freight to channel 2.00 2.00 3PL receiving vs FBA inbound Payment processing 2.90 0.00 Shopify Payments 2.9% / Amazon collects payment Amazon referral fee 0.00 15.00 15% baseline category Amazon FBA fulfillment + storage 0.00 9.00 Mid standard-size 2026 fee + storage (see derivation below) Shopify platform + app stack 2.00 0.00 Plus plan + about 1% apps Gross margin retained (operator view) 63.10 44.00 Channel fees in COGS Gross margin retained (clean accounting view) 68.00 68.00 Channel fees in SG&A
A few things to read off this. Shopify's total platform burden runs about 3-7% of revenue once you sum payment processing, plan fee, and apps. Amazon's runs 30-50% of revenue once you stack referral, FBA, storage, and PPC. The dollar of cash you keep at the gross margin line on a baseline category SKU is the spread between those two cost stacks, which is exactly what the operator-view bar shows.
The other thing to read: ads are not in this picture. Add 12% PPC on the Amazon side and your contribution margin gap widens to closer to $30 on the same $100 order. Add 8% paid social on the Shopify side and the picture closes a bit, but only a bit, because the Shopify cost stack is still structurally lighter. That is the math behind the Eightx client band of 15-25% contribution margin on a well-run Amazon FBA SKU versus 20-40% on the same product on Shopify DTC.
What changed in 2026: Amazon fee schedule and the operator math
Amazon raised three things in 2026. The Shopify cost stack barely moved.
FBA fulfillment fees rose about $0.08 per unit on average across standard sizes effective January 2026. That is small at the unit level but compounds at scale: a brand shipping 200,000 units per year is paying about $16,000 more in FBA fulfillment in 2026 than in 2025 at unchanged volume.
Standard-size items priced $50 and above saw a larger increase of about $0.31 per unit. This hits mid-priced premium SKUs hardest. If your AOV is $75 and you ship 100,000 units, that is $31,000 of margin that vanished without you changing anything in your business.
A 3.5% fuel and logistics surcharge applies to all US FBA fulfillment fees from April 17, 2026. This stacks on top of the fulfillment fee, not on top of revenue, so the dollar impact depends on your average fulfillment fee per unit. For a brand averaging $4.50 fulfillment per unit, the surcharge is about $0.16 per unit on top.
Category referral rate is the single biggest gross margin lever on Amazon and the one most operators ignore. Most consumer goods sit at the 15% baseline. Beauty over $10 is 8%. Consumer electronics is 8%. Personal computers is 6%. Amazon Device Accessories (a small niche category) is 45%. If your product is borderline between two category placements, the referral fee delta can be worth more in margin than a year of PPC optimization.
Fee change Effective Magnitude Who feels it most FBA fulfillment fee (US average) Jan 2026 +$0.08 per unit All FBA sellers Standard-size $50+ FBA fulfillment Jan 2026 +$0.31 per unit Mid-priced standard items Fuel and logistics surcharge April 17, 2026 +3.5% of fulfillment fee All FBA sellers Inbound placement fee 2024 (still in effect) Varies by service Sellers using Amazon placement Returns processing fee 2024 (still in effect) $2.16 to $11.35 per returned unit High-return categories (apparel, jewelry, electronics) Low-inventory level fee 2024 (still in effect) Varies Sellers with sub-28-day cover
The compounding pattern is the story. Amazon held headline referral rates flat for two years. The margin compression in 2024, 2025, and 2026 has come from the surcharges and the returns and storage fees, not the headline referral. If your Amazon margin feels worse year over year and your COGS has not moved, this is where the leak is.
How to book Amazon fees so your gross margin actually means something
There are two acceptable conventions. Pick one, document it, apply it to both channels the same way, and stop debating it internally.
Convention A (recommended): channel fees below gross profit. Amazon referral, FBA fulfillment, FBA storage, and FBA inbound go in a Variable Selling Costs section that sits below Gross Profit and above operating SG&A. PPC stays in marketing. Shopify payment processing, plan fee, and Shop Pay installments also go in Variable Selling Costs. Product COGS and inbound freight are the only things in COGS. Your gross margin is now comparable across channels, your contribution margin reads true, and your accountant will be happy because it matches what the public DTC peer set reports under US GAAP.
Convention B: channel fees in COGS. Amazon referral, FBA, storage, and Shopify payment processing all sit in cost of sales. Your gross margin number is the effective channel margin, and the comparison is also clean. This is the operator economic view. The downside is your gross margin number is lower than the public peer set's, so peer benchmarking gets harder. The upside is you cannot accidentally forget about channel costs at the GP line.
Whichever you pick, the practical steps in your accounting platform look like this. In QuickBooks or Xero, create a class or tracking category for each channel (Amazon, Shopify, Wholesale, Retail) and code every revenue line and every variable expense line to a class. Pull marketplace fees out of COGS if you go with Convention A; reclassify them and restate the trailing 12 months so your year-over-year comparisons hold. Run channel P&Ls monthly. The first time you see Amazon and Shopify side by side with consistent accounting, the contribution-margin leak is obvious.
Gross margin is roughly the same on Shopify and Amazon for the same SKU. The 10-25 point gap operators feel sits below gross profit, in contribution margin, and it shows up in your books only if you stop hiding marketplace fees inside COGS. Fix the chart of accounts before you fix the channel strategy.
For the underlying contribution-margin discipline, see our breakdown of how to calculate contribution margin in ecommerce and our interim CFO services overview for help untangling channel-level reporting.
Sources and methodology
SEC EDGAR 10-K filings. Consolidated gross margin values pulled via the us-gaap GrossProfit and Revenues / RevenuesFromContractWithCustomerExcludingAssessedTax XBRL tags for each ticker. ELF (CIK 1600033, FY2026 10-K filed 2026-05-21), Olaplex (CIK 1868726, FY2025 10-K filed 2026-03-05), Crocs (CIK 1334036, FY2025 10-K filed 2026-02-12 plus Q1 2026 10-Q), YETI (CIK 1670592, FY2025 10-K filed 2026-02-27 plus Q1 2026 press release), Solo Brands (FY2025 Q4 8-K). Gross margin computed as GrossProfit divided by Net Sales using the values reported in each filing.
Amazon Seller Central fee data. 2026 FBA fulfillment fee changes pulled from the 2026 US FBA fulfillment fee changes help page (GABBX6GZPA8MSZGW). Referral fee schedule pulled from the category referral fee help page (G200336920). The 3.5% fuel and logistics surcharge effective April 17, 2026 is from Amazon's own announcement on the Selling Partners site. Fee figures represent Amazon's stated averages; individual SKUs vary by size tier, weight band, and category placement.
Shopify cost stack data. Shopify Payments rate (2.9%), Plus plan fee, and app-stack burden are sourced from Shopify Q1 2026 investor materials and Shopify's public pricing page. The 3-7% total burden range reflects Plus and Advanced plan customers with a typical app stack.
Eightx client P&L aggregate. The 15-25% contribution margin band on Amazon FBA and 20-40% on Shopify DTC are derived from anonymized aggregate client P&Ls across 2026, with a 5+ brand minimum per stat band. Client names are not disclosed.
Limitations. No public DTC company in the 10-comp set discloses Amazon channel gross margin as a separate line, so channel-level analysis relies on the operator math triangulated from the fee schedule and aggregate client data. Amazon 2026 FBA fulfillment fees vary by size tier (small standard, large standard, small bulky, large bulky) and weight band; the $0.08 per unit average and $0.31 per unit standard-size $50+ figures are Amazon-stated averages. The $9 FBA fulfillment + storage figure in the $100-order waterfall is a midpoint, not a tier-specific quote; it assumes a four-unit $100 basket at roughly $2.15 fulfillment per unit (mid 1-2 lb large-standard tier, post-April 2026 3.5% surcharge applied) plus about $0.10 monthly storage per unit at standard cube. A single-unit $100 small-standard SKU would book closer to $6.30 FBA + $0.30 storage, and a heavy-bulky $100 SKU would book substantially higher. The operator-view "gross margin" examples assume a 15% baseline referral fee; categories with 6-8% (electronics) or 45% (Amazon Device Accessories) will read very differently. The Shopify Payments 2.9% rate assumes the Shopify Plus or Advanced plan card-present standard; Shop Pay Installments and PayPal rails differ slightly. The "8-15% Amazon FBA net margin" figure that appears in some general industry benchmarks is excluded here in favor of the SellerApp 2026 anchor (15-20% typical, 20%+ excellent), which is the source the body and Dataset.variableMeasured field cite.
Update cadence. Refreshed quarterly as Amazon fee schedule updates and quarterly earnings land. Next update target: Q3 2026, after the Q2 earnings cycle closes in August.
Frequently asked questions
is the gross margin on shopify actually higher than amazon for the same product?
Not at the gross margin line, if you book consistently. The same SKU at the same selling price hits the same product COGS on both channels, so CM1 (revenue minus COGS) is roughly equal. The 10-25 point gap operators feel shows up in contribution margin (CM3), after Amazon referral, FBA, and PPC stack on top. If your gross margin looks 20 points lower on Amazon, your bookkeeper put marketplace fees inside COGS instead of below it.
should amazon referral and fba fees go in cogs or in sg&a on my p&l?
Below gross profit, in variable selling costs. That is the convention most public DTC reporters use, including YETI, Olaplex, and Crocs, which absorb marketplace fees through SG&A inside the DTC channel. US GAAP (ASC 606) technically allows either treatment depending on principal-vs-agent facts, but the below-GP convention is what lets you compare gross margin between Shopify and Amazon. Move referral, FBA fulfillment, and FBA storage out of COGS in your chart of accounts and put them in a Variable Selling Costs section that sits below Gross Profit and above operating SG&A.
what's a healthy gross margin for a dtc shopify brand in 2026?
60-75% on the clean accounting view for most consumer categories. Beauty and supplements typically run 65-75%, apparel 55-65%, hard goods 50-60%, and food and CPG 40-50%. The public peer set anchors the high end: ELF 73%, Olaplex 69%, Crocs 58%, YETI 55%. If you are below the bottom of your category range, look at landed COGS, inbound freight, and discount stacking before you touch channel mix.
what's a healthy net margin for an amazon fba seller in 2026?
15-20% net margin is normal for a well-run FBA SKU and 20%+ is excellent (SellerApp 2026 benchmark). Net margin sits well below the gross margin number because Amazon referral, FBA, storage, and PPC have already eaten 30-50% of revenue by the time you get to net. If your net is single digits, the leak is usually PPC ACOS or FBA storage from slow-moving SKUs.
what changed in amazon fba fees for 2026 and how much does it hit my margin?
Three things. FBA fulfillment fees rose roughly $0.08 per unit on average across standard sizes effective January 2026, standard-size $50+ items jumped about $0.31 per unit, and a 3.5% fuel and logistics surcharge applied to all US FBA fulfillment fees from April 17, 2026. For a brand averaging $1.50 fulfillment per unit, the surcharge alone is a 5 cent hit per order. Stack it across 100,000 units a year and it is real money.
why don't public brands like elf or yeti disclose their amazon channel margin separately?
Two reasons. US GAAP segment reporting requires breakouts by reportable segment, not by channel within a segment, so there is no rule forcing disclosure. And publishing the number would hand Amazon a negotiation weapon. If Olaplex published that its Amazon channel runs at 55% gross margin while its Olaplex.com channel runs at 75%, Amazon's vendor manager would open the next category review with that number on the table.
is my amazon margin worse because of fees or because of ppc and acos?
Usually PPC is the bigger leak. Referral is fixed at 8-17% for most categories, FBA fulfillment is fixed by size tier, and storage is small if you turn inventory fast. PPC is where operators bleed: defending rank in a competitive niche can push ACOS into the 30-40% range and crush contribution margin even when COGS and fulfillment look healthy. If your Amazon net is under 10%, audit PPC first, then storage, then referral category placement.
how much of my revenue does amazon actually take in 2026?
Roughly 30-50% of topline once you stack referral, FBA fulfillment, storage, and PPC. At a 15% referral, $1.50 per unit FBA on a $25 order (6%), 2% storage and surcharges, and 12% PPC, you are at 35% of revenue gone before COGS. Fee-heavy categories (apparel with returns, electronics with low ASP) can push past 50%. Shopify total burden runs 3-7% in comparison, mostly payment processing and apps.
if i sell on both channels should i price the same or markup amazon to cover fees?
Match price on the listing, then bridge with marketing math. Amazon's algorithm punishes price inconsistency with the Featured Offer (formerly Buy Box) and will demote your listing if your Shopify price is meaningfully lower. The right move is to keep parity on the SKU, accept that Amazon contribution margin will run 10-25 points below Shopify, and offset by driving repeat orders to your Shopify store with email and subscription. The channels do different jobs.