
Insights
Average ecommerce LTV by vertical, 2026: $135 to $310 on Shopify, $400-800 on subscription
Shopify LTV runs $135 to $310 across most verticals. Subscription models push that to $400 to $800. The gap is not magic, it is purchase frequency locked in by billing cadence rather than re-acquisition spend. If your LTV is at the low end of your vertical, the answer is rarely a loyalty program. It is usually repurchase timing, subscription optionality, or CAC that is too high relative to margin.
Key Takeaways
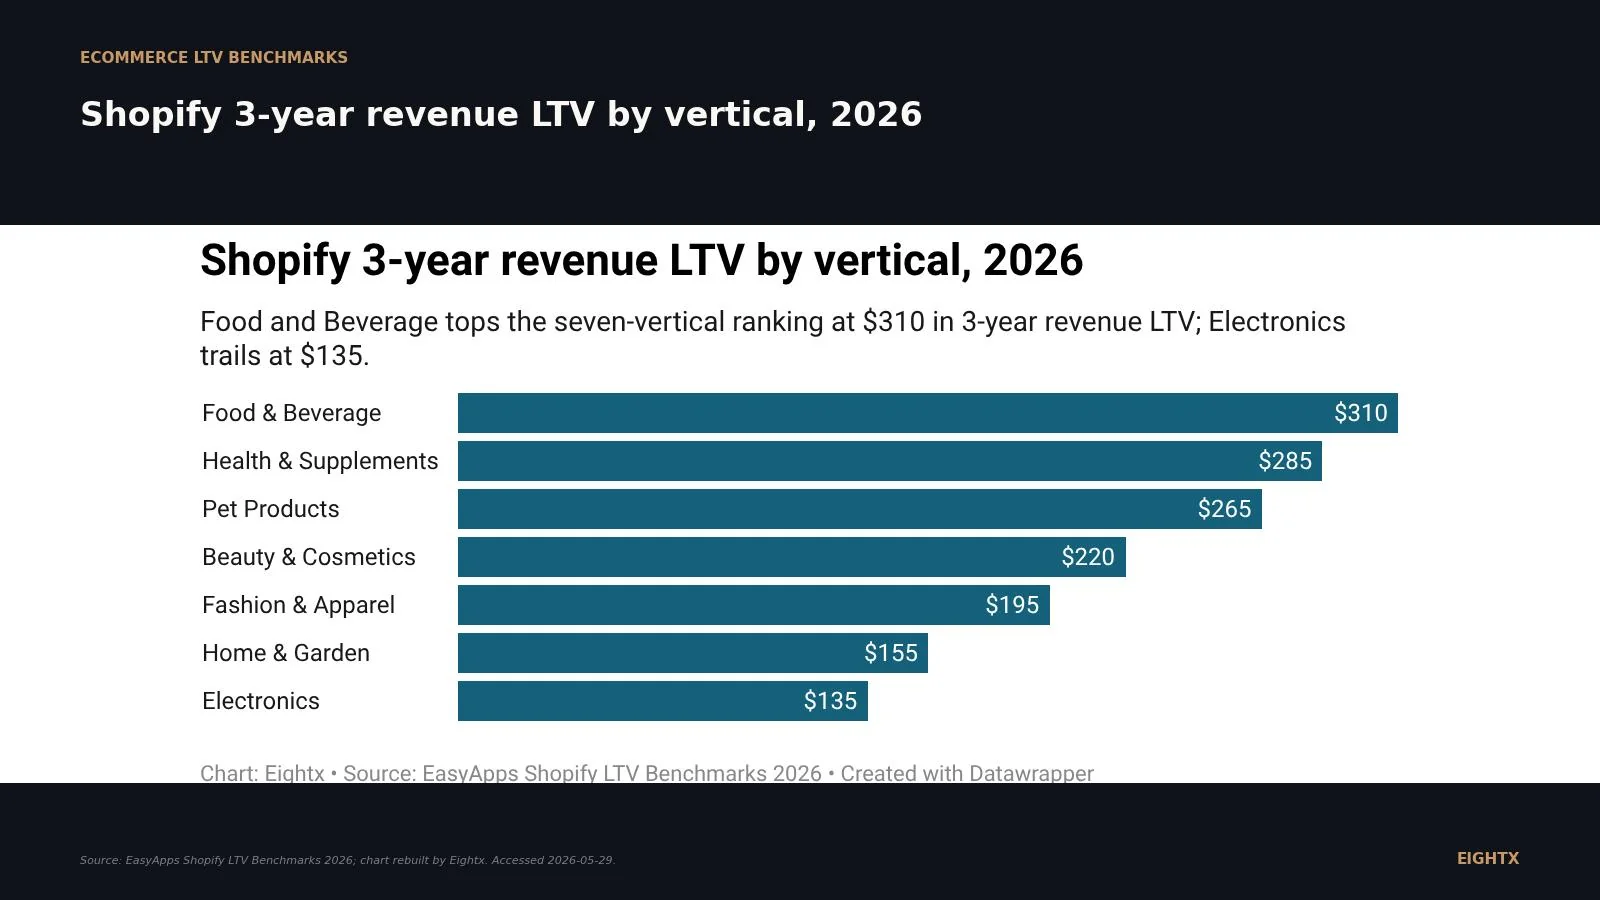
- Shopify's 3-year revenue LTV averages $168 across all verticals (EasyApps 2026 panel). Food & Beverage tops the seven-vertical ranking at $310; Electronics trails at $135.
- Revenue LTV is the published number. Contribution-margin LTV is the one you spend CAC against. Apply category-typical gross margins and Beauty ($154) jumps from middle of the pack to the top, while Pet ($80) drops from third to second-from-bottom.
- Public DTC anchors back the margin math. Chewy FY25 gross profit margin 29.8%; e.l.f. FY26 70.7%; Olaplex FY25 69.4%; Revolve FY25 53.5%; Lovesac FY26 56.4%. A Beauty brand keeps 2.4x more of every LTV dollar than a Pet brand at scale.
- Subscription is the LTV cheat code for consumables. Transactional F&B sits at $100-250 LTV; subscription F&B pushes $400-800 on 8-12 purchases per year (LTV.ai compilation, May 2026).
- Don't benchmark against the published table at face value. Sub-$1M brands typically index 30-50% below the Shopify panel; $30M+ brands typically index above. Mid-market and your own gross margin are the right anchors.
There is no single canonical 2026 LTV table from Shopify or Klaviyo, but the published vendor benchmarks cluster tightly enough that we can pin a 3-year revenue LTV range for each of the seven big ecommerce verticals: $135 for Electronics on the low end, $310 for Food and Beverage at the top, with subscription Food and Beverage blowing past $400 to $800. This post is the living index, refreshed quarterly, with the published number, the contribution-margin number that matters for unit economics, and the public-company gross-margin anchor for each vertical. Next update target: August 29, 2026, when the next Shopify benchmark refresh and the bulk of Q2 2026 public DTC 10-Qs land. Watch this page for the refresh.
What "LTV by vertical" actually measures in 2026
Three things you need to lock before you read any vertical LTV table.
First, every published vendor table reports revenue LTV unless it says otherwise. That is the gross dollars a customer spends with you over the window, before cost of goods, before payment processing, before any margin step. Contribution-margin LTV (revenue LTV multiplied by your gross margin) is what you actually have to spend against CAC, and it is rarely published because the vendor does not see your COGS. You have to do the multiplication yourself, which is the entire reason the next chart matters.
Second, the time window varies. The Shopify ecosystem panel (EasyApps 2026) reports 3-year revenue LTV. LTV.ai's vertical compilation reports a 12-month range. A 3-year window will print 1.5x to 2.5x the 12-month number for a healthy consumables brand, less for one-and-done categories. Mixing windows is the most common mistake we see operators make when they self-report a number that "looks low."
Third, the panel composition matters. Shopify and Shopify Plus stores skew mid-market, $1M to $50M GMV. Sub-$1M brands typically index 30-50% below; $30M+ brands typically index above. Subscription brands are usually reported separately because the math breaks the average.
With those caveats locked, here is the headline ranking from the 2026 Shopify panel.
The seven-vertical benchmark: $135 to $310 on Shopify, $400-800 on subscription
Each row in the table below is the median 3-year revenue LTV for that vertical on the Shopify and Shopify Plus panel, along with the two drivers that produce it: the share of customers who buy more than once (repeat rate) and the total number of orders an average customer places over three years.
Vertical 3-year revenue LTV (USD) Repeat purchase rate Orders per customer Food & Beverage $310 52% 4.2 Health & Supplements $285 45% 3.5 Pet Products $265 48% 3.8 Beauty & Cosmetics $220 38% 2.8 Fashion & Apparel $195 32% 2.1 Home & Garden $155 22% 1.5 Electronics $135 15% 1.3 All Shopify stores (panel avg.) $168 n/a n/a
A few operator reads on the table.
Food and Beverage at $310 is a consumables story, not a price story. The 52% repeat rate and 4.2 orders per customer over 3 years are the highest of any vertical. Subscription F&B brands push this much higher: LTV.ai's May 2026 compilation pegs subscription F&B at $400 to $800 LTV on 8 to 12 purchases per year. If you are running a transactional snack or beverage brand, you are likely closer to the $100 to $250 range LTV.ai reports for non-subscription F&B.
Supplements ($285) and Pet ($265) are the two verticals where subscription pulls hardest. Both have 45-48% repeat rates without subscription. Layer subscription on top and you get the LTV expansion that funds the venture-backed pet and supplements brands you see scaling on Meta. Recharge's 2026 retention commentary calls out 30-day repurchase rate as the leading indicator of 12-month LTV; consumables verticals benefit most because subscription onboarding compounds the early repeat.
Beauty at $220 looks like a middle-of-the-pack vertical until you do the margin math. Hold this number; the next section is where Beauty wins.
Apparel at $195 with 32% repeat is the trap. Operators see a high AOV (often $80 to $250) and assume LTV will follow. It does not, because purchase frequency over 3 years is only 2.1 orders. In our portfolio data, we typically see apparel customers grow from a month-0 baseline of $100 to roughly $108 by month 6, then $112 by month 12. That is a 12% lift over a year, not the doubling some published vendor data implies for top-quartile apparel. Treat any apparel LTV claim above $400 as a top-quartile or longer-window number, not a category median.
Home and Garden ($155) and Electronics ($135) are the same story. High AOV, low frequency, low repeat. Electronics is the structural worst case: 15% of customers buy a second time, and the average customer places 1.3 orders over 3 years. Your unit economics have to recover CAC in transaction one because there is rarely a transaction two.
The gross-margin flip: why Beauty out-earns Food and Beverage on every CAC dollar
This is the part the published tables miss. Revenue LTV is what a customer spends with you. Contribution-margin LTV is what you keep after cost of goods, and it is the number you actually spend CAC against.
Apply category-typical gross margins (Beauty 70%, Supplements 50%, F&B 40%, Apparel 55%, Pet 30%, Home 45%, Electronics 30%) to each vertical's revenue LTV and the ranking flips.
Vertical Revenue LTV Assumed category GM Contribution-margin LTV Public DTC GM anchor Beauty & Cosmetics $220 70% $154 e.l.f. FY26: 70.7%; Olaplex FY25: 69.4% Health & Supplements $285 50% $143 (no clean public DTC peer) Food & Beverage $310 40% $124 (no clean public DTC peer) Fashion & Apparel $195 55% $107 Revolve FY25: 53.5%; Lovesac FY26: 56.4% Pet Products $265 30% $80 Chewy FY25: 29.8% Home & Garden $155 45% $70 (no clean public DTC peer) Electronics $135 30% $41 (no clean public DTC peer)
Two flips matter.
Beauty moves from 4th on revenue LTV to 1st on contribution-margin LTV. A Beauty brand at $220 revenue LTV with a 70% gross margin keeps $154 to spend against CAC. e.l.f. Beauty's FY26 10-K (filed 2026-05-21) reports a 70.7% gross margin on $1.64B revenue, and Olaplex's FY25 10-K (filed 2026-03-05) reports 69.4% on $423M revenue. These are public-co category ceilings (they include wholesale channels, which carry higher margins than DTC) but they confirm Beauty is structurally the highest-margin consumables vertical.
Pet moves from 3rd on revenue LTV to 6th on contribution-margin LTV. A Pet brand at $265 revenue LTV with a 30% gross margin keeps $80. Chewy's FY25 10-K (filed 2026-03-25) reports 29.8% gross margin on $12.6B revenue, which validates the assumption. Pet food is a low-margin category at scale, which is why a high LTV does not translate to high contribution. Pet brands either grow into vertical integration (private-label manufacturing) or stay margin-constrained.
The implication: if you compete in Beauty, you can sustain a CAC closer to your full revenue LTV because you keep 70 cents of every LTV dollar. If you compete in Pet, your CAC ceiling is closer to 30% of revenue LTV. Two brands with identical revenue LTV operate completely different paid-media economics.
What drives the difference: repeat rate, AOV, frequency
LTV is mechanically the product of three numbers: average order value, purchase frequency over the window, and retention/repeat rate. The Shopify panel data lets you back out repeat rate and orders per customer for each vertical; AOV varies brand by brand and is not reported at the vertical median.
The chart sorts the seven verticals on a 2D plane. Verticals in the top-right (high repeat rate, high orders per customer) earn the highest revenue LTV. Verticals in the bottom-left earn the lowest.
Three patterns to notice.
Repeat rate and orders per customer track tightly. Food and Beverage, Supplements, and Pet cluster in the top-right with 45-52% repeat and 3.5 to 4.2 orders. Electronics and Home and Garden sit in the bottom-left with 15-22% repeat and 1.3 to 1.5 orders. There is no vertical with a 50%+ repeat rate but only 1.5 orders per customer, and there is no vertical with 4+ orders per customer but a 20% repeat rate. The two metrics are mechanically linked: high repeat means more orders per customer means higher LTV.
Beauty (38% repeat, 2.8 orders) sits in the middle on both axes but still earns $220 LTV. The reason it earns more than Apparel ($195 LTV with similar order metrics) is AOV. Beauty AOV typically runs $40 to $80 per order; Apparel AOV runs $70 to $250. Higher AOV in Apparel offsets slightly lower frequency, producing similar LTV. This is also why Apparel operators chase AOV with bundles and gifting drops: the order count is structurally capped.
Electronics is the structural outlier. Even with the highest AOV of any vertical (often $200+), the 1.3 orders per customer over 3 years produce only $135 LTV. There is no LTV story in Electronics that is not really a refurbished-or-accessory story.
When the published benchmark is useful and when it is misleading
Use the published Shopify panel benchmark for three things and three things only.
It is useful for a rough sense-check: if your 3-year revenue LTV is well below the vertical median, you have a retention problem (onboarding, email and SMS, subscription, assortment). If your 3-year revenue LTV is at or above the vertical median, you have headroom to spend more on CAC, assuming your contribution-margin LTV math holds.
It is useful for board reporting: "Our 3-year revenue LTV is $245 against a Shopify panel median of $220 for Beauty" is a defensible benchmark sentence because the methodology is public.
It is useful as a category-typical anchor when you are running scenario planning on a new vertical or category extension.
It is misleading for any specific operational decision. Three reasons.
The panel skews mid-market Shopify. Sub-$1M brands typically run 30-50% below the panel because they have not built the retention infrastructure (email and SMS, post-purchase product mix, subscription) that the median brand has. $30M+ brands typically run above the panel because they have. Self-reporting against the panel without adjusting for your revenue band gives you a false read on whether you are over- or under-performing.
It is revenue LTV, not contribution-margin LTV. If you are using it to decide on a CAC cap, you have to multiply by your gross margin first. Beauty at $220 revenue LTV is $154 contribution-margin LTV; if you set a CAC cap at $150 because the "LTV is $220," you are running an unprofitable business.
It does not split subscription. Subscription F&B brands are inside the $310 F&B median but they have a completely different LTV profile ($400 to $800, 8 to 12 orders per year per LTV.ai). If you are subscription-led, benchmark against the subscription cohort, not the category median.
Revenue LTV is the published number. Contribution-margin LTV is the one you spend CAC against. Vendor tables stop at revenue because they cannot see your gross margin. The whole CFO case for not benchmarking yourself against a published table at face value is hiding in that one missing multiplication step.
How to set your own LTV target
Three steps.
Step 1: compute your 12-month cohort revenue LTV. Pull the customers who made their first purchase exactly 12 months ago. Sum their total revenue over the 12 months since acquisition. Divide by the number of customers in the cohort. That is your 12-month revenue LTV. If you cannot easily pull this from Shopify, your retention dashboard (Lifetimely, Daasity, Triple Whale) will export it; if you are pulling it manually, use a 30-day acquisition window and the same 12-month forward look.
Step 2: multiply by your real gross margin. Take your actual blended gross margin from your last full quarter's P&L (revenue minus COGS, divided by revenue). Multiply your 12-month revenue LTV by that number. That is your 12-month contribution-margin LTV. This is the number you spend CAC against.
Step 3: compare to CAC. Divide your 12-month contribution-margin LTV by your blended CAC. If the ratio is above 3:1, your unit economics are healthy and you can scale spend. If the ratio is between 2:1 and 3:1, you are at break-even on cash and need to either lower CAC or extend the window. If the ratio is below 2:1, you are losing money on every acquisition unless you have a back-end (subscription, repeat) that lifts the 24-month or 36-month number above the 12-month.
For the full breakdown of the ratio and what to do at each band, see our LTV:CAC ratio guide and the vertical-by-vertical CAC benchmarks. For the subscription cut on LTV, see average LTV: subscription vs. one-time purchase. If you want help running this on your numbers, that is what our fractional CFO engagement is built to do.
Sources and methodology
EasyApps Shopify Customer Lifetime Value Benchmarks 2026. Panel benchmark of Shopify and Shopify Plus stores reporting 3-year revenue LTV, repeat purchase rate, and orders per customer across the seven verticals tracked in this post. EasyApps is the most-cited published vendor source for Shopify-ecosystem LTV in 2026 and the only source that publishes the three-metric triple (LTV plus repeat plus orders) at the vertical median.
LTV.ai Average Customer LTV Ecommerce Vertical Benchmarks (published May 27, 2026). Compilation that aggregates multiple vendor benchmark sources into vertical LTV ranges, with a subscription-versus-transactional split for Food and Beverage and a Luxury and Jewelry segment cited at $1,000 to $2,400 LTV. We use LTV.ai for the subscription split (Food and Beverage non-subscription $100 to $250; subscription $400 to $800) and as a secondary triangulation source for the seven primary verticals. We do not include Luxury and Jewelry in the headline chart because it is structurally different (lower frequency, gift-driven) and would distort the consumables ranking.
SEC EDGAR 10-K filings for public DTC gross margin anchors. We pulled the most recent annual filing for each public DTC company that operates in one of the seven verticals. Chewy (CHWY) FY25, filed 2026-03-25: revenue $12.60B, COGS $8.85B, gross profit $3.75B, gross margin 29.8%. e.l.f. Beauty (ELF) FY26, filed 2026-05-21: revenue $1.64B, COGS $479.1M, gross profit $1.16B, gross margin 70.7%. Olaplex (OLPX) FY25, filed 2026-03-05: revenue $423.0M, COGS $129.3M, gross profit $293.6M, gross margin 69.4%. Revolve Group (RVLV) FY25, filed 2026-02-25: revenue $1.23B, COGS $569.9M, gross profit $655.8M, gross margin 53.5%. Lovesac (LOVE) FY26, filed 2026-04-02: revenue $697.1M, COGS $303.9M, gross profit $393.2M, gross margin 56.4%. Public-co gross margins include wholesale and retail channel mix for several of these brands (e.l.f., Olaplex), which over-state pure-DTC gross margin. We treat the public-co figures as a category ceiling, not the pure-DTC median.
SEC EDGAR full-text search for cohort LTV disclosures. We ran an EDGAR full-text search for "customer lifetime value" or "cohort retention" or "repeat purchase rate" across 10-K filings dated 2025-01-01 to 2026-05-29. 126 results. Top relevant hits were Revolve, Rent the Runway, Lovesac, Digital Brands Group, 1-800-Flowers, and Klaviyo, but none of the filings published a cohort 12-month LTV table. Public DTC brands disclose revenue, gross margin, active customer counts, and narrative retention commentary; they do not disclose cohort LTV. This is why no public-company peer set replaces the Shopify panel for LTV benchmarking. We expect this to change as more DTC brands disclose KPIs under the SEC's investor-relations reporting modernization push, but it has not changed yet.
Limitations. EasyApps panel is mid-market Shopify and Shopify Plus; sub-$1M and $30M+ brands index outside the median. Margin assumptions in the contribution-margin LTV table are category-typical bands anchored to public-co GMs where available; they will under- or over-state for any specific brand. Public DTC gross margins include channels other than DTC (wholesale, retail) for several brands, which over-state pure-DTC margin. Subscription brands are folded into the vertical medians for the Shopify panel; the subscription split for Food and Beverage comes from LTV.ai's separate compilation. Refresh cadence is quarterly; next update target August 29, 2026.
Frequently asked questions
what is the average customer lifetime value for an ecommerce store in 2026?
$168 per customer on a 3-year revenue basis, across all verticals on the Shopify and Shopify Plus panel (EasyApps Shopify LTV Benchmarks 2026). Subscription brands and consumables verticals run well above; one-and-done categories like electronics run well below. This is a revenue number, not a contribution-margin number, so multiply it by your gross margin before comparing it to CAC.
how does ltv differ between beauty, apparel, supplements, food, and pet?
On the Shopify 3-year panel: Food & Beverage $310, Health & Supplements $285, Pet $265, Beauty $220, Apparel $195. But when you apply category-typical gross margins (Beauty 70%, Supplements 50%, Apparel 55%, F&B 40%, Pet 30%), the ranking flips. Beauty leads on contribution-margin LTV ($154), F&B drops to third ($124), Pet drops to second-from-bottom ($80). The vertical you compete in changes which lever (frequency or margin) drives the economics.
is my ltv low if my shopify dashboard says $150?
Depends on your vertical and revenue band. $150 is roughly the panel average for Electronics or Home & Garden but is well below the panel for Beauty, Supplements, Pet, or F&B. It is also a revenue number; if your gross margin is 65% you keep $97 of it; if 30% you keep $45. Compare your contribution-margin LTV to your CAC, not your revenue LTV.
should i use revenue ltv or contribution-margin ltv?
Contribution-margin LTV for any decision involving CAC, paid media spend, or unit economics. Revenue LTV is fine for benchmarking against published vendor tables (because that is what they report). The reason published tables stop at revenue is gross margins are not visible to the panel vendor, so they cannot publish a margin-adjusted version. You have to do the multiplication yourself.
what's a good repeat purchase rate for my vertical?
The 2026 Shopify panel medians are: F&B 52%, Pet 48%, Supplements 45%, Beauty 38%, Apparel 32%, Home 22%, Electronics 15%. If you are below median for your vertical, retention is the lever (email, SMS, subscription, post-purchase product mix). If you are above median, CAC is usually the lever (you have room to spend more on acquisition because the back-end pays you back).
why is electronics ltv so low even though aov is high?
Because LTV is AOV times purchase frequency times retention. Electronics has high AOV per transaction but only 15% repeat rate and 1.3 orders per customer over 3 years (Shopify panel). You make money on the first sale and rarely on the second, so AOV-led pricing has to recover CAC in one transaction. That is structurally a tougher unit economics game than consumables.
what time window should i use for ltv: 12 months, 3 years, lifetime?
Use both. 12-month LTV is the operational number for ad-spend decisions because that is roughly the CAC payback window for most brands. 3-year LTV is the strategic number for benchmarking and board reporting; it is also how the Shopify panel data is published. Mixing windows is the #1 way operators misread the table. If your dashboard says $150 LTV and the benchmark says $220, check whether you are comparing 12-month to 3-year before you panic.
how does my ltv compare to chewy or e.l.f. as a benchmark?
Public DTC LTV is not disclosed in 10-Ks (cohort LTV tables are rare). What you can get is the gross margin: Chewy 29.8% FY25, e.l.f. 70.7% FY26, Olaplex 69.4% FY25, Revolve 53.5% FY25, Lovesac 56.4% FY26. Use those as a category ceiling, not the pure-DTC number (e.l.f. and Olaplex include wholesale channels). A category-leading public-co GM tells you the realistic maximum you can target for your own contribution-margin LTV.