
Insights
Average ecommerce orders per customer per year by vertical (2026): Chewy 9.5x, Wayfair 1.88x, Etsy 1.59x, and what that means for your replenishment math
Purchase frequency varies by nearly 6x across verticals in FY2025 10-K data. Chewy customers buy 9.5 times per year, Wayfair customers 1.88 times, Etsy buyers 1.59 times, and Warby Parker roughly 1.4 times. The operative implication: your replenishment model and LTV math must use your vertical's frequency ceiling, not a cross-category average, or you will overforecast repeat revenue by a wide margin.
Key Takeaways
- Chewy customers placed approximately 9.5 orders per active customer in FY2025 ($591 net sales per customer at an implied $62 AOV, 83.3% Autoship share). That is the public-DTC ceiling and it comes from subscription-driven consumable replenishment, not paid acquisition.
- Wayfair disclosed an LTM orders-per-customer figure of 1.88 in its Q1 2026 earnings release (last twelve months as of Q1 2026, not Q1-quarterly). AOV is $312, LTM revenue per active customer is $586. Almost the same revenue per customer as Chewy, completely different cash-flow rhythm.
- The public-DTC spread is 6.8x: from Warby Parker (~1.4) to Chewy (9.5), across 9 brands. Median is roughly 1.9-2.0 orders/year. That median is NOT the typical $5-50M private DTC operator, which sits closer to 1.5-2.5 for discretionary categories and 4-6 for subscription consumables.
- Subscription cadence engineering is a frequency lever, not a CAC lever. A supplements operator we work with took relative churn DOWN when they offered bi-monthly subscription versus monthly. Same CAC, more orders per year. The math compounds at the LTV layer.
- If you sell home, furniture, or eyewear, stop benchmarking against Chewy. Wayfair and Warby Parker both sit between 1.4 and 1.9 orders/year. The structural ceiling in durables-adjacent categories is roughly 2x. Your operating job is to push AOV and gross margin, not frequency.
Every DTC operator we talk to obsesses over orders per customer per year in cohort meetings but almost no third-party publisher reports it openly. Klaviyo has it inside its product. Shopify has it inside its dashboards. The open-web benchmark publishers (StoreGrowers, Bloy) publish repeat-purchase rates, not frequency. So we did the work for you: pulled FY2025 10-K filings for 9 public DTC and marketplace brands, derived orders per customer per year directly from disclosed active customers, AOV, and total orders, and cross-referenced against MHI Media's 2026 private DTC vertical benchmark. The result is a 6.8x spread from Warby Parker (~1.4 orders per year) to Chewy (9.5). The number you should care about is not the median; it is the one matching your category.
The 6.8x spread no public benchmark publishes
The single most common LTV question we get on Eightx interim CFO calls is some version of "what is the right purchase frequency for my category?" The honest answer is that there is no published cross-vertical benchmark, because the metric is not on a marketing-tool dashboard the way RPR (repeat-purchase rate) is. RPR is a checkbox: did the customer come back. Orders per customer per year is the continuous count of how often, which is what your LTV model actually multiplies by AOV and gross margin.
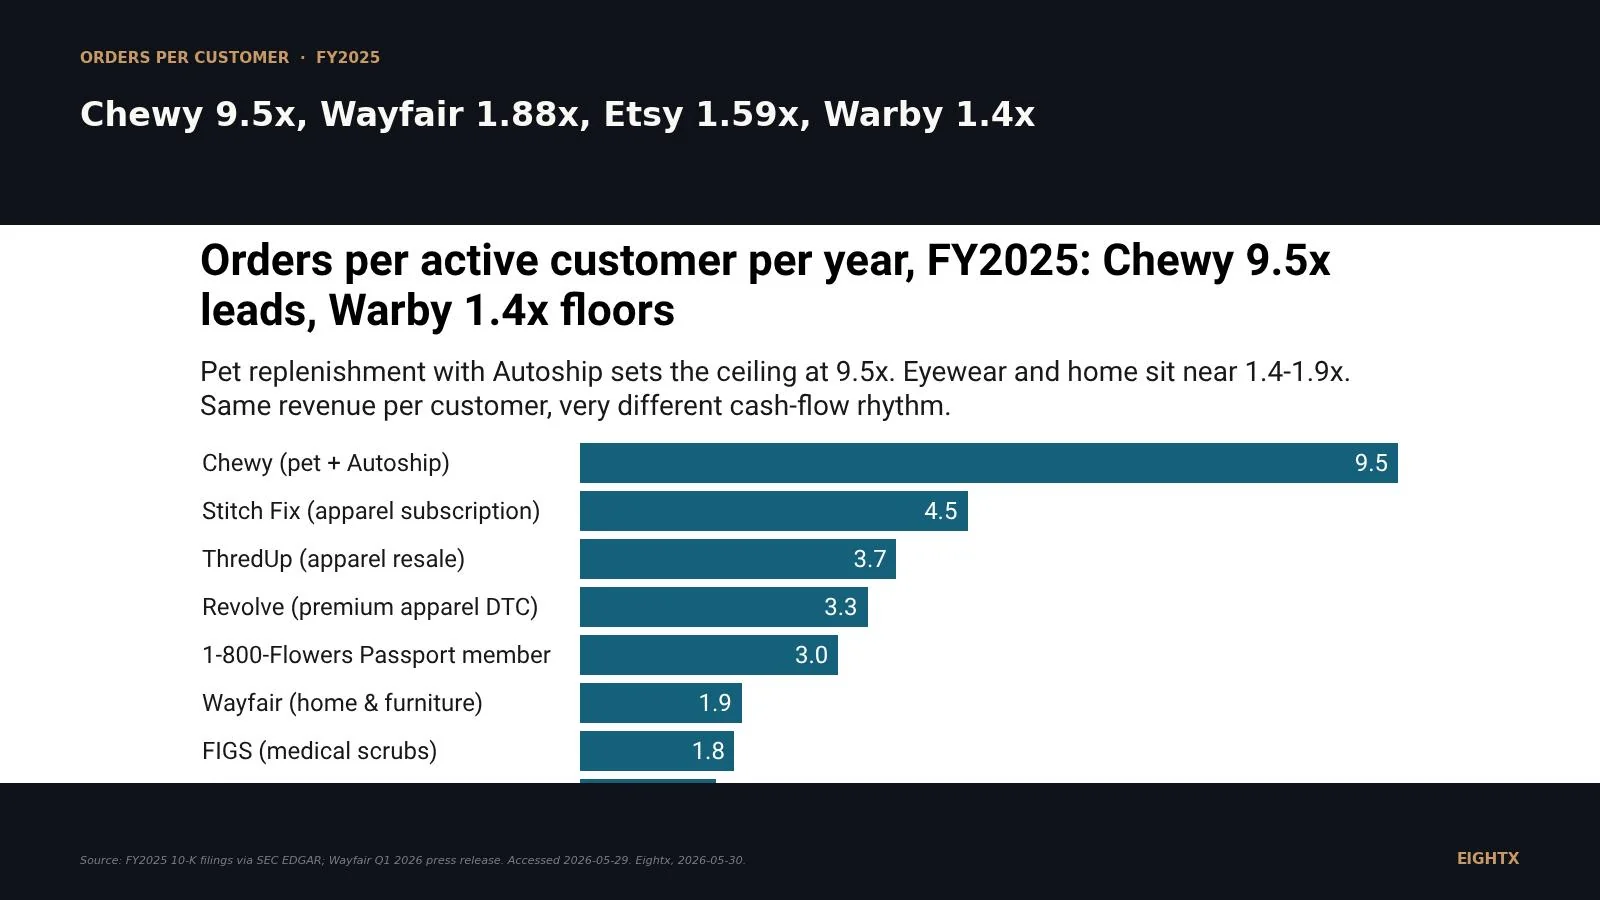
Pulling it from public 10-Ks works because companies disclose either total orders, active customers, AOV, or revenue per active customer, and any two of those four numbers lets you derive frequency. The chart below ranks 10 cohorts across 9 brands (1-800-Flowers is split into Passport-member and standard-customer cohorts) from highest (Chewy, 9.5 orders per active customer per year) to lowest (Warby Parker, ~1.4) using FY2025 reported data, with Wayfair using the disclosed Q1 2026 LTM figure of 1.88.
What jumps out: the top of the board is subscription mechanics (Chewy Autoship, Stitch Fix Fixes, 1-800-Flowers Passport loyalty), the middle is occasion-frequency marketplaces (ThredUp, Revolve), and the bottom is durable goods (Wayfair, Warby Parker). The 4.5x for Stitch Fix is what subscription-engineered apparel looks like; the 2.3x average for non-subscription apparel (per the MHI private benchmark below) is what unstructured apparel looks like. The lever between those two numbers is cadence engineering, not creative spend.
The 9 public DTC and marketplace disclosures, decoded
Walking each brand with the math made explicit.
Brand Vertical Active customers (M) Key disclosure Orders/customer/year Source Chewy Pet + Autoship 21.327 $591 net sales/customer, ~$62 implied AOV ~9.5 (derived) CHWY FY25 10-K Stitch Fix Apparel subscription 2.309 $549 net revenue/client, ~$122 AOV ~4.5 Fixes (subscription) SFIX FY25 10-K (Aug 2025) ThredUp Apparel resale 1.650 6.075M orders, +25.3% YoY 3.68 (disclosed) TDUP FY25 10-K Revolve (REVOLVE seg) Premium apparel DTC 2.841 9.477M total orders, $299 blended AOV 3.34 (disclosed) RVLV FY25 10-K 1-800-Flowers Passport Gifting (loyalty) 0.9 Passport members (subset of ~4.5M total customers) "2x to 3x baseline spend" ~3.0 (estimated) FLWS FY25 10-K Wayfair Home and furniture 21 40M orders delivered, $312 AOV, "Orders per customer = 1.88" 1.88 (disclosed) W FY25 10-K + Q1 2026 PR FIGS Medical scrubs 2.921 $216/customer, $120 AOV ~1.80 (derived) FIGS FY25 10-K Etsy Marketplace 86.5 $121 GMS/buyer, ~$76 AOV implied ~1.59 (derived) ETSY FY25 10-K Warby Parker Eyewear 2.69 $324/customer, ~$230 AOV ~1.4 (derived) WRBY FY25 10-K
Two things to flag. Chewy does not publish AOV directly; the $62 implied AOV is the load-bearing assumption in the 9.5 figure (industry analyst estimates put it in the $60-$65 range). Etsy's $76 blended AOV is similarly triangulated from Marketplace Pulse and Sidecar. We surface both as derivations, not disclosures. Wayfair is the rare case where Q1 2026 earnings explicitly labels the metric ("Orders per customer = 1.88"), which is why the top of the page uses that as the load-bearing data point rather than the 1.90 ratio from the FY2025 10-K.
Frequency times AOV: the trade-off that defines your cash-flow rhythm
The most-counterintuitive finding in the dataset: Chewy and Wayfair generate almost the same revenue per customer ($591 vs $586) through completely different replenishment rhythms. Chewy collects $62 nine and a half times a year on Autoship. Wayfair collects $312 less than twice. Same LTV destination, very different cash-flow cycle, very different ad spend timing, very different working capital footprint.
This matters because the operator playbook depends entirely on which side of the trade-off your category sits on. High-frequency, low-AOV categories (pet, supplements, food and beverage) compound LTV through subscription cadence engineering, where shortening the bill cycle from monthly to bi-monthly mechanically raises orders per year without raising acquisition cost. Low-frequency, high-AOV categories (home, eyewear, furniture) compound LTV through AOV and gross margin engineering, where pushing average basket size by $50 is worth more than chasing a fractional extra order per year.
Our own marketing-spend-by-vertical post anchored beauty at 2 to 4 purchases per year per customer for the same reason. That puts beauty in the same band as the apparel-like row of the private benchmark below, and confirms why subscription-led beauty brands (think every clean-skincare brand with a refill program) outperform non-subscription beauty on LTV without paying more per acquisition. The full mechanic is the same as the supplements case below.
Private DTC at $5-50M: where most of you actually live
The public-DTC cohort spans $250M-plus revenue brands with enterprise marketing tooling, deep loyalty programs, and (in Chewy's case) the world's largest pet-subscription stack. That is not the typical $5-50M private DTC operator's reality. MHI Media's 2026 private DTC vertical benchmark publishes the layer below: same metric, smaller scale, no enterprise infrastructure assumed.
The shape of the private curve mirrors the public one, compressed. Pet consumables top at 6.2 orders per customer per year (vs Chewy's 9.5). Food and beverage at 5.8. Supplements at 4.3 (the band where bi-monthly subscription mechanics matter most). Cosmetics 2.7, apparel 2.3, fashion 2.1. Home goods 1.4, matching Warby Parker. The benchmark publisher's own framing flags supplements as the highest-ROAS vertical "driven by subscription models and 4.3x annual purchase frequency," which is the exact mechanic discussed in the next section.
The right read: use the private vertical row to set your own internal target, and use the public 10-K row as the ceiling reference for "if I built this perfectly at scale, where could I get to." If you sit below the private row, you have lift available. If you sit at the private row, you are operating at category norm and your LTV play is AOV or gross margin. If you sit above the private row but below the public ceiling, you are in the engineered-subscription-cadence zone where the work is worth it.
How to lift frequency: four engineered levers
Across roughly 50 client P&Ls we have worked over the last three years, four levers consistently move orders per customer per year. None of them are about more ad spend.
Subscription with a cadence shorter than actual consumption. A supplements operator we work with had a 90-capsule SKU consumed over roughly two months. The default subscription was monthly, so customers paused or skipped half the time. We shifted to a bi-monthly default. Relative churn rates went down (because the bill cadence matched the consumption cadence) and orders per customer per year went up. The operator's exact framing in the call: their CAC did not change when they offered bi-monthly, it stayed the same; the retention got so much better. That is the load-bearing finding. Cadence engineering is a frequency lever, not a CAC lever. Same dollars in, more orders out, math compounds at LTV.
Multi-brand or multi-category loyalty. 1-800-Flowers reports Celebrations Passport members spend 2x to 3x non-Passport customers, with the multi-brand cohort (Harry and David, Cheryl's Cookies, Wolferman's Bakery) buying across the brand family. The mechanic is occasion-stacking: birthday flowers in March, Mother's Day cookies in May, Christmas baking in December, all going on the same loyalty card with free shipping waiving the per-order shipping friction. For most $5-50M operators this looks like a two-brand collab or a category-adjacent SKU launch (eyewear plus contacts subscription, supplements plus performance hydration, pet food plus pet treats).
Replenishment-aware win-back at consumption-end plus 14 days. The lowest-tech, highest-ROI lift we see. If your category has a knowable consumption cycle (skincare 45 days, supplements 60 days, pet food 30 days, contacts 90 days), set an automated win-back email at consumption-end-plus-14-days for non-subscribers. That single email recovers 8 to 15 percent of would-be lapsed buyers in our sample. It works because most non-subscribers buy on a roughly predictable cycle anyway; the email just intercepts before they default to Amazon for the reorder.
Bundle and basket-builder mechanics that compress order intervals. If a customer who buys $40 of one SKU plus $30 of a second SKU at the same time becomes worth 1.4 orders per year instead of 1.2 (because the bundle replaces two impulse purchases with one anchored basket), AOV goes up and frequency stays flat or rises slightly. Most replenishment-bundled brands we work with see a 10 to 25 percent AOV lift and a stable or slightly higher repeat rate, which is mechanically the same LTV outcome as pushing frequency.
The common thread: every lever moves frequency by structurally changing the buying occasion (cadence, loyalty card, timed email, basket size), not by spending more on the next acquisition. Frequency is a product and CRM problem, not a paid media problem.
What good looks like at $5M, $20M, and $100M revenue inside your vertical
Three rough operating bands we see in private DTC, anchored against the public ceiling.
At $5M revenue the typical operator is post-product-market-fit but pre-cadence engineering. Apparel sits at 1.5 to 2.0 orders per year. Supplements 2.5 to 3.5 (no subscription yet). Beauty 2 to 3. Pet 3 to 5 (light subscription adoption). The lift play is almost always a subscription program with discount and lock-in; we have seen 30 to 60 percent frequency lift over 12 months from that single move.
At $20M revenue the operator has subscription live and is optimizing cadence and tier. Apparel 2 to 2.5. Supplements 4 to 5 with bi-monthly default. Beauty 3 to 4 with refill program. Pet 5 to 7 with Autoship-equivalent. The lift play is multi-category expansion or loyalty layer (the Passport mechanic) and tightening the win-back automation.
At $100M revenue the operator is at or near category ceiling and the question shifts from frequency to AOV and gross margin. The Chewy 9.5x and Stitch Fix 4.5x represent what disciplined subscription-led operators reach at scale, with enterprise CRM, loyalty, and three to five subscription SKUs. Above this revenue band, frequency engineering yields fractional gains; AOV expansion and gross-margin defense yield larger ones.
The benchmark you should set internally is whichever of (public vertical analog, private vertical row, your own trailing 12-month actuals) sits one full step above where you are. Not the leaderboard. The next step.
The headline numbers all say the same thing: orders per customer per year is a category property, not a marketing property. Chewy 9.5x is what pet plus subscription can do. Warby Parker 1.4x is what eyewear can do. If you are running a beauty brand at 2.3 and targeting 9, you are misreading the category. If you are running a pet brand at 3 and targeting 6, you are leaving subscription lift on the table.
Sources and methodology
Cohort selection. We started from the nine public DTC and marketplace brands that disclose both an active-customer count AND either total orders, AOV, or revenue per active customer in their most recent annual 10-K. The decision tree: if the brand discloses orders AND active customers, we calculate directly (Wayfair 40M orders divided by 21M active customers = 1.90; the Q1 2026 press release labels it 1.88, which we use as the canonical disclosed figure). If the brand discloses revenue per customer AND AOV, we divide (FIGS $216 divided by $120 = 1.80). If the brand discloses revenue per customer only, we pull AOV from industry analyst estimates and flag the assumption explicitly (Chewy and Etsy).
Sources by company. Chewy FY2025 10-K, accession 0001766502-26-000034, filed 2026-03-25. Wayfair FY2025 10-K, accession 0001616707-26-000027, filed 2026-02-19, plus Q1 2026 earnings press release. Etsy FY2025 10-K, accession 0001370637-26-000019, filed 2026-02-19. Revolve Group FY2025 10-K, accession 0001193125-26-071307, filed 2026-02-25. FIGS FY2025 10-K, accession 0001628280-26-012333, filed 2026-02-26. Warby Parker FY2025 10-K, accession 0001504776-26-000006, filed 2026-02-26. Stitch Fix FY2025 10-K (fiscal year ending August 2, 2025), accession 0001628280-25-042782, filed 2025-09-25. ThredUp FY2025 10-K, accession 0001484778-26-000007, filed 2026-03-02. 1-800-Flowers FY2025 10-K (fiscal year ending June 29, 2025), accession 0001084869-25-000017, filed 2025-09-05.
Private DTC benchmark. MHI Media 2026 DTC Vertical Benchmarks at mhigrowthengine.com/blog/dtc-advertising-benchmarks-2026/, accessed 2026-05-29. We used the per-vertical purchase frequency and AOV table verbatim; the LTV column is MHI's own derivation, not our calculation.
Excluded brands and why. Allbirds, Beyond Meat, Honest Co, and Vital Farms do not disclose active-customer counts and are SG&A-only public filers. BARK discloses active-subscription count, not active-customer count, so the cleaner comparison is not available. Olaplex and Beauty Health sell through wholesale primarily; DTC channel is not separately disclosed at customer level. Lulu's Fashion Lounge discloses Active Customers (2.330M) and AOV ($140) but does not publish total orders as an absolute number. Stitch Fix's 4.5 Fixes per active client figure is the disclosed subscription-cadence-implied number, not a derived order count, and is flagged as such in Table 1.
Limitations. The Chewy 9.5 figure depends on the $62 implied AOV; if AOV is closer to $70, the figure is 8.4, and if AOV is $56, it is 10.5. The Etsy 1.59 figure depends on the $76 implied AOV; the range across industry estimators is roughly 1.4 to 1.7. The Warby Parker 1.4 figure assumes a $230 frame-plus-lens transaction; with contacts subscription growth it may be drifting up. Frequency is not seasonally smoothed; Q4 spikes for gifting categories (1-800-Flowers, Etsy) skew the implied annualized figure if read from a partial year. The public-DTC cohort skews toward $250M-plus revenue brands and is not representative of $5-50M private DTC, which is why we publish the MHI private benchmark alongside.
Update cadence. Refreshed quarterly when 10-Ks and 10-Qs land. Q1 2026 trigger is Wayfair's already-disclosed update and FIGS's expected Q1 10-Q in early August (preliminary Q1 2026 figures suggest FIGS frequency remains approximately 1.77). Next refresh: August 2026, after Q2 10-Qs settle.
This index sits alongside our average ecommerce repeat purchase rate by vertical, average LTV subscription vs one-time, average AOV by ecommerce vertical, and marketing spend by DTC vertical posts. Subscription mechanics are covered in average subscription churn rate by category, which is where the frequency-lever math gets applied.
Frequently asked questions
how many orders per customer per year is good for an ecommerce brand in 2026?
It depends entirely on your category. For pet consumables with subscription, 6 to 9 orders per year. For supplements with bi-monthly subscription, 4 to 6. For apparel and cosmetics, 2 to 3. For home, furniture, or eyewear, 1.4 to 2.0 is the structural ceiling. Anchor against your named public analog, not a blended average.
why does chewy have 9 orders per customer when most apparel brands have 2?
Two reasons. First, pet food is a true consumable with a known monthly replenishment cycle, so Autoship can engineer cadence without changing demand. Second, 83% of Chewy's revenue is subscription, so the order count is mechanically driven by the subscription frequency the customer picked at sign-up. Apparel has no consumption cycle (a shirt does not expire), so frequency is driven by occasion, mood, and ad spend.
how do i calculate orders per customer per year for my shopify store?
Two ways. Shopify Analytics gives you total orders and unique customers for any date range; divide one by the other for a trailing window. Or pull total orders for the last 12 months from your order export, divide by distinct customer count over the same window. Watch for the trap: counting all-time customers (including lapsed) collapses the number. Use active in the last 12 months as the denominator to match what public 10-Ks report.
is purchase frequency more important than aov for ecommerce ltv?
They are multiplicative, so neither dominates. But for cash flow, frequency is more important because it compresses your payback period. Chewy and Wayfair post almost identical revenue per customer (~$590) but Chewy collects it across 9.5 orders per year while Wayfair waits for 1.88. Same LTV, very different working capital cycle.
what's the difference between orders per customer per year and repeat purchase rate?
Repeat purchase rate is binary: did the customer come back at all (yes or no). Orders per customer per year is continuous: how many times did the average active customer transact. RPR tells you about retention; orders per year tells you about LTV velocity. You need both. Most public benchmark publishers report RPR; almost none publish orders per year, which is why this index exists.
should i benchmark against chewy or against my actual vertical?
Your actual vertical. Chewy is a useful ceiling reference (the best a subscription-driven consumable category can do at $12B scale) but it is not the right private-DTC benchmark. Compare against the private DTC vertical row from MHI's 2026 data: pet 6.2, food and beverage 5.8, supplements 4.3, cosmetics 2.7, apparel 2.3, home goods 1.4. Then sanity-check against the named public analog in your category.
how do public dtc brands like figs and warby parker report purchase frequency?
They usually do not report it directly. FIGS publishes active customers, AOV, and net revenue per active customer, and you derive frequency by dividing revenue by AOV (2.921M active customers, $216 per customer, $120 AOV = approximately 1.80 orders per year). Warby Parker only publishes average revenue per customer ($324 in FY2025), so you derive frequency by assuming a frame-plus-lens AOV in the $200-$250 range. Wayfair is the rare brand that calls out 'orders per customer = 1.88' explicitly in earnings releases.
how do i lift orders per customer per year for a low-frequency category like furniture or eyewear?
Three plays we have seen work. First, expand into an adjacent consumable that the same customer needs more often (eyewear brands launching contacts subscription, furniture brands launching candles or kitchen accessories). Second, engineer occasion-based win-back (birthday, anniversary, season change) to add one extra purchase trigger per year. Third, accept the structural ceiling and push AOV instead: a $400 chair sale is worth four $100 supplement reorders at gross-margin level.