
Insights
Average ecommerce G&A by revenue band 2026: 18% at $1M, 11% at $1B+, 25% in between
DTC G&A as a share of revenue is U-shaped, not linear. Sub-$10M private brands averaged 23% in FY2025 (A2X), the public-DTC cohort median sits at 13.3% (FY2025 10-Ks), and large-cap brands compress toward 11%. The worst band is $5M to $20M, where headcount grows faster than revenue and founders are still paying founder-rate wages for every admin function.
Key Takeaways
- The DTC G&A curve is U-shaped, not linear. G&A starts at 18% of revenue under $1M (fixed-overhead drag), falls to 10-12% across $5M to $50M, spikes back to 18% at the $150M to $500M public-DTC band, and only falls to 11% at $1B+ scale.
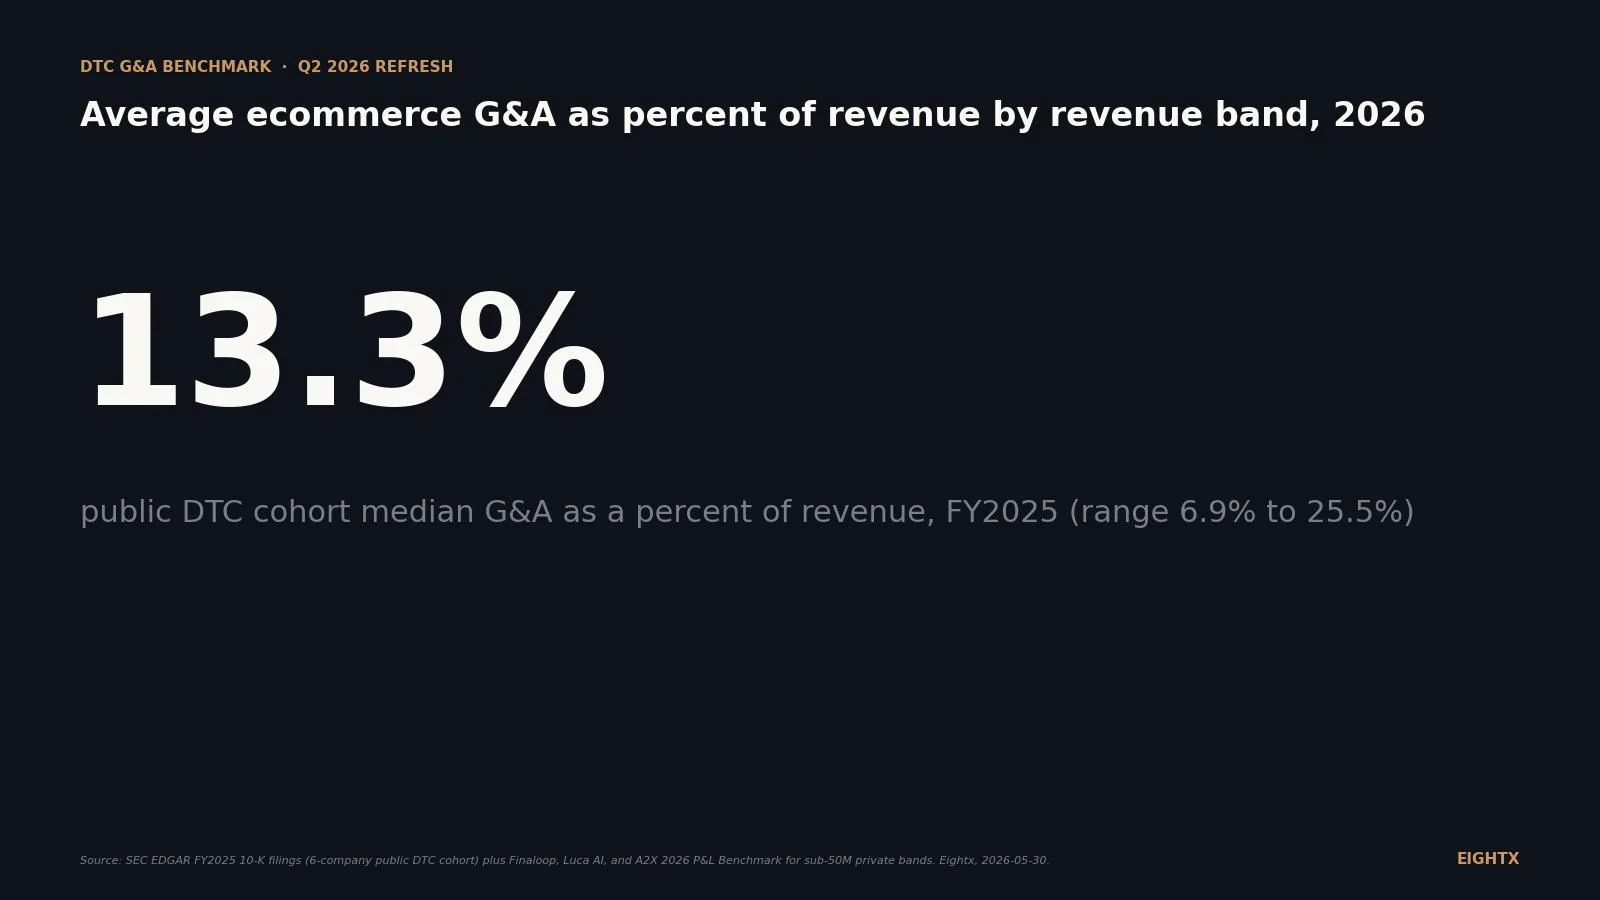
- The public DTC cohort median is 13.3% across six FY2025 10-Ks (1-800-Flowers, Etsy, Revolve, Purple, Lulu's, FIGS) that break G&A out separately from selling. Range: 6.92% (1-800-Flowers, $1.69B revenue) to 25.49% (FIGS, $560M revenue).
- Pure G&A is not the same metric as SG&A. Public brands that report combined SG&A (Warby Parker, YETI, Stitch Fix, Beyond Meat, Allbirds, Crocs, Vita Coco) sit at 25% to 67%. The two ratios measure different things. Benchmark against the cohort that matches your P&L disclosure shape.
- FIGS at 25.49% is the cohort outlier. $28M+ of equity-based comp and brand-marketing functions classified as G&A push the line. The lesson for private operators: how you classify costs matters as much as how you spend them.
- The hardest hidden tax is the public-company overhead floor. Audit, SOX, IR, board comp, and D&O insurance add roughly $2M to $4M per year that scales sub-linearly with revenue. That's why even Etsy at $2.81B revenue still runs 11.84% pure G&A.
Operators ask "is my G&A bloated" all the time. Almost every benchmark answer mixes G&A with sales and marketing (the combined SG&A lump) and obscures the actual answer. We pulled the pure G&A line (XBRL tag GeneralAndAdministrativeExpense) from FY2025 10-Ks for six public DTC brands that break G&A out separately from selling expense, and triangulated against Finaloop and the A2X 2026 P&L Benchmark for private brands under $50M. G&A (general and administrative expense) covers finance, HR, legal, executive comp, rent, software, professional services. The pattern is sharper than most operators expect: G&A scales backwards in percent terms between $5M and $150M, then rises again in the $150M-$500M public-DTC band before falling once more above $1B.
For deeper context on cost discipline at the public-cohort level, see the DTC ad-spend index and the companion R&D as a percent of revenue benchmark. This post sits alongside both as the operating-expense reads from FY2025 10-Ks. If you run a private DTC brand and want a CFO-level view of where your G&A line should sit at your stage, our interim CFO services page walks through how we benchmark client P&Ls against this dataset.
The DTC G&A curve: U-shaped, not linear
The single most useful chart in this post is the G&A curve by revenue band. Most operators expect G&A as a percent of revenue to fall monotonically as they scale. It does not. It falls, then spikes, then falls again.
Three forces shape the curve. At sub-$10M, fixed overhead (founder or CFO salary, $3-5K per month software stack, $2-4K per month in professional services, rent or coworking) is spread over a small revenue base. The percent looks high not because brands are inefficient but because the denominator is small. At $5M to $50M, scale economics kick in. Most G&A line items (audit fees, rent, leadership salaries) scale sub-linearly with revenue, so a brand that grows from $5M to $25M often grows G&A from 12% to 10%. Then between $150M and $500M, the percent rises again. Two reasons: the public-company overhead floor adds $2M to $4M per year (audit, SOX, IR, board comp, D&O insurance) and brands at this stage often classify part of brand marketing as G&A rather than selling. FIGS is the cleanest example: $560M revenue and 25.49% G&A, with $28M+ of that in equity-based comp and a meaningful brand-marketing classification effect. The percent only drops to the 7-12% floor above $1B revenue, where the public-company tax is amortized across enough revenue to feel small.
The practical read for operators: your G&A percent probably gets worse before it gets better. If you are at $25M and your G&A is 12%, do not assume it stays there as you grow to $100M. The headcount adds (controller, FP&A, HR, IT), the office moves, the professional services upgrades, and the audit-readiness work that crosses $50M all pull the line back up. Plan for it.
What pure G&A looks like at public DTC scale, brand by brand
Six public brands disclose G&A separately from selling expense in FY2025 10-Ks. Below is the cohort, sorted high to low.
The full detail behind the chart.
Brand Ticker FY2025 revenue ($M) FY2025 G&A ($M) G&A % of revenue FIGS FIGS 560 142.74 25.49% Lulu's Fashion Lounge LVLU 326 68.08 20.88% Purple Innovation PRPL 461 63.56 13.79% Revolve RVLV 1,226 156.99 12.80% Etsy ETSY 2,810 332.77 11.84% 1-800-Flowers FLWS 1,689 116.93 6.92% Cohort median n/a 893 129.84 13.30%
Three things to notice. First, the scale economics are real but not smooth. 1-800-Flowers at $1.69B runs 6.92% G&A; Etsy at $2.81B runs 11.84%. Etsy is bigger and runs G&A 70% higher in percent terms. The reason is mix: Etsy carries a large central tech team and merchandising organization that 1-800-Flowers does not. Scale gives you the option to run leaner; it does not guarantee you will.
Second, FIGS at 25.49% is the cohort outlier. Their G&A line includes $28M+ of equity-based compensation and a chunk of brand-marketing functions that other brands classify under selling expense. FIGS has been transparent about both: the company describes the high G&A as deliberate investment in equity comp and brand pull-through. The lesson for private operators is not "FIGS is wasteful." It is "how you classify costs matters as much as how you spend them." A private brand at $50M with $5M of founder-paid stock comp and $3M of brand creative classified as G&A will look bloated on paper even if it is well-run.
Third, Revolve at 12.80% is closer to the cohort median than to the $1B+ floor. Revolve runs two segments (REVOLVE apparel at $968M and FWRD luxury at $258M) consolidated at the corporate level. The 12.80% blended ratio reflects corporate-level G&A allocated across both segments; if you ran the math segment-by-segment it would skew differently.
Why SG&A benchmarks lie about G&A
The biggest measurement error in operator benchmarking is conflating G&A and SG&A. Seven public brands report combined SG&A instead of breaking G&A out. Here is what their numbers look like.
Brand Ticker FY2025 revenue ($M) FY2025 SG&A ($M) SG&A % of revenue Beyond Meat BYND 326 217.76 66.8% Warby Parker WRBY 872 475.92 54.6% Allbirds BIRD 194 92.49 47.7% YETI Holdings YETI 1,828 859.13 47.0% Stitch Fix SFIX 1,336 601.84 45.1% Crocs CROX 4,112 1,469.4 35.7% Vita Coco COCO 560 140.06 25.0% Honest Company HNST 378 79.51 21.0% Cohort median n/a 716 346.84 46.0%
The 35-55% SG&A band in this table is not directly comparable to the 7-25% pure-G&A band in the prior table. SG&A bundles paid marketing, retail-store payroll, sales-team comp, and customer service into the line. Warby Parker at 54.6% SG&A is not "five times as bloated" as Revolve at 12.8% G&A. Warby Parker operates 270+ retail optical shops; Revolve does not. Most of that 54.6% is selling expense, not overhead. If you operate a pure-DTC brand without retail stores and you benchmark against Warby Parker's SG&A line, you will dramatically over-estimate what is "normal."
The disclosure rule, the one that breaks most operator analyses: separate pure G&A from combined SG&A. If your P&L breaks G&A out, benchmark against the six-brand cohort (FIGS to 1-800-Flowers, 7-25%). If your P&L reports combined SG&A, benchmark against the seven-brand cohort (Vita Coco to Beyond Meat, 25-67%). The two ratios measure different things.
Beyond Meat is the cohort's cautionary tail. $326M revenue and $217.76M SG&A is roughly 67%, far above anything sustainable. The lesson is the one most founder calls in our Pinecone library land on: G&A does not shrink with revenue on its own. You have to actively cut it. Beyond Meat scaled headcount and overhead into a "we'll grow into this" narrative. Three years later the revenue did not show up and the overhead did not unwind on its own.
What G&A actually includes, and why your software-bloat problem is real
Pull a Finaloop or A2X breakdown apart and G&A typically captures eight buckets. Finance and accounting headcount (controller, bookkeeper, AP/AR clerk). HR and people ops (recruiter, HRIS, payroll). Legal and compliance (in-house counsel or outside firm retainer). Executive comp (CEO and founder draws at market rate, board comp). Professional services (audit, tax, outside counsel, consulting). Office rent and utilities. Software subscriptions outside COGS (Shopify Plus, ERP, finance tools, HRIS, communication stack). Insurance (D&O, general liability, cyber).
At sub-$10M revenue, software plus professional services plus founder labor typically cluster the line. Shopify Plus alone is $24K per year minimum. An ERP layer like Cin7 or Brightpearl adds $15-40K. A finance stack (NetSuite, A2X, Sage Intacct, or QuickBooks Online plus bolt-ons) runs $10-30K. An HRIS (Gusto, Rippling, or BambooHR) is $5-15K. Communication and productivity (Slack, Notion, Google Workspace) is another $5-15K. Add a fractional CFO at $5K per month, an outsourced bookkeeper at $3K per month, and basic legal retainer and you are at $250K to $400K of pure G&A on a $5M revenue base before you have paid yourself.
At $50M to $500M, headcount expansion drives the line. The first full-time controller is typically $150K to $200K loaded. First FP&A hire $130K-$180K. First in-house HR business partner $140K-$200K. First in-house legal counsel $200K-$300K. Audit fees jump from roughly $50K (private review) to $300K-$1.5M for a public-company-grade audit (industry-standard estimate from public-readiness consultancies). The build-out from $20M to $200M typically pushes G&A absolute dollars 8-10x even if the percent line stays flat.
At $1B-plus, the public-company tax becomes the floor. Etsy at $2.81B still runs 11.84% G&A. They are not bloated; they are paying the cost of being public. The $30M-$50M of audit, SOX, IR, board comp, and D&O insurance that scales sub-linearly with revenue is what keeps the floor above 7%.
When to add headcount: the $5M, $25M, and $100M decision points
The trigger for G&A hires is complexity, not revenue. Three thresholds matter most for $5M-$150M brands.
The first full-time controller. Typical trigger at $5M-$15M revenue. The signal is monthly close stops fitting in the founder's evenings, board or lender reporting needs a defensible process, and the bookkeeper cannot resolve the larger questions (inventory accruals, multi-channel revenue recognition, gift-card liability). A controller at $150K-$200K loaded is 1-2% of revenue at $10M-$20M. The cost of not having one shows up in a lender saying no, an audit going sideways, or a CFO walking into a hire at $300K to clean up two years of bad books.
The first FP&A hire. Typical trigger at $15M-$30M revenue, when the founder spends more than four days a month on forecasting. Board-grade 12-month rolling forecasts, cash-flow sensitivity analysis, and channel-level P&L attribution take 60-80 hours a month. A founder doing it inside their other job is a founder who is not selling. The hire is usually $130K-$180K, often someone who can scale into a director of finance role over 18 months.
The first in-house legal or corporate development hire. Typical trigger at $50M-plus, or at first material M&A or IP exposure (cross-border expansion, a patent dispute, a wholesale contract negotiation that touches multiple states). Before that, an outside firm retainer at $5-15K per month covers most needs. A founder pulled into legal review weekly is wasting the most expensive asset in the company.
These are the points where the G&A line moves up sharply in absolute dollars. The percent line typically flexes at the same time. A $20M brand stepping into a controller plus FP&A simultaneously can move from 10% G&A to 14% in one fiscal year. That is normal. The question to ask is whether the revenue trajectory absorbs the cost over the following 12 months.
Public DTC G&A as a percent of revenue ranges from 7% to 25% depending on scale. Private DTC ranges from 12% to 28%. The line is not flat across stages, and it is not monotonic. It is U-shaped. You can be doing everything right and still see your G&A percent rise between $150M and $500M because that is what the public-company overhead tax does to your P&L. The thing you actually steer with is dollar growth in G&A relative to dollar growth in revenue. If G&A dollars grow faster than revenue dollars for two-plus quarters, you are building to plan, not to actuals.
How operators should benchmark their own G&A line
Three steps for any DTC operator using this dataset.
Match disclosure shape first. Pull your own P&L. Does it break G&A out separately from selling? Benchmark against Table 1 (the six-brand pure-G&A cohort). Does it lump everything as SG&A? Benchmark against Table 2 (the seven-brand SG&A cohort). Mixing the two is the single most common error in operator analyses. Public-brand benchmarks vary by 5-7x depending on which side of the disclosure split you compare against.
Match revenue band, then adjust for stage. Use the U-curve in the line chart to set your expected range. Then adjust: if you are venture-backed and pulling founder salary at market, sit at the high end of your band. If you are bootstrapped and the founder is on partial draws, sit at the low end. PE-owned private DTC typically runs 50-150 basis points below comparable venture-backed peers because PE pushes hard cost discipline early.
Track dollar growth, not just percent. Percent is the year-end consequence. Dollar growth is the steering metric. Look at G&A dollars in Q1 versus the same quarter prior year. Compare that delta to the revenue delta for the same quarters. If G&A grew 18% and revenue grew 6%, your percent will rise this fiscal year regardless of what you do in Q4. That is a decision point in March, not a discovery in December.
For an operator-level view on how this line interacts with the rest of your unit economics, see our cash conversion cycle benchmark and the ad-spend percent of revenue index. G&A discipline only matters if the rest of your operating model is healthy. If gross margin is collapsing and contribution margin is below 20%, no amount of G&A trimming saves the model.
Sources and methodology
SEC EDGAR XBRL extraction. We queried the SEC's XBRL Company Facts API for the GeneralAndAdministrativeExpense tag for nine companies in our DTC cohort. Six brands disclose G&A separately: 1-800-Flowers (CIK 0001084869), Etsy (CIK 0001370637), Revolve (CIK 0001746618), Purple Innovation (CIK 0001643953), Lulu's Fashion Lounge (CIK 0001780201), and FIGS (CIK 0001846576). For seven brands that report combined SG&A only (Warby Parker CIK 0001504776, Allbirds CIK 0001653909, Honest Company CIK 0001530979, YETI CIK 0001670592, Crocs CIK 0001334036, Vita Coco CIK 0001482981, Stitch Fix CIK 0001576942, Beyond Meat CIK 0001655210) we used SellingGeneralAndAdministrativeExpense. Data extracted 2026-05-30.
Fiscal year alignment. Most companies report calendar FY ending December 31. Exceptions: 1-800-Flowers (FY2025 = July 2024 to June 2025), Stitch Fix (FY2025 = August 2024 to August 2025), YETI (FY2025 = December 2024 to January 2026, week-53 year). These are flagged inline in the data tables. Direct comparisons across fiscal-year ends should use TTM-aligned numbers where precision matters.
Revolve segment caveat. Revolve runs two segments (REVOLVE apparel core at $968M FY2025 and FWRD luxury at $258M). The $156.99M G&A is corporate-consolidated, not segment-allocated. The 12.80% blended ratio is the consolidated number.
Wayfair excluded from the G&A chart. Wayfair's 10-K classifies operations under Customer Service and Merchant Fees, Advertising, Selling Operations Technology General and Administrative, and other functional buckets. There is no clean G&A line. Their reported XBRL GeneralAndAdministrativeExpense history stops in 2014 because they shifted reporting structure. We could approximate by allocating a portion of the $3.75B operating expenses but explicitly do not because the allocation would be an estimate, not a disclosure.
Private DTC practitioner benchmarks. The 8-12% Series A and 12-22% bootstrapped ranges in the U-curve chart come from three sources triangulated. The A2X 2026 Ecommerce P&L Benchmark Report covers 18 private DTC brands from 7- to 9-figures in revenue and reports the under-$10M cohort at 23.00% G&A (down from 25.36% in FY2024). The Finaloop ecommerce accounting guide breaks G&A into bucket-level percent ranges for DTC and Shopify brands. Practitioner DTC margin benchmarks cross-check the contribution and EBITDA ranges that bound healthy G&A spend. None of these is a survey-grade primary dataset for private DTC; we treat them as the best available practitioner benchmarks in the absence of a Carta or NVCA published G&A-by-round dataset.
Reconciling the U-curve with A2X. A2X reports 23.00% G&A for the under-$10M cohort, which sits at the top of (or above) the U-curve's typical $1M-$5M and $5M-$15M bands shown in this post. Two reasons for the gap. First, A2X's 18-brand sample is heavily weighted to brands that book founder comp at market rate and run a fuller fractional finance, legal, and HR stack. The U-curve's typical bands strip out founder draws and capture brands running leaner outsourced setups. Second, A2X reports a single under-$10M average rather than a sub-band median, so brands at $1M-$3M (where fixed-overhead drag is sharpest) pull the average up. Operators benchmarking against this dataset should treat A2X's 23% as the top-of-range, founder-paid-at-market scenario and the U-curve's $5M-$15M typical 12% as the bottom-of-range, founder-on-partial-draws scenario. Your own G&A line will sit between the two depending on how you classify founder comp.
Limitations. The six-company pure-G&A cohort is small. Adding more public DTC brands would require manual extraction from MD&A sections (Honest reports it differently; LVMH and other luxury parents bundle differently). Equity-based compensation is a meaningful component of public DTC G&A (FIGS roughly $28M in 2025, Revolve $15M, Etsy $60M) and inflates the percent versus private peers who book stock-based comp differently. The percent figures we cite are GAAP, before backing out stock-based comp. Private and bootstrapped figures in the U-curve are practitioner inference, not measured cohort averages.
Update cadence. This is a Group A living index. We refresh quarterly when new 10-K filings land for the public cohort (February-March for calendar-year filers, September for FY-June filers like 1-800-Flowers, late September for FY-August filers like Stitch Fix), when Finaloop publishes updated practitioner benchmarks, or when a Carta or NVCA G&A-by-stage report drops. Next refresh target: August 2026 after the Q2 10-Q wave settles.
Frequently asked questions
what is a healthy g&a percent of revenue for a $10m dtc brand?
At $10M revenue, healthy G&A sits at 12-18% of revenue (roughly $1.2M to $1.8M absolute). High performers run 8-14%. Above 20% you are likely carrying fixed overhead (founder salary at market rate, premium software stack, professional services) that the revenue base does not yet support. Below 8% usually means you are under-investing in finance and ops infrastructure, which catches up around $15M.
whats the difference between g&a and sg&a on a dtc p&l?
G&A (general and administrative) is finance, HR, legal, executive comp, rent, software, professional services. SG&A bundles all of that with selling expense: paid marketing, retail-store payroll, sales commissions, fulfillment customer service. SG&A is always larger than pure G&A. Public DTC brands sit at 7-25% pure G&A or 25-67% combined SG&A. The two ratios are not interchangeable. Benchmark against the cohort whose disclosure shape matches yours.
is 15% g&a too high for my ecommerce brand?
Depends on revenue. At $1M-$5M, 15% is on the lean side (typical band 18-22%). At $10M-$30M, 15% is solid (typical 10-15%). At $100M+, 15% is on the heavy side (best operators sit at 9-12%). The question to ask: is the G&A line growing faster than revenue for two-plus quarters? If yes, you are building to plan, not actuals. Cut headcount or accelerate revenue.
how much should i be spending on accounting, legal, and software at $5m revenue?
At $5M revenue, plan for $250K to $400K combined: bookkeeping plus outsourced accounting at $40-80K, fractional CFO or controller at $50-150K, legal at $20-50K, and software stack (Shopify Plus, ERP, finance tools, HRIS) at $60-120K per year. That is 5-8% of revenue on the operational G&A spine, with founder salary plus rent plus the rest of G&A typically pushing total G&A to 15-22%.
what does g&a actually include for a dtc brand?
Eight buckets: finance and accounting headcount, HR and people ops, legal and compliance, executive comp (including the founder if drawn at market rate), professional services (audit, tax, outside counsel), office rent and utilities, software subscriptions outside COGS, and insurance. Some brands also classify part of brand marketing as G&A (FIGS is a notable example). It does not include paid acquisition, retail-store payroll, or fulfillment customer service: those are selling expense.
how does g&a scale as i grow from $1m to $10m to $50m?
G&A scales backwards in percent terms but forward in dollars. At $1M revenue, G&A is roughly $180K (18%); at $10M, $1.2M (12%); at $50M, $5M (10%). Dollars rise about 28x, percent falls by half. The scale advantage compounds because most G&A line items (rent, leadership salaries, audit fees) scale sub-linearly with revenue. The exception is the $150M to $500M zone, where the public-company overhead tax pushes the percent back up.
whats included in g&a for a public dtc brand vs a private one?
Same eight buckets, but public brands carry a structural overhead floor of roughly $2M to $4M per year that private brands do not. Industry-standard estimates from public-readiness consultancies put the sub-ranges at audit fees $800K-$1.5M for mid-cap, SOX compliance $500K-$1M, investor relations $300K-$600K, board comp $400K-$900K for outside directors, and additional D&O insurance $200K-$500K. Treat these as planning estimates, not measured averages. That is why public DTC at $200M revenue often runs G&A% higher than private DTC at $50M revenue, even though both are 'operationally efficient.'
when does it make sense to hire a full-time controller or cfo at my dtc brand?
First full-time controller at $5M to $15M revenue, when monthly close stops fitting in the founder's evenings. First fractional CFO at $3M to $8M, when you need a cash-flow forecast you can defend to a lender. First full-time CFO at $25M to $50M, when board reporting, debt covenants, and forecasting need dedicated ownership. First in-house legal at $50M-plus, or at first material M&A or IP exposure. The trigger is complexity, not revenue.
is my dtc brand bloated if my g&a is 20%+ of revenue?
At $1M-$10M revenue, 20% G&A is on the heavy side but not bloated; it usually signals founder salary at market rate, premium software, and outsourced services that have not yet scaled with revenue. At $20M to $100M, 20%+ is a flag: either revenue is contracting faster than overhead, or you have over-hired ahead of plan. Compare your G&A growth rate to revenue growth over the last four quarters. If G&A is growing faster, you are bloated.