
Financial Strategy
Bootstrapped vs VC-backed DTC gross margin in 2026: what 12 public 10-Ks actually show
Bootstrapped public DTC brands printed a 57.2 percent average gross profit margin in FY2025 versus 51.4 percent for VC-backed brands, a 5.8 point gap that tracks category mix, not capital structure. VC does not buy a better COGS structure. Warby Parker improved only 2 gross-margin points in four post-IPO years. The real divergence is cash: VC-backed brands burn operating cash subsidising SG&A that bootstrapped operators cannot afford.
Key Takeaways
- Bootstrapped public DTC brands average 57.2% gross margin in FY2025. VC-backed brands average 51.4% (excluding Rent the Runway). The 5.8 point gap sits inside category dispersion, not capital structure.
- The cash divergence is the actual story. Bootstrapped cohort generated roughly $2.83B of FY2025 operating cash flow against the VC-backed cohort's $478M. On a per-dollar-of-revenue basis that is 14.0% versus 8.8%, a 1.6x gap.
- VC dollars consistently fund SG&A, not COGS. Warby Parker's $476M SG&A in FY2025 is 1.4x FIGS's $349M spend despite Warby Parker operating at a smaller revenue scale than Lululemon. Five years of data show no structural gross-margin step-up post-IPO for any VC-backed brand in the dataset.
- The two highest gross margins in the dataset are both bootstrapped. e.l.f. Beauty at 70.7% and Crocs at 58.3% lead on category and pricing discipline, not on a capital subsidy.
- Choose your capital structure for runway and optionality, not for margin lift. Raise for a retail footprint, content moat, or M&A roll-up. Do not raise expecting a better COGS structure.
Most operators considering a Series A or B believe one of two things about venture capital. The first is that VC dollars buy you a better gross margin (the "scale gives you better COGS" story). The second is that bootstrapping caps your category position because you cannot match a funded competitor's spend. We pulled FY2025 10-K filings for 12 publicly-traded ecommerce and DTC brands to test the first claim. The data is direct: capital structure does not change gross margin. The cohorts overlap heavily, the highest and lowest gross margins in the dataset both belong to bootstrapped or VC-backed brands at extremes, and five years of post-IPO data shows no structural step-up. The real divergence between cohorts is operating cash flow, which is where we will end up.
We split the 12 brands into two cohorts. VC-backed brands raised $50M+ of institutional venture capital across two or more priced rounds pre-IPO: FIGS, Warby Parker, Allbirds, Peloton, Rent the Runway, and Stitch Fix (borderline at $42M, kept as VC-backed to be conservative). Bootstrapped or founder-funded brands raised nothing, raised under $50M total, or took only late-stage growth equity or PE roll-up capital after they were already profitable: Crocs, YETI, Vera Bradley, Revolve, Lululemon, and e.l.f. Beauty.
The "venture capital buys you a better gross margin" myth, in one chart
The bootstrapped cohort averages 57.2% gross margin in FY2025 across six companies. The VC-backed cohort averages 51.4% across five companies (excluding Rent the Runway as a rental-model outlier). The 5.8 point gap is real but smaller than the dispersion within each cohort, and it tracks category mix more than capital structure. The cohorts overlap heavily at the gross-profit line.
What the chart actually shows is dispersion within each cohort that is wider than the gap between them. The highest gross margin in the entire dataset is e.l.f. Beauty at 70.7%, bootstrapped (PE-led growth post-bootstrap). The highest VC-backed entry is FIGS at 66.5%, and FIGS raised the least venture in the cohort at roughly $70M. The lowest gross margin (excluding RTR) is Allbirds at 41.0%, despite $202M of pre-IPO venture. Capital raised does not predict where a brand lands on this chart. Category does. Pricing discipline does. Cap table does not.
Company Cohort Pre-IPO VC ($M) FY2025 revenue ($M) Gross margin (%) e.l.f. Beauty Bootstrapped (PE-led) 200 1,636.5 70.7 FIGS VC-backed 70 631.1 66.5 Crocs Bootstrapped 5 4,040.6 58.3 YETI Bootstrapped 67 1,868.5 57.4 Lululemon Bootstrapped 0 11,102.6 56.6 Warby Parker VC-backed 535 871.9 54.0 Revolve Bootstrapped 15 1,225.7 53.5 Peloton VC-backed 994 2,490.8 50.9 Vera Bradley Bootstrapped 0 269.7 46.4 Stitch Fix VC-backed 42 1,267.2 44.4 Allbirds VC-backed 202 152.5 41.0 Rent the Runway VC-backed (rental outlier) 420 43.8 -102.1
Where the VC dollars actually went: SG&A, not COGS
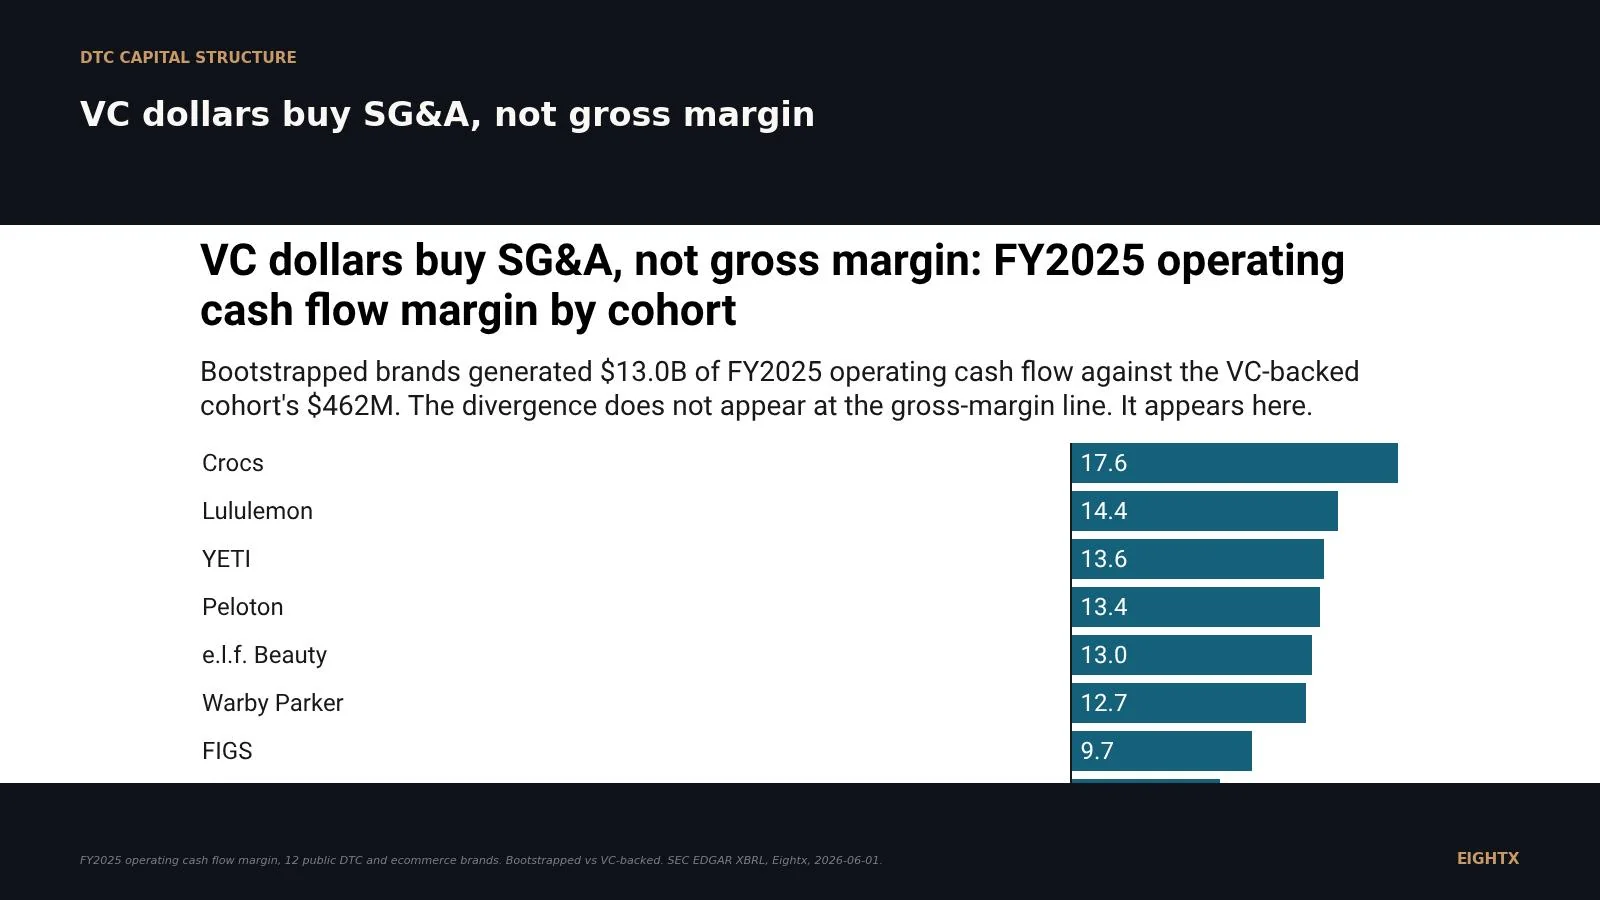
Now the chart that carries the real cohort signal. Operating cash flow margin (cash from operations as a share of revenue) tells the story the gross-margin line hides.
Bootstrapped brands cluster between roughly negative 4% and 18% positive operating cash flow margin, with the four largest (Lululemon, Crocs, YETI, e.l.f.) all between 13% and 18%. The VC-backed cohort straddles zero. Only Peloton (13.4%, after years of burn), Warby Parker (12.7%), and FIGS (9.7%) sit above 5%. Allbirds is at negative 36%. The aggregate gap is real: bootstrapped cohort generated roughly $2.83B of FY2025 operating cash flow across six companies, the VC-backed cohort generated roughly $478M across five (excluding Rent the Runway). On a per-dollar-of-revenue basis that is 14.0% versus 8.8%, a 1.6x gap, and the VC-cohort figure is heavily carried by Peloton and Warby Parker after years of prior burn.
The structural reason this gap exists is SG&A. Warby Parker's FY2025 SG&A was $476M, up from $437M in FY2023. Revenue grew 30% over those two years and SG&A as a percentage of revenue dropped from 65% to 55%, which looks like operating efficiency. But in absolute dollars Warby Parker still spends 1.4x what FIGS spends on SG&A ($476M vs $349M, despite operating at a smaller revenue scale than Lululemon) and 3x what Vera Bradley spends ($158M). VC dollars do not buy a lower COGS structure (consistent with the cohort GM data). They fund a 7-to-10-year SG&A buildout that depresses operating margin until the brand grows into it or restructures out.
This is what venture capital actually funds in DTC. Retail footprint. Content production. Headcount in marketing, ops, brand, finance, retail operations, supply chain. Real estate. None of those line items hit COGS. All of them depress operating margin and burn cash for the better part of a decade until the brand either grows into the cost structure or restructures out of it.
Five years, no gross-margin step-up
We pulled the FY2021 through FY2025 gross margin trajectory for each VC-backed brand in the cohort to test whether the post-IPO capital eventually produced a structural margin lift. It did not.
Allbirds went down, from 52.9% in FY2021 to 41.0% in FY2025. The FY2025 10-K cites promotional intensity and tariff exposure as ongoing headwinds. Warby Parker improved 2 points, from 52.0% to 54.0% over four years. That improvement is real but consistent with where the broader specialty-apparel band sits anyway (50-65%). Peloton flatlined in the high 40s to low 50s through the post-IPO years. FIGS, the cohort gross-margin leader, has compressed 1.1 points FY24 to FY25 due to tariffs and inventory write-offs (per its FY2025 MD&A, accession 1846576/000162828026012333) and was already at 66.5% before raising. We trace five-year trajectories explicitly for these four named brands; Stitch Fix and Rent the Runway's five-year paths are not detailed in this post but the FY2025 datapoints sit in the cohort table.
None of the post-IPO trajectories show the "capital subsidizes scale, scale lowers COGS, lower COGS lifts gross margin" arc that the raise-to-scale narrative assumes. The brands that print high gross margins were already going to print high gross margins because of category and pricing power. The brands that print low gross margins (Allbirds, Stitch Fix, Peloton) have not been able to fund their way out of the category ceiling.
The bootstrapped cohort tells the same story from the other direction. e.l.f. Beauty, never reliant on early-stage venture, prints 70.7% because beauty as a category prints 65-85% across both the public and private benchmarks (per Hycos 2026 vendor data). Crocs at 58.3% reflects branded-footwear pricing power. Lululemon at 56.6% reflects premium-apparel category economics. None of these are capital-structure stories. They are category stories.
What this means if you are at $10M to $150M and considering a raise
Three operator decisions to make from this data.
Do not raise expecting gross-margin lift. The 12-company dataset is unambiguous: capital structure does not move gross margin. If your pitch deck shows GM expansion in years 2 and 3 attributable to "scale economies," strip it out. The public data does not support it. The category ceiling is real and you are inside it or outside it before the wire hits.
Do raise if you need a retail footprint, content moat, or M&A roll-up. Those use cases genuinely require capital that operating cash flow at $20M to $100M cannot fund fast enough. Warby Parker's retail buildout, Peloton's content studio, Lululemon's late-stage international expansion (mostly cash-funded) all worked the same way: capital bought a strategic asset that took five-plus years to amortize. Raising for those reasons is rational. Raising for "better unit economics" is not.
If your business model already works at current GM, bootstrapping preserves 7-10 years of contribution-margin discipline you will lose under venture pressure. From the founder-call corpus we maintain internally (5,400+ recorded operator segments from calls we have run with founders), a 2025 advisor quote lands directly on this point: "The gross margin does not change when you raise. The only thing that changes is how much you are allowed to lose on the marketing line and still be alive." That is the bootstrapped-cohort cash story restated as operator advice. The bootstrapped six in our cohort generated roughly $2.83B of operating cash flow in FY2025 partly because nobody was forcing them to spend their way to scale.
The capital-raise decision for a $10M to $150M operator is therefore not about whether you can afford a better COGS structure. Your category sets that. The decision is whether you want to lose seven years of operating-margin discipline buying SG&A, and whether the strategic asset you are buying with the capital justifies that trade. Either answer is defensible. The "I need capital for gross margin" answer is not, because the public data says it is not there.
Capital structure does not buy a different COGS line in DTC. Bootstrapped public brands print 57.2% gross margin in FY2025. VC-backed brands print 51.4%. The gap is real but smaller than within-cohort dispersion, and it tracks category, not capital. What VC dollars actually buy is SG&A: retail footprint, content, headcount, real estate. Raise for those if you want them. Do not raise expecting a different COGS line. The data does not show that lift, in this cohort, across five years.
For related cluster context see our gross margin by revenue band benchmark, the Shopify-versus-Amazon channel-mix gross margin cut, and the DTC funding drought index for the capital-environment backdrop. If you are running the raise-or-bootstrap decision in real time, our fractional CFO services include capital-structure modeling against this cohort.
Sources and methodology
company annual reports filed with the SEC. FY2025 10-K filings for 12 publicly-traded ecommerce and DTC companies. XBRL tags pulled: Revenues (or RevenueFromContractWithCustomerExcludingAssessedTax where present), GrossProfit, CostOfRevenue or CostOfGoodsAndServicesSold, and NetCashProvidedByUsedInOperatingActivities. Gross margin computed as GrossProfit divided by Revenues. Operating cash flow margin computed as OperatingCashFlow divided by Revenues.
Cohort assignment rules. "VC-backed" is defined as raising $50M or more of institutional venture capital across two or more priced rounds before the IPO. "Bootstrapped or founder-funded" is defined as raising nothing, raising under $50M total, or taking only late-stage growth equity or PE roll-up capital after the brand was already profitable. PE-led growth rounds (e.l.f. Beauty via TPG in 2014, YETI via Cortec in 2012) are classified as bootstrapped because the founders ran the company on cash flow for the first 8-10 years and the PE round was a secondary or roll-up, not classic Series A venture. Stitch Fix at $42M sits right at the threshold; we classified it as VC-backed to be conservative.
Pre-IPO capital raised. Approximate amounts validated against each company's S-1 capitalization table, PitchBook public profile, and Crunchbase pre-IPO funding totals. We treat each dollar figure as "reported approximate" rather than precise. Aggregates: FIGS roughly $70M (Tulco), Warby Parker roughly $535M (Tiger Global, General Catalyst, T. Rowe Price), Allbirds roughly $202M (Tiger, T. Rowe, Maveron), Peloton roughly $994M (Tiger, True Ventures, L Catterton), Rent the Runway roughly $420M equity plus $250M debt (Bain Capital Ventures, Highland, Kleiner Perkins), Stitch Fix roughly $42M (Benchmark, Baseline). Bootstrapped cohort raised under $300M aggregate, mostly post-bootstrap growth equity, with Lululemon and Vera Bradley raising effectively zero.
Rent the Runway outlier handling. RTR's "cost of revenue" line on the 10-K includes depreciation of rental inventory because the business model rents apparel rather than selling it. The result is structurally negative gross profit (COGS greater than revenue) in every year since IPO. We include RTR in the cohort table for completeness but exclude it from cohort averages and note it on the chart as a rental-model outlier.
Fiscal year alignment. FY2025 used where fiscal year ends Dec 31 (FIGS, WRBY, BIRD, RVLV, CROX). For brands with non-calendar fiscal years: Peloton uses June 2025 close, Rent the Runway uses Jan 2026, Lululemon uses Feb 2026, YETI uses Jan 2026, Stitch Fix uses Aug 2025, Vera Bradley uses Jan 2026, e.l.f. Beauty uses March 2026. The most recent annual 10-K for each company is used.
Exclusions. Birkenstock (BIRK) and On Holding (ONON) both IPO'd recently with meaningful PE or minority venture pre-IPO and would be VC-backed under our cohort rules. Both report under IFRS-full taxonomy, so their data does not come through the us-gaap XBRL frames. Reported FY2025 gross margins per public earnings releases (BIRK roughly 60%, ONON roughly 60%) sit inside the VC-backed cohort range and would not change the cohort gap conclusion. We log them for v2.
Update cadence. This index refreshes after each Q4 earnings cycle (Feb-March) when the prior fiscal year's 10-K filings land. Next planned refresh: February-March 2027 for FY2026 data.
Limitations. "VC-backed" versus "bootstrapped" is not a clean binary. Lululemon's 2005 Advent transaction and Revolve's 2012 TSG transaction are real but neither funded growth; both were partial secondaries. The sample skews toward apparel, footwear, and accessories. Cohort sizes are small (5 VC-backed excluding RTR versus 6 bootstrapped). Gross-margin definitions vary across companies; some include occupancy or inbound freight in COGS. Comparisons are directional, not GAAP-identical. The OCF margin numbers are reported operating cash flow divided by revenue; they do not adjust for stock-based compensation (which is added back inside OCF) or for working-capital swings, both of which can move OCF meaningfully year to year. The directional conclusion (bootstrapped cohort generates more cash per dollar of revenue) holds across reasonable adjustments. We also assert "category sets your gross-margin ceiling" as the dominant driver, but with n=12 across four-to-five categories the dataset is too thin for a formal category-level statistical test; the cross-walk to industry verticals (Hycos 2026) is directionally consistent, not a proof. Adding the IFRS-filer pair (BIRK, ONON) at roughly 60% reported FY2025 GM would lift the VC-backed cohort average toward bootstrapped, narrowing rather than widening the gap. The triangulation bundle in our research folder (Perplexity, Pinecone, Parallel.ai) supports the directional conclusion.
Frequently asked questions
is my gross margin going to get better if i raise venture capital?
No. Five years of FY2021 to FY2025 data on the four VC-backed brands we trace (Allbirds, Warby Parker, Peloton, FIGS) shows zero structural gross-margin step-up post-IPO. Allbirds declined. Warby Parker improved 2 points over four years which is consistent with the bootstrapped specialty-apparel band it was always going to land in. Your category sets your gross margin ceiling, not your cap table.
should i bootstrap or raise to scale my dtc brand to $50m or $100m?
Depends what you are trying to build. If you need a retail footprint, content moat, or M&A roll-up, raise. Those genuinely need capital that operating cash cannot fund fast enough. If your unit economics work at current scale and you want to compound margin discipline, bootstrap. The data shows VC does not improve gross margin and it costs you 5-10 years of operating-margin discipline.
how much did figs warby parker allbirds peloton actually raise before ipo?
Approximate totals from S-1 capitalization tables and PitchBook: FIGS roughly $70M (Tulco), Warby Parker roughly $535M (Tiger, General Catalyst, T. Rowe), Allbirds roughly $202M (Tiger, T. Rowe, Maveron), Peloton roughly $994M (Tiger, True, L Catterton), Rent the Runway roughly $420M equity plus $250M debt (Bain Capital Ventures, Highland, Kleiner). Aggregate across the five primary brands is over $2B.
what is the actual gross margin of warby parker stitch fix and revolve in 2026?
FY2025 10-K filings: Warby Parker 54.0%, Stitch Fix 44.4%, Revolve 53.5%. Warby Parker has improved 2 points since FY2021. Stitch Fix has compressed. Revolve has been steady in the low 50s for five straight years. All three sit inside the broader specialty-apparel and online-retail band.
does venture capital subsidize my cost of goods or my marketing?
Operating expense. Marketing, headcount, real estate, content production. Warby Parker spent $476M on SG&A in FY2025 to build a 297-store retail footprint. FIGS spent $349M. Vera Bradley, bootstrapped, spent $158M. VC dollars fund the lines below gross profit. They do not buy a different COGS structure.
is rent the runway's gross margin really negative?
Yes, but it is a model artifact. RTR rents apparel rather than selling it, so its cost of revenue line on the 10-K includes depreciation of rental inventory. The result is gross profit running below zero in every year since the IPO. It is not a brand failure narrative. It is a reporting-structure feature of the rental model. We flag it as an outlier and exclude it from cohort averages.
did peloton's $994m of venture capital give them a better gross margin than crocs?
No. Peloton's FY2025 gross margin is 50.9%. Crocs is 58.3%. Peloton raised 200x what Crocs raised pre-IPO. The capital bought Peloton a content studio, a hardware product line, and a retail presence. It did not buy a better COGS structure. Crocs sits higher because of category (branded footwear with pricing power) and pricing discipline.
is bootstrapping a disadvantage if my competitors are raising rounds?
Not on the gross-margin line. The data shows your category ceiling and your pricing discipline set your gross margin. Capital structure does not. Where bootstrapping costs you is speed: VC-backed competitors can outspend you on paid acquisition, retail rollout, and headcount for 5-10 years before the math catches up. If your customer comes from word-of-mouth or organic, that gap is survivable. If you are paid-acquisition dependent, plan for it.