
Insights
International revenue share by ecommerce vertical 2026: public 10-K benchmarks
Your vertical sets the international ceiling more than your execution does. Footwear brands like Crocs reach 49% international revenue, athletic apparel (Lululemon) sits around 25 to 30%, and home goods brands like Wayfair trail at 12%. Public DTC 10-K geographic splits show that categories with fashion cachet and low freight weight consistently outrun domestic-heavy verticals on international mix.
Key Takeaways
- The 7-company public DTC and CPG sample posts a 21% median international revenue share in FY2025. If you sit in apparel, beauty, or lifestyle CPG above $25M revenue and you're under 10% international, you're behind the public-company curve.
- Crocs Brand pulled its international share from 41% to 48.6% in two years (FY2023 to FY2025), the steepest deliberate intl swing in the sample. The growth came from China, India, Japan, South Korea, and Western Europe.
- International is where the growth was in FY2025. Lululemon Americas comparable sales were down 1% while combined international grew 22% on a constant-dollar basis (China Mainland +20%, Rest of World +9%). YETI U.S. shrank 1.1% while international grew 16.2%. Vita Coco international grew 37.1% versus Americas 15%.
- Vertical sets your ceiling more than your skill does. Footwear and athletic apparel hit 29-49% international; mass beauty, premium lifestyle, and marketplaces cluster at 21-26%; beverage and home goods sit at 12-17%.
- Etsy reports 26% non-U.S. on GMS, not net revenue. Don't compare it apples-to-apples with Wayfair's 12% segment revenue. Different denominator, different story.
For a $5M to $150M ecommerce founder asking "should I be selling internationally yet, and how much?" the public companies in your category already published the answer in their 10-K. We pulled FY2025 geographic segment splits from seven public DTC, CPG, and marketplace 10-Ks filed January through May 2026. The numbers say your vertical sets the ceiling more than your execution does, and the gap matters because in this sample international was the only segment growing for Lululemon and YETI in FY2025. Here's what the data shows and what to watch in 2026.
The headline: international share by vertical, public 10-K benchmarks FY2025
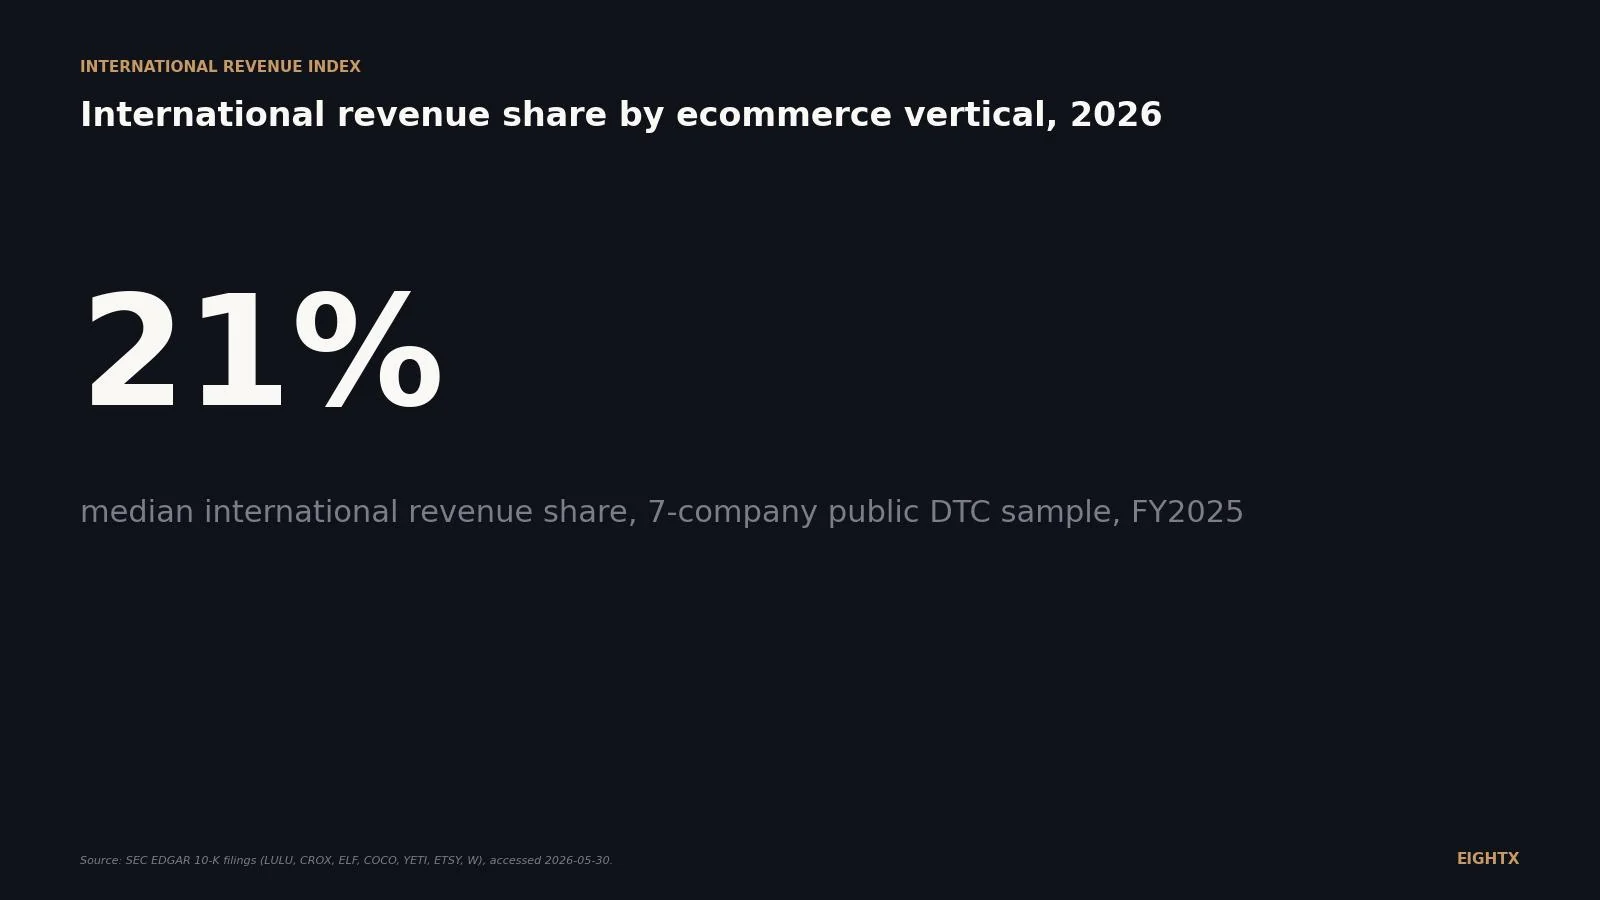
The seven-company sample lines up cleanly when you sort by international revenue share. Crocs Brand leads at 48.6%, Wayfair anchors the bottom at 12%, and the median sits at 21%.
The same data, with the underlying revenue figures so you can cross-check your own vertical:
Company (ticker) Vertical Total revenue ($M) Intl revenue ($M) Intl share (%) Fiscal year end Crocs (CROX), Crocs Brand only Casual footwear 3,326 1,616 48.6% 2025-12-31 Lululemon (LULU) Athletic apparel 11,103 3,256 29.3% 2026-02-01 Etsy (ETSY), GMS basis Online marketplace (GMS) N/A N/A 26.0% 2025-12-31 YETI (YETI) Premium drinkware and coolers 1,868 394 21.0% 2026-01-03 e.l.f. Beauty (ELF) Mass beauty 1,636 344 21.0% 2026-03-31 Vita Coco (COCO) Functional beverage 610 101 16.6% 2025-12-31 Wayfair (W) Home goods (online) 12,457 1,495 12.0% 2025-12-31
The cluster pattern is what matters for operators. Footwear and athletic apparel lead. Mass beauty, premium lifestyle, and marketplaces sit at 21% to 26%. Functional beverage and online home goods sit at 12% to 17%. That spread tracks shipping economics, regulatory friction, and how portable the brand is across cultures. It is not a function of skill or ambition.
Why footwear and athletic apparel hit 30 to 50% international while home goods stalls at 12
The vertical ceiling has structural causes, and your category sits in one of them whether you want it to or not.
Footwear travels well. Crocs sells the same SKU in São Paulo, Seoul, and Stuttgart with marginal product adaptation, light shipping cost per unit relative to AOV, and a brand whose "comfort plus dorky charm" identity reads cleanly in any culture. Crocs' 2025 10-K names China, India, Japan, South Korea, and Western Europe as its Tier-1 international markets, and the 10-K narrative explicitly treats international as the growth engine. That's a deliberate, multi-year capital allocation choice that's now showing up in the share number.
Athletic apparel travels almost as well. Lululemon's China Mainland revenue is now $1,755M (15.8% of total) and grew 20% on constant currency in FY2025 (combined international up 22%) while Americas shrank 1%. The brand globalization premium is real and Lululemon is collecting it.
Home goods runs into structural friction in every direction. Heavy boxes mean shipping economics are hostile across borders. Returns are expensive enough that the unit economics rarely work. Country-by-country supplier networks don't share inventory. Local taste in furniture varies more than local taste in T-shirts. Wayfair exiting Germany in January 2025 was the clean expression of all of this. They concentrated on U.S., Canada, UK, and Ireland because those are the only geographies where the model survives.
Beverage sits in the middle. Vita Coco's product is light, shelf-stable, and benefits from the global beverage distribution machine, so 16.6% international with 37% growth is plausible. But beverage hits regulatory walls (food labeling, ingredient rules) that lifestyle goods don't.
International is where the growth was in FY2025
Look at the same companies through a growth lens and the international gap widens.
Three of the four brands grew international faster than domestic. Two of them (Lululemon, YETI) had domestic shrink while international compounded double-digits. Wayfair was the exception, with both segments crawling, which is consistent with the structural home-goods ceiling above.
Company Vertical Domestic growth (%) International growth (%) Read Lululemon Athletic apparel -1.0% +22.0% Intl carrying growth YETI Premium drinkware -1.1% +16.2% Intl carrying growth Vita Coco Functional beverage +15.0% +37.1% Both growing, intl faster Wayfair Home goods +5.5% +3.7% Steady (slow both sides)
The implication for a private operator: if you're growing fast in the U.S. and ignoring international, you may be earning the easy half of your TAM and leaving the harder half (the one your public peers are quietly compounding) on the table. If your U.S. growth is decelerating, international is not a "future bet." It is the most likely answer for where the next $5M of growth comes from in 2026.
The Crocs trajectory: a $4B brand pulling international from 41% to 49% in two years
Crocs is the cleanest case study in the sample because the trajectory is monotonic, the company headlines it in their Strategy section, and the numbers are unambiguous.
That's a 770-basis-point swing in 24 months, on a brand doing $3.3B in revenue. To put a private-operator analog on it: if you're a $30M brand and you move your international share from 15% to 23% in two years, you've added roughly $2.4M of international revenue while holding U.S. flat, which is more than most $30M brands will add in any channel.
Crocs' 10-K explicitly names China, India, Japan, South Korea, and Western Europe as the Tier-1 international markets carrying this. The strategy section reads as a multi-year, capital-funded, structured market entry program. That is the playbook for an operator who decides international is the growth story, not an opportunistic add-on.
Vertical sets your ceiling more than skill does. Footwear and athletic apparel get to 30 to 50% international because the unit economics and the brand portability earn it. Home goods caps at 12% because the boxes are too heavy and the local taste is too local. If you're picking which battle to fight in 2026, pick the one your category structure already wants you to win.
What this means for your business if you're a $10M to $150M operator
Three calls to make in the next 90 days.
Benchmark your billing-address-country split against your vertical's public peer. Pull the last four quarters of revenue by ship-to country. If you're in apparel, beauty, or premium lifestyle and you're under 10%, you're behind the public-company curve and the question is whether the gap is opportunity (you haven't tried) or structural (your category has a ceiling). For most $10M to $50M brands the answer is opportunity. The public-company pattern says by $25M you should already be running a deliberate pilot.
Sequence your first move by language and customs friction, not by market size. Almost every operator we've worked with started in Canada (frictionless customs, same language) or the UK (English, EU access, AusPost-quality logistics) before pushing into Germany, Australia, or Japan. The pattern in the public-co data agrees. Crocs and Vita Coco both led their international expansions with UK and Western Europe before scaling Asia, and Lululemon's 10-K breaks international into China Mainland and a Rest of World bucket that aggregates multiple developed-market geographies.
Bring a fractional CFO into the international decision before you sign a 3PL contract. The math on international has shifted in 2026 because of U.S. tariff exposure. Lululemon and YETI both flag tariff impact on FY2025 results in their 10-K MD&A sections. If you're sourcing in Asia and shipping out of a U.S. warehouse, building an EU or AU fulfillment node now may save more on duty than it costs in setup. That math is exactly the kind of question a fractional CFO should run before you sign anything. We do that on our interim CFO services and the fractional CFO pricing guide page covers what that engagement typically looks like for a brand your size.
Sources and methodology
We pulled FY2025 (or FY2026 for ELF, whose fiscal year ends March 31) geographic segment data from seven SEC 10-K filings via SEC EDGAR. The specific accession numbers and document offsets are below for anyone replicating the pull.
Lululemon's 10-K (filed 2026-03-17, accession 0001397187-26-000020) breaks revenue into Americas, China Mainland, and Rest of World. The segment table shows Americas $7,847M (70.7%), China Mainland $1,755M (15.8%), and Rest of World $1,501M (13.5%). The MD&A confirms Americas comparable sales were down 1% on constant currency, China Mainland was up 20%, and Rest of World was up 9%, with combined international growth of 22%.
Crocs' 10-K (filed 2026-02-12, accession 0001334036-26-000006) states international sales were 48.6% of Crocs Brand revenue in 2025, up from 44.1% in 2024 and 41.0% in 2023. HEYDUDE Brand is U.S.-dominant. Consolidated CROX (Crocs Brand plus HEYDUDE) international share is approximately 40%. We led with Crocs Brand because the company itself headlines that number.
Vita Coco's 10-K (filed 2026-02-18, accession 0001482981-26-000022) reports Americas net sales of $508.8M (83.4%) and International of $101.0M (16.6%) with International growing 37.1% YoY, driven by the UK and Germany.
YETI's 10-K (filed 2026-02-27, accession 0001670592-26-000013) reports U.S. net sales of $1,474.1M (79%) and International of $394.4M (21%), with International up 16% YoY and Japan launched in Q2 2025. International share was 19% in 2024, so the 2-point gain is real.
e.l.f. Beauty's 10-K (filed 2026-05-21, accession 0001600033-26-000020) discloses U.S. = 79% of net sales and International = 21% for fiscal year ended March 31, 2026. Top international markets cited are UK, Canada, and Germany.
Etsy's 10-K (filed 2026-02-19, accession 0001370637-26-000019) discloses 74% of GMS from U.S. buyers and 26% from buyers outside the U.S. Depop subset has the identical 74/26 split. Etsy reports geography on a GMS basis rather than net revenue, which is why we flag it as non-comparable to the others in the table footer.
Wayfair's 10-K (filed 2026-02-19, accession 0001616707-26-000027) reports the U.S. segment at 88% of consolidated revenue, with International (Canada, UK, Ireland) at 12% of $12,457M total. Wayfair exited Germany in January 2025, which is why the International segment is smaller than it was in FY2023 and FY2024.
The limitations matter. Public-company geographic segments report on different bases (revenue vs GMS, calendar vs fiscal year, brand vs consolidated), so the cross-vertical comparison is directional rather than apples-to-apples. Private DTC operators typically measure international by ship-to country, which approximates the public segment number but isn't identical. We excluded Beyond Meat, Coty, and Estée Lauder from the numerical table because the financial-statement MCP did not surface clean geographic breakdowns within our pull budget. Directional context from those filings: Estée Lauder runs roughly 65 to 72% international, which is the contrast point to ELF's 21% and confirms that vertical-within-vertical (prestige vs mass beauty) matters more than vertical alone.
This index is refreshed quarterly as new 10-Ks land. Next refresh target: August 2026, after Q2 earnings season closes.
Frequently asked questions
when should a $10m dtc brand make its first international move?
Most operators we work with make their first deliberate move between $5M and $15M revenue, usually into Canada or the UK because the language, customs paperwork, and ad-platform mechanics are closest to home. The public-company pattern says by $25M you should be running a real pilot, not a trickle of opportunistic orders. If you're past $25M and your vertical median is 20%+, every quarter you delay closes the window.
how much international revenue is normal for a public dtc brand in apparel?
Athletic apparel and footwear sit at 29% to 49%. Lululemon is 29.3% international in FY2025 with China alone at 15.8% of total revenue. Crocs Brand is 48.6%. Mass apparel and accessories tend to cluster lower because the brand globalization premium is smaller. If your apparel brand is over $30M and under 15% international, you have headroom.
is 20% international revenue share a good benchmark for a $30m ecommerce brand?
Yes, with vertical caveats. The 7-company public sample posted a 21% median in FY2025, and that's a reasonable target for apparel, beauty, premium lifestyle, and marketplace brands. Food and beverage runs lower (15% to 17% in our sample). Home goods runs lower still (12%). Look at your specific vertical's public peers, not the cross-sample median.
which ecommerce verticals are most international-exposed?
Footwear and athletic apparel lead at 29% to 49%. Premium lifestyle, mass beauty, and marketplaces cluster at 21% to 26%. Functional beverage sits at 16.6% and online home goods at 12%. The pattern reflects shipping economics, regulatory friction, and how globally portable the brand is. A pair of Crocs ships the same anywhere; a $400 sectional sofa to Munich is a very different P&L.
why is wayfair only 12% international when furniture is huge in europe?
Wayfair exited Germany in January 2025 and now operates only in the U.S., Canada, UK, and Ireland. Furniture economics punish international expansion: heavy parcels, slow delivery, expensive returns, and country-by-country supplier networks. Wayfair's 12% reflects the structural ceiling of online home goods, not a sales execution problem.
how does lululemon's china growth compare to its americas decline?
Americas comparable sales were down 1% in FY2025 on a constant-dollar basis. China Mainland grew 20% and Rest of World grew 9% on the same basis, for combined international growth of 22%. China alone now contributes 15.8% of total revenue ($1,755M). That gap is why the Lululemon story is now a China story even though Americas is still 70.7% of the business.
what's the difference between international revenue share and international gms share?
Revenue is what flows through your books; GMS is gross merchandise sales transacted on the platform. Etsy reports 26% non-U.S. on GMS because they're a marketplace and they take a fee, not the whole sale. Wayfair reports 12% on net revenue because they own the inventory. Don't compare them directly. If you run a marketplace, benchmark Etsy. If you own inventory, benchmark Wayfair, LULU, YETI, or COCO.
how do i benchmark my brand's international share if i'm not public?
Pull your billing-address-country revenue split for the last 4 quarters. Then map your vertical to the closest public-company peer in this post and compare your share to theirs. If you're materially below, the question becomes whether the gap is opportunity (you haven't tried) or structural (your category has a ceiling). Most of the time it's the first one. If you want a private comparable set rather than public-co, our team pulls Storeleads aggregates for vertical-specific Shopify-Plus benchmarks.