
Insights
Average SMS revenue share by ecommerce vertical, 2026: the 10-20% band and where your category lands
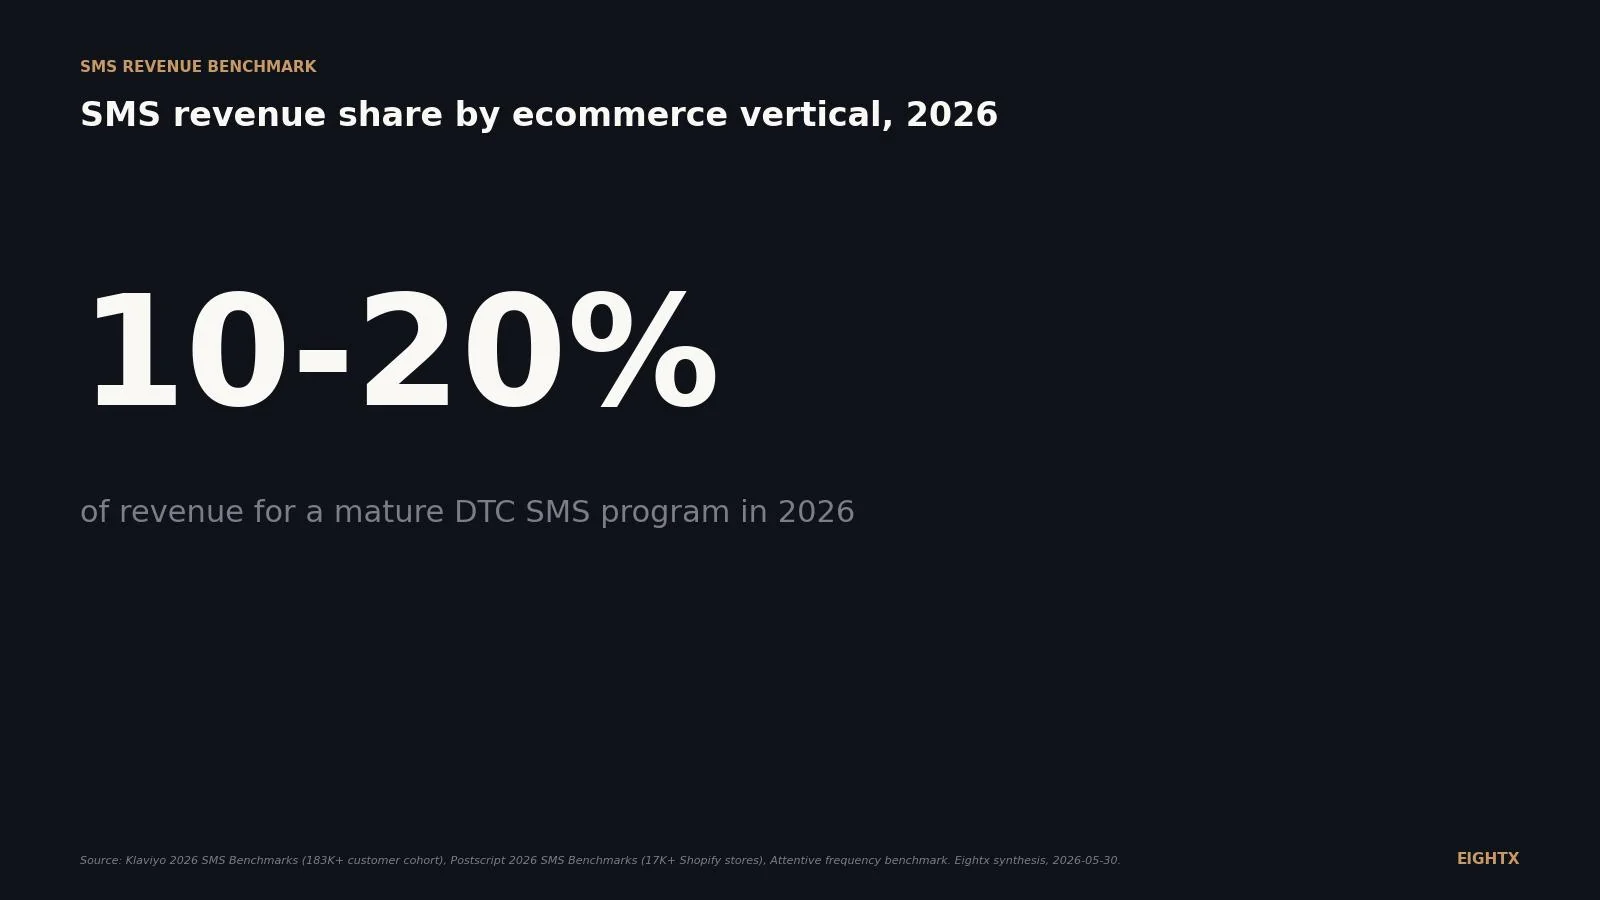
SMS accounts for 10 to 20% of total revenue for mature DTC programs in 2026, based on Klaviyo (183,000-plus customers) and Postscript (17,000-plus Shopify stores). Beauty and supplements sit toward the high end; electronics and home goods sit toward the low end. Programs below 5% of revenue share are either early stage or have list-health problems. Flows outperform campaigns 2 to 3x on revenue-per-message.
Key Takeaways
- SMS sits at 10-20% of total ecommerce revenue for mature DTC programs in 2026. No vendor publishes the by-vertical breakout, but the band triangulates across Klaviyo, Postscript, and Attentive. Beauty and supplements top the range; electronics and automotive sit at the bottom.
- Klaviyo's 2026 cohort (183,000+ customers) reports flows are 7.6% of SMS sends but 45.2% of SMS revenue. Flows produce roughly 8 times the revenue per recipient that campaigns do. If your program is 90%+ campaigns, your ceiling is mathematically capped.
- Postscript's 2026 benchmark (17,000+ Shopify stores) puts median revenue per message at $0.98. The 75th percentile earns $2.13. The 90th percentile earns $4.54. Abandoned-cart automations alone average $8.11 per message at a 9.1% conversion rate.
- Attentive analyzed 25 billion-plus messages and recommends 6-8 SMS per subscriber per month. The median Postscript program sends 1.91. The 90th percentile sends 6.65. Most mid-market brands are under-sending, not over-sending.
- If your SMS is under 8% of revenue and flows are under 30% of SMS revenue, the gap is automation coverage. Not list size, not ESP, not provider. The fix is welcome, abandoned-cart, browse-abandonment, post-purchase, and win-back flows wired in that order.
We get the question every week. A founder pulls their Klaviyo or Postscript dashboard, sees SMS is 7% of revenue or 12% or 18%, and asks: is that good. There's no published vendor number that answers it cleanly by vertical. Klaviyo, Postscript, Attentive, and Yotpo all publish engagement metrics (revenue per message, click-through rate, unsubscribe rate) but none of them publishes "SMS as a percent of total store revenue" broken out by vertical. So we triangulated. This is the 2026 read for a Shopify or Shopify Plus brand running $5M to $150M in revenue, with the by-vertical bands and the three operator questions that matter more than the absolute number.
The 2026 read in one paragraph
For a mature DTC program in 2026, SMS sits at 10 to 20% of total ecommerce store revenue. Early-stage programs (under 12 months of consistent sending, list under 5% of customer base) sit at 5 to 10%. Top-decile programs reach 20 to 30%+. The vertical caps the realistic ceiling: beauty, supplements, and food and beverage push to the high end because replenishment and high-repeat purchase patterns reward SMS flows. Electronics, jewelry, and automotive cap below 15% because purchase frequency is low and SMS works only on abandoned-cart and launch windows. The chart below shows the by-vertical bands plus the top-quartile target.
This is a synthesis, not a vendor-published table. The methodology section at the bottom of this post walks through how the bands were built and what each vendor's primary data actually covers.
What the published primary sources actually say
Three vendors publish enough engagement data to anchor the synthesis. Here's what each one covers and where the gates sit.
Klaviyo. The 2026 SMS Marketing Benchmarks page covers 183,000+ Klaviyo customers and publishes the most-cited SMS number in the SERP: flows are 7.6% of SMS send volume but 45.2% of SMS revenue. Flows generate roughly 8 times the revenue per recipient that campaigns do. Klaviyo's published quality bands for SMS campaigns: click rate "great" 14.6%+ / "good" 8.9-14.5%; conversion rate "great" 2.1%+ / "good" 1.0-2.0%; revenue per recipient "great" $2.42+ / "good" $0.66-2.41; unsubscribe rate "great" under 0.5% / "critical" 2.0%+. Klaviyo lets you filter the benchmark page by industry but does not publish per-vertical revenue share or per-vertical RPM in numeric form.
Postscript. The 2026 SMS Marketing Benchmarks (17,000+ Shopify stores, data window Jan 1 to Dec 15 2025) is the source for the operator-action numbers. Median revenue per message: $0.98. 75th percentile: $2.13. 90th percentile: $4.54. Cross-cohort average SMS click-through rate: 14.8%. Abandoned-cart automation EPM: $8.11. Abandoned-cart conversion rate: 9.1%. SMS acquisition rate (net new subscribers per 100 new orders, 30-day): median 1.06%, 75th pct 2.32%, 90th pct 5.22%. 30-day SMS retention: median 93.1%, 90th pct 99.1%. Send cadence: median 1.91 messages per subscriber per month, 90th pct 6.65. Postscript does not publish per-vertical breakouts on the public benchmark page.
Attentive. The 2026 frequency benchmark analyzed 25 billion-plus messages and recommends 6-8 SMS per subscriber per month to maximize revenue per send. Best click-through window: 12 to 3 PM local. Best conversion and revenue-per-send window: 4 to 7 PM local. Attentive notes that 90%+ of texts sent in their dataset are batch-and-blast campaigns. That mirrors Klaviyo's flow-vs-campaign asymmetry from the other side.
The Postscript percentile chart is the single most useful operator-action visual in this post. Pull your own RPM from your dashboard and put it on the chart.
A note on the cohort gap. Postscript's 14.8% all-cohort CTR sits at the top of Klaviyo's "good" campaign band (8.9-14.5%) and just below "great." That likely reflects Postscript's Shopify-only, SMS-mature cohort versus Klaviyo's broader denominator (which includes the email-led tail with SMS attached).
By vertical: where the realistic ceiling lives
The table below is the by-vertical read. It collapses to four bands:
- High-repeat consumables (beauty, supplements, food and beverage): 10 to 20% typical, 20-28% top-quartile. Replenishment and subscription flows do the heavy lifting.
- Apparel and accessories: 10 to 18% typical, 20-25% top-quartile. Drops, scarcity windows, and abandoned-cart flows dominate.
- Mid-AOV durables and discretionary (pet, sporting goods, jewelry, home and garden): 5 to 15% typical, 15-22% top-quartile. SMS works on launches and abandoned-cart, less on promo blast.
- Low-repeat / high-consideration (hardware, electronics, automotive): 3 to 10% typical, 10-15% top-quartile. SMS is rarely the primary owned channel; abandoned-cart and post-purchase flows carry most of the revenue.
Vertical Typical SMS % of revenue Strong / top-quartile target Notes Beauty / cosmetics 12-20% 25-28% High repeat plus replenishment flows Supplements / health and wellness 12-18% 20-25% Subscription flows dominant Food and beverage / consumables 10-18% 20-25% Replenishment plus restock flows Apparel / clothing and accessories 10-18% 20-25% Drops plus scarcity windows Pet 8-15% 18-22% Subscription plus refill flows Sporting goods 7-13% 15-18% Seasonal launches Jewelry 6-12% 15-18% High-AOV / low-repeat; SMS works on launches and scarcity Home and garden 5-12% 15-18% Mixed discretionary Hardware and home improvement 5-10% 12-15% Low repeat; SMS skews abandoned-cart Electronics 4-10% 12-15% Low repeat plus high consideration; flows much greater than campaigns Automotive 3-8% 10-12% Lowest band; SMS rarely the primary owned channel All-DTC midpoint 10-20% N/A Klaviyo + Postscript + Attentive cohort synthesis
The pattern that matters most: every "typical" band has a 5-10 point spread. The difference between landing at the low end versus the high end of your vertical isn't list size or ESP choice. It's flow coverage.
Flows vs campaigns: the asymmetry that defines mature programs
The Klaviyo 7.6% / 45.2% number is worth staring at. Flows are about 8% of message volume and almost half of revenue. Campaigns are 92% of message volume and just over half of revenue. The implied revenue multiplier per send is roughly 10 times.
Why the gap. Flows trigger on user intent: a cart abandonment, a browse abandonment, a recent purchase, a re-engagement window. Campaigns trigger on the calendar: a promo, a drop, a newsletter. Intent beats calendar every time.
The operator math: most brands send 90%+ campaigns and wonder why SMS revenue feels capped at 6-8% of total revenue. The fix is not more campaigns. The fix is a flow library, wired in this order:
- Welcome flow (3-5 messages, triggered on opt-in). Catches the highest-intent moment.
- Abandoned-cart flow (2-3 messages, triggered on cart-abandon event). Postscript average EPM here is $8.11 at 9.1% conversion. This is typically the single highest-EPM flow in the library and a meaningful share of SMS revenue for mature programs.
- Browse-abandonment flow (1-2 messages, triggered on product-page view without add-to-cart). Smaller revenue but high marginal lift.
- Post-purchase flow (2-3 messages: order confirmation enrichment, shipping, review request, subscribe upsell). Builds repeat-purchase rate and is the natural feeder into SMS-driven subscription if you have one.
- Win-back flow (2-3 messages at 60, 90, 120 days since last purchase). Recovers the lapsing cohort that campaigns can't see.
If you don't have these five wired, your flow share is mathematically capped, your overall SMS share is mathematically capped, and no campaign cadence increase fixes it.
Reading your own number against the band
Three quick checks any operator can run this week.
Check 1: SMS revenue / total store revenue, calendar quarter. Pull your last full quarter from Shopify (total store revenue) and from your SMS platform (SMS-attributed revenue). Divide. Compare to your vertical band in the table above. If you're below the "typical" low end, in our client work the issue is usually one of three things, ordered by what we see most often: flow coverage, list quality, or attribution window mismatch. This ordering is an Eightx operator observation, not a vendor-published ranking.
Check 2: RPM vs Postscript percentiles. Pull your average revenue per message from your platform. Compare to the chart above. Median is $0.98. 75th is $2.13. 90th is $4.54. If you're below $0.50 and flows are under 20% of SMS revenue, the gap is automation coverage, not list size or send volume.
Check 3: flow share of SMS revenue. Pull "% of SMS revenue from flows" from your platform. Compare to Klaviyo's 45.2% cohort benchmark. If you're under 30%, you have headroom. If you're under 20%, the welcome and abandoned-cart flows are either missing or underperforming.
A side note on list size. Founders ask whether their SMS list is big enough. The right question is the ratio. Mature SMS programs run an SMS list that's 30 to 50% the size of email. We've seen subscription brands at 43% (110K email, 47K SMS) tracking healthy. If your SMS list is under 15% of email and your opt-in capture is post-checkout only, the fix is moving capture to checkout itself and adding a pre-checkout welcome offer.
No vendor publishes "SMS as a percent of revenue by vertical" in 2026. The 10-20% band is a synthesis. The honest read for most mid-market brands: if your number is below 8% and your flow share is below 30%, the gap is automation coverage. Not ESP, not list size, not send volume.
What we're watching next
The next Postscript benchmark refresh lands in December 2026 (annual cadence). Klaviyo's Q2 2026 commerce trends report drops in mid-August alongside the earnings call. Attentive publishes a quarterly Pulse on send-time data. The iOS 26 release also changes how SMS click rates are measured, which means the 14.8% CTR baseline may shift in H2 2026 reporting. We'll update this post with the by-vertical bands and the cohort numbers each quarter.
For the broader DTC retention picture, our average ecommerce repeat purchase rate by vertical 2026 and average ecommerce orders per customer by vertical 2026 pages cover the cohort economics that determine how much SMS can lift.
Sources and methodology
This post relies on the published 2026 benchmark releases from three SMS platforms plus one financial filing and one third-party research note. None of the underlying vendors publishes SMS revenue as a percent of total store revenue broken out by vertical. The by-vertical table and chart are a synthesis, anchored to vendor engagement bands and Eightx operator framing on which vertical patterns push SMS revenue share up or down. Synthesis bands are not vendor-published numbers.
The Klaviyo 2026 SMS Marketing Benchmarks page (klaviyo.com/products/sms-marketing/benchmarks) is the source for the 7.6% of sends / 45.2% of SMS revenue flow split, the roughly 8x flow vs campaign revenue per recipient multiplier, and the 183,000+ customer cohort size. The Klaviyo Help Center "Campaign SMS and MMS benchmarks" article is the source for the campaign quality bands (click rate, conversion rate, revenue per recipient, unsubscribe rate). Klaviyo's industry filters provide more granular per-vertical SMS engagement data inside the marketing page interactive view; pull yours for your specific vertical at the link above.
The Postscript 2026 SMS Marketing Benchmarks blog post (postscript.io/blog/sms-marketing-benchmarks-what-good-performance-looks-like-in-2026) is the source for the 17,000+ Shopify store cohort, the Jan 1 to Dec 15 2025 data window, the revenue-per-message percentile bands, the acquisition and retention bands, and the cadence bands. The Postscript "Drive sales and revenue with SMS marketing" page is the source for cross-industry 14.8% SMS CTR, 9.1% abandoned-cart conversion, and $8.11 abandoned-cart EPM. Note that Postscript names this the "2026" benchmark by publication year; the data window is calendar 2025.
The Attentive "Best Times to Send SMS and Email Marketing in 2026" research (attentive.com/blog/best-time-to-send-sms-marketing) is the source for the 25 billion-plus message dataset, the 6-8 messages per month optimum cadence, and the click and conversion window timing.
Klaviyo's Q4 2025 Supplemental and Q1 2026 commerce trends report are the source for FY2025 revenue of $1.234B (+30% YoY), 196,000+ customers at Q1 2026, NRR 110%, and the +17.5% YoY text-message GMV trend across the Klaviyo cohort. Klaviyo does not break out SMS revenue, SMS NRR, SMS customer count, or SMS message volume as a separate financial segment. The Sacra research note on Klaviyo (third-party, not Klaviyo-disclosed) estimates SMS at roughly 10% of Klaviyo's revenue and an 18.2% SMS attach rate as of Dec 31 2024 (up from 16.0% YoY). We use Sacra's numbers as third-party benchmark, not as official disclosure.
Limitations worth disclosing: (1) no vendor publishes SMS percent of revenue by vertical, so the table is a synthesis; (2) Klaviyo's 7.6% of sends / 45.2% of SMS revenue split is an all-cohort number, not a per-vertical figure. Apparel and beauty likely skew higher on flow share, electronics likely lower, and the post applies the all-cohort split as the working anchor; (3) Postscript's cohort is Shopify-only and skews SMS-mature; the "real" SMS revenue share across all Shopify stores is likely lower than the cohort median because the no-program tail isn't represented; (4) SMS attribution is last-click in all three vendor platforms, which can overstate SMS contribution when SMS is the closing touch on a multi-channel journey; (5) Yotpo SMS was sunset Dec 31 2025, so no 2026 Yotpo benchmark exists in the mix; (6) vertical taxonomy differs across vendors (Klaviyo uses 13 categories; Postscript publishes industry pages but not full vertical breakouts), and the post collapses some categories for readability.
Refresh cadence: this is a living index, refreshed quarterly when the next Postscript, Klaviyo, or Attentive cohort update lands. Next target refresh: mid-August 2026 after Klaviyo's Q2 commerce trends report. The 10-20% band may move materially when Klaviyo or Postscript publish vertical-specific revenue-share data.
For Eightx's full benchmark research methodology, see our content pipeline and citation standards. For the underlying research bundle and triangulation log (Pinecone + Perplexity + Parallel.ai, accessed 2026-05-29), see the research repository linked in our methodology page.
Frequently asked questions
what % of my ecom revenue should come from sms in 2026?
For a mature DTC program, 10 to 20% of total store revenue. Early-stage programs sit at 5 to 10%. Top-decile programs reach 20 to 30%+. The exact ceiling depends on your vertical: beauty and supplements push the high end; electronics and automotive cap below 15%.
is 10% sms revenue good or bad for a $5m apparel brand?
At $5M, 10% SMS revenue is the bottom of the typical band for apparel and a fine starting point. The real question is your flow share. If 10% is mostly campaigns, you have a ceiling. If flows are 40%+ of that 10%, you have a foundation to push toward 15-18%.
why does klaviyo say flows are 45% of sms revenue but my flows look weaker than that?
Two reasons. Either your flow library is thin (welcome and abandoned-cart only, no browse, post-purchase, or win-back) or your opt-in capture happens too late in the funnel so the welcome flow sees small audiences. Both are fixable inside 30 days.
should i be sending 6-8 sms per month like attentive recommends or is that too much?
Most mid-market brands are under-sending, not over-sending. The median Postscript program sends 1.91 per subscriber per month. The 90th percentile sends 6.65. If your unsubscribe rate is under 0.5% and your RPM is rising as you add cadence, keep going. Stop when unsubscribes cross 1%.
how do i actually compare my postscript rpm to the benchmark? is $1.50 good?
$1.50 RPM puts you between the 50th and 75th percentile of the 2026 Postscript cohort (median $0.98, 75th pct $2.13). That's a solid mid-market number. The 90th percentile is $4.54, so the headroom is real if your flow share and abandoned-cart coverage improve.
what's the typical sms revenue share for beauty vs apparel vs supplements?
Beauty: 12 to 20% typical, 25-28% top-quartile. Apparel: 10 to 18% typical, 20-25% top-quartile. Supplements: 12 to 18% typical, 20-25% top-quartile. All three benefit from replenishment and high-repeat purchase patterns that SMS handles better than email.
is sms cannibalizing my email revenue or adding to it?
Mostly additive in mature programs. SMS sits at 10-20% of revenue for mature DTC programs, with overlap on email mainly through the abandoned-cart and post-purchase flows. The owned-channel combined ceiling lands meaningfully higher than either channel alone. If your combined email plus SMS number is below 25% of revenue, the gap is flow coverage, not channel choice.
how do i tell if my sms unsubscribe rate is healthy?
Under 0.5% is great. 0.5-1.0% is fine. Above 2% is a problem (Klaviyo calls it critical). The right number depends on cadence and offer mix. If you push cadence from 4 to 8 sends per month and unsubscribes stay under 1%, you have a healthy program. If they spike above 2%, cut cadence and reset offer balance.