
eCommerce
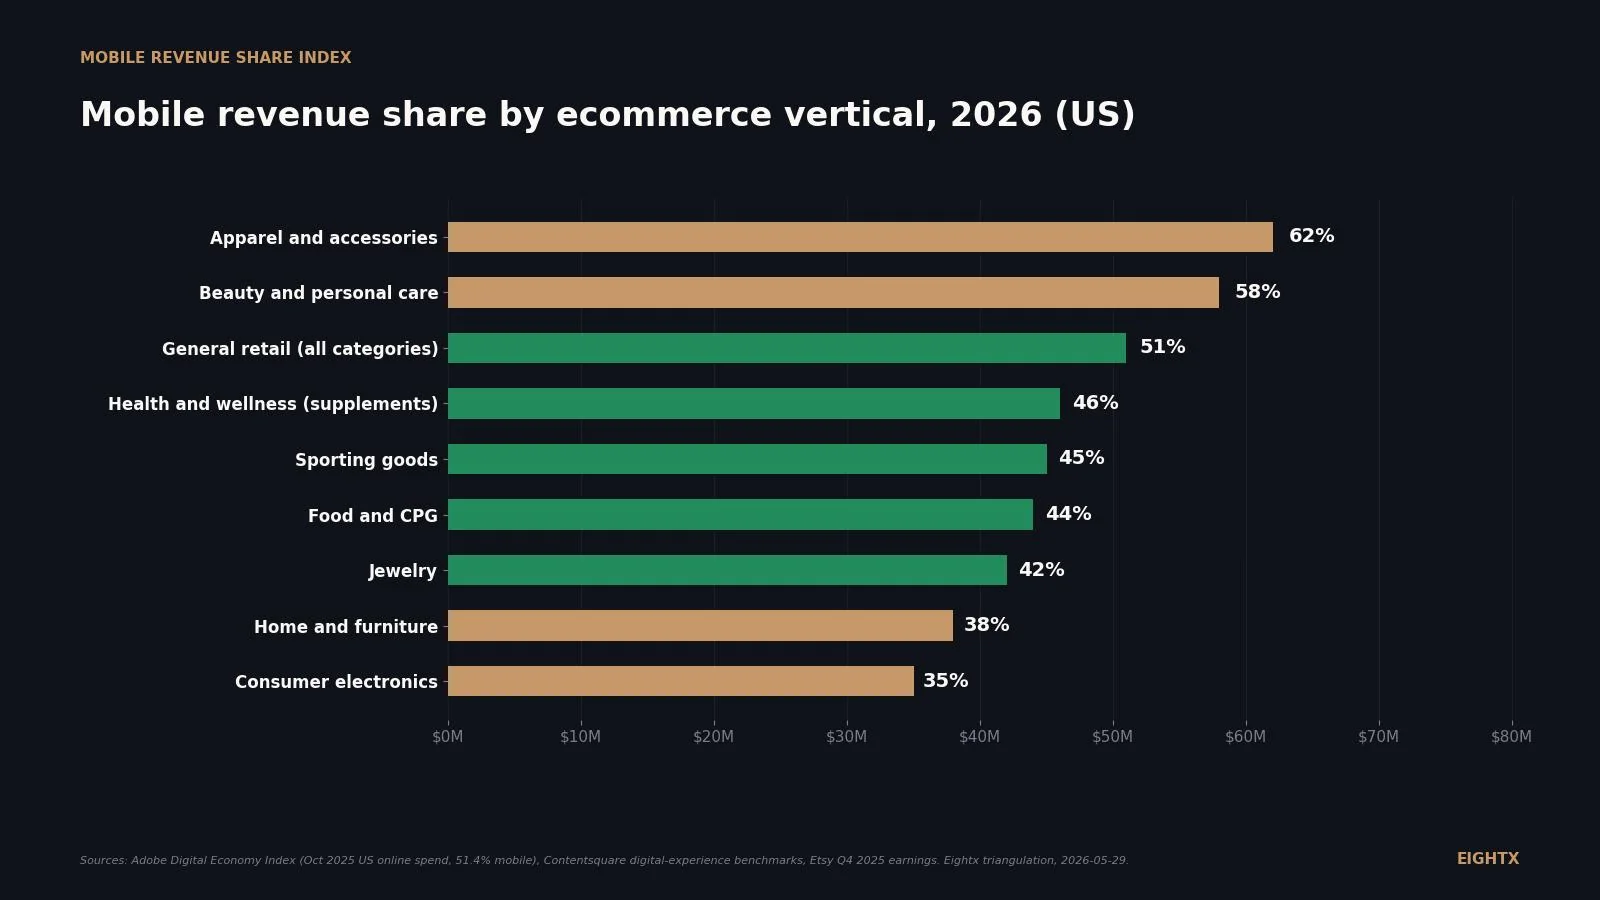
Mobile revenue share by ecommerce vertical, 2026: apparel 62%, electronics 35%, retail average 51%
Mobile crossed 51% of US online spend in October 2025 (Adobe) and now drives 62% of revenue in apparel and the majority in beauty. Electronics and home still skew desktop at around 35%. If your vertical is mobile-majority and your checkout or page speed is optimized for desktop, you are likely leaving conversion rate on the table where your highest-volume traffic actually lands.
Key Takeaways
- Mobile crossed 51% of US online spend in October 2025, per Adobe Analytics: $45.6B of $88.7B total, up 11.6% year-over-year. Mobile is now the majority channel by revenue for the first time in a non-holiday month.
- Mobile is about 73% of US retail site traffic but 51% of revenue. Contentsquare data puts mobile conversion at 1.9% versus desktop 3.6%. That 22-point traffic-to-dollars gap is the single biggest under-priced operating problem in DTC right now.
- Mobile share by category splits sharply. Apparel and beauty are already mobile-revenue-majority (58 to 62%). Electronics and home and furniture still skew desktop (35 to 38%) even though mobile dominates their traffic.
- Etsy is the only public DTC marketplace currently disclosing the number cleanly: mobile-app GMS share hit 46% in Q4 2025, with mobile-app GMS growth re-accelerating to +6.6% year-over-year (versus +5.0% in Q3 2025).
- Your 2026 planning anchor: 51% mobile revenue share on average, but 30 to 65% depending on category. Apparel and beauty operators should be benchmarking apps and one-tap checkout. Electronics and home operators should be defending desktop and treating mobile as a research surface.
Mobile crossed 51% of US online spend for the first time outside a holiday peak in October 2025. The single biggest under-priced problem hiding underneath that headline: mobile is roughly 73% of retail site traffic but 51% of revenue. That 22-point gap is where your conversion rate is leaking and the public-company apparel cohort is quietly running mobile-revenue-majority while you may not be.
This page tracks the 2026 mobile revenue share by ecommerce vertical and the read for operators sitting at $5M to $150M GMV. The categories with low consideration time and emotional purchases (apparel, beauty, accessories) are already mobile-revenue-majority. The categories with high AOV and comparison shopping (electronics, home, furniture) still skew desktop. Your tech-stack and ad-spend decisions for 2026 turn on which side of that split your brand sits on.
The 51% headline and the 33-point gap underneath it
The headline number from Adobe Analytics is clean and easy to read. In October 2025, US consumers spent $88.7B online, $45.6B of which came from mobile devices. That works out to 51.4% mobile, up from about 49% a year earlier. Mobile spend grew 11.6% year-over-year in October 2025 against total online growth of 8.2%, so mobile is widening its lead over the trailing year. One methodology flag worth surfacing up here, not just in the sources block: Adobe's "mobile" includes both smartphones and tablets. Tablet is typically a low-single-digit share of total mobile, so the 51% is overwhelmingly phone-driven, but it is not a phones-only number.
The headline is also misleading on its own, because traffic and revenue are on different scales. Contentsquare's digital-experience benchmark puts mobile at around 73.5% of US retail-site sessions, with mobile conversion rates around 1.9% versus desktop at 3.6%. So mobile sends roughly three-quarters of your sessions but converts at about half the rate of desktop, which is exactly why the revenue share lands at 51% rather than tracking the traffic share.
The structural reasons are well understood and they all point in the same direction. Mobile sessions skew toward browsing and discovery, driven by social referrals and push notifications, so intent per session is lower. Mobile checkout has more friction (typing, smaller fields, distraction context) so cart abandonment is higher. And mobile customers often bounce to desktop to complete higher-AOV purchases, which means desktop gets credit for revenue that originated on mobile.
For operators, the practical read is that the device-share-of-traffic number flatters you. The device-share-of-revenue number is what your unit economics actually run on. If you are budgeting your 2026 tech stack against "mobile is 73% of our traffic," you are over-investing in a channel that is paying you closer to 51 cents on the dollar of that traffic share.
Mobile revenue share by vertical: where mobile is winning and where it is not
Adobe publishes the overall mobile share, but no single vendor publishes a clean 2026 mobile-revenue share by ecommerce vertical. The Eightx estimates below are triangulated from three anchor points: Adobe's 51.4% overall, Contentsquare's category-level conversion gap, and Etsy's public mobile-app GMS share (the cleanest public-company proof point).
The shape of the chart matters more than the exact decimals. Categories cluster into four archetypes.
Mobile-revenue-majority categories (apparel 60-65%, beauty 55-60%) are emotional, low-consideration, low-AOV purchases that match how mobile sessions behave. Social discovery, influencer push, fast PDP, one-tap checkout. If you run a $10M apparel brand and your mobile revenue share is below 55%, you have a conversion problem, not a category problem.
Mid-range categories (supplements around 46%, sporting goods 45%, food and CPG 44%) skew slightly desktop because consideration cycles are longer and basket sizes are larger. Subscription mechanics pull these higher when present. A Ritual or Liquid IV running subscription-heavy will print closer to apparel numbers.
Desktop-dominant categories (home and furniture 38%, consumer electronics 35%) are high-AOV, high-comparison, high-research purchases where customers still pull out a laptop. These categories see the heaviest "research on mobile, buy on desktop" leakage.
Vertical Mobile revenue share Mobile traffic share Conversion gap (mobile vs desktop) Apparel and accessories 62% 78% -0.8 pts Beauty and personal care 58% 76% -1.2 pts Health and wellness (supplements) 46% 72% -1.0 pts Sporting goods 45% 70% -0.7 pts General retail (average) 51% 73% -1.7 pts Food and CPG 44% 68% -0.8 pts Home and furniture 38% 65% -0.9 pts Consumer electronics 35% 67% -1.2 pts
The conversion gap is the operating problem, not the traffic share
Most operators look at their device split and conclude "we are mobile-first." The dollar share says you are not. The conversion gap is the actual lever, and it varies wildly by category.
Food and beverage closes the gap to about 0.8 points because the products are routine and low-consideration. Health and beauty narrow to 1.2 points for similar reasons. Apparel sits at roughly 0.8 points if you exclude the high-AOV designer end. The gap blows out in electronics (1.2 points off a low 1.4% base, so mobile converts at roughly 54% of desktop) and furniture and luxury (where mobile converts at about half the desktop rate).
What this means for your business: the conversion-gap percentage tells you whether the next dollar belongs in mobile optimization or somewhere else. If your category's mobile conversion is already 80%+ of desktop (food, beauty, apparel), the easy wins are mostly done; the next 10% of conversion takes real engineering work or an app. If your category is at 50 to 60% of desktop (electronics, home, luxury), the cheap fixes (Shop Pay, faster LCP, simpler PDP) still have meaningful headroom.
There is also a regional layer worth noting for operators with cross-border revenue. UK mobile hit 61.5% of online revenue during the 2025 holiday season per Adobe UK (versus 51% in the US). Korea and China run higher still. AU and CA track closer to the US than to the UK. If you are a US brand expanding into the UK, expect your mobile-revenue share to step up about 10 points without changing anything about your stack.
Public-company proof points: Etsy at 46% mobile-app GMS
Most public DTC and consumer brands have quietly dropped quantitative mobile-share disclosure from their 10-Ks over the last three years. Wayfair, Stitch Fix, Revolve, Allbirds, Warby Parker, FIGS, ThredUp: all of them mention mobile qualitatively in their annual reports. None of them currently publish the percentage.
Etsy is the exception, and it is the cleanest public benchmark we have.
Etsy's Q4 2025 earnings presentation discloses mobile-app GMS share at about 46%, which Etsy itself describes in the deck as "stable sequentially at approximately 46%," with mobile-app GMS growth re-accelerating to +6.6% year-over-year (versus +5.0% in Q3 2025). The line trends from about 30% in 2020 to 46% in 2025, with the second half of 2025 ticking up after a flat 2023-2024 period.
Two cautions on the read-across. First, the 46% is mobile-APP only and excludes mobile web. Etsy's total mobile share (app plus mobile web) is meaningfully higher (likely 60%+, but not separately disclosed). Second, marketplaces like Etsy structurally over-index on mobile-app behavior because the discovery loop (push notifications, saved searches, repeat browsing) maps to app mechanics. A typical Shopify DTC brand without a native app should not benchmark to Etsy's 46% as a target; the Shopify-comparable number is closer to 55 to 70% total mobile share for apparel or beauty.
The more interesting data point is what Etsy's disclosure says about the build-an-app question. Etsy's app GMS growth re-accelerated in 2025 after a soft 2023-2024 period, which lines up with their renewed investment in app personalization and push. For DTC operators, that pattern is the signal: apps only pay off when you actually invest in the discovery loop, not when you just port your web checkout into a wrapper.
What to do with this in 2026: 4 plays by category archetype
The benchmarks above don't tell you what to do. The category archetype does.
Apparel and beauty (mobile-revenue-majority). Your next dollar belongs in mobile checkout and app evaluation. Confirm Shop Pay, Apple Pay, and Google Pay are all live on PDP. Run a 60-day Tapcart or Shop App pilot if you are above $20M and have 25%+ repeat-purchase rate. The math: if you can get 20 to 30% of mobile revenue to migrate into a one-tap app channel, you typically lift overall mobile conversion by 30 to 60 bps, which clears the $30k to $100k a year app stack cost easily.
Electronics, home, furniture (desktop-dominant). Defend desktop and treat mobile as the research surface. Do not over-invest in a native app. Do invest in fast mobile PDP, comparison tooling, and saved-cart cross-device handoff. Your customer is starting on mobile, finishing on desktop, and you want both sessions credited cleanly. Multi-touch attribution matters more here than in apparel.
Food, supplements, subscription-heavy (mid-range). SMS plus subscription-app loops are the lever. Mobile-revenue share lifts fastest in this archetype when you bolt on SMS retention (Postscript, Attentive) and convert one-time buyers into subscription. The app question is yes if your subscription rate is above 30% of revenue and your AOV is below $80; otherwise no.
Marketplaces and aggregators. Mobile-app GMS share is the metric. If you are running a marketplace or aggregator model, benchmark Etsy's 46% and target moving 1 to 2 points per quarter. Less than that and your app is a checkbox; more than that and you are building a discovery moat.
Mobile is 51% of US online revenue and 73% of US online traffic. The 22-point gap is the single biggest under-priced operating problem in DTC right now. Apparel and beauty operators should be benchmarking apps. Electronics and home operators should be defending desktop. Most everyone else should be installing one-tap pay and ignoring the rest of the noise.
Cross-references for the operating playbook
For the conversion-rate side of this, see our average ecommerce conversion rate by vertical breakdown. For the AOV side (the other half of the mobile economics equation), see average AOV by ecommerce vertical. For the broader retail-channel mix, see ecommerce penetration by category.
If you are sizing the cost of getting mobile conversion to parity (or close to it), the cash conversion cycle benchmark and DTC cost of goods index give you the working-capital backdrop. Mobile is the front-end story; working capital is what determines whether you can fund the next sprint of mobile work.
Sources and methodology
Adobe Analytics (October 2025 US online shopping report). US total online spend of $88.7B in October 2025, of which $45.6B (51.4%) was on mobile devices. Mobile growth of +11.6% year-over-year versus +8.2% for total online spend. Adobe defines "mobile" as smartphones plus tablets, with tablet typically a low single-digit share of total mobile. URL: https://business.adobe.com/blog/adi-october-2025-holiday-shopping-actuals
Adobe UK Holiday Shopping Report 2025. UK mobile revenue share for the November-December 2025 holiday window of 61.5% (£16.5B of total UK online holiday spend). Used as the cross-border calibration anchor for AU and CA brands. URL: https://business.adobe.com/uk/resources/holiday-shopping-report.html
Etsy Q4 2025 Earnings Presentation. Direct disclosure of mobile-app GMS share at about 46% (stable sequentially), with Q4 mobile-app GMS growth of +6.6% year-over-year (versus +5.0% in Q3 2025). Etsy is the only public US DTC marketplace currently publishing the quantitative mobile-share number. URL: https://investors.etsy.com/_assets/_7305615aee1870995ec41526328887fe/etsy/db/938/10062/presentation/%5BFor+website%5D+Q4+2025+Earnings+Presentation.pdf
Contentsquare digital-experience benchmark. Mobile share of US retail-site visits at about 73.5%, with mobile conversion at 1.9% versus desktop at 3.6%. Drawn from Contentsquare's 2024-2025 published benchmark coverage; treated as the device traffic-to-revenue gap anchor.
SQ Magazine 2026 ecommerce conversion benchmark compilation. Aggregated mobile and desktop conversion rates by vertical, used for Chart 2 and Table 1's conversion-gap column. URL: https://sqmagazine.co.uk/e-commerce-conversion-rate-statistics/
SEC EDGAR full-text search. We queried EDGAR for "mobile" plus "GMS" or "mobile devices" plus "orders" in 10-K filings to find public companies still publishing quantitative mobile-share disclosure. Of 271 candidate filings, Etsy was the only retail-relevant company with a current quantitative disclosure in its 2025 10-K and Q4 2025 earnings presentation. Wayfair, Stitch Fix, Revolve, Allbirds, Warby Parker, FIGS, and ThredUp all mention mobile qualitatively but no longer publish the percentage.
Methodology caveats. Category-level mobile revenue share is not currently published by any single primary-source vendor for the US market. The Chart 1 and Table 1 values are Eightx triangulations from Adobe's overall 51.4% anchor, Contentsquare's category-level conversion gap, Etsy's marketplace-specific 46% app share, and category-mix data from Adobe's broader Digital Economy Index. Operators should treat these as directional 2026 planning anchors, not vendor-published benchmarks. The Etsy mobile-app number understates total mobile share by an estimated 15 to 20 points because it excludes mobile web.
Update cadence. This page is refreshed quarterly when Adobe publishes its monthly Digital Economy Index update and Etsy publishes its quarterly earnings. Next update target: late August 2026 (Q2 2026 Adobe + Etsy Q2 earnings).
Frequently asked questions
what percentage of ecommerce revenue actually comes from mobile in 2026?
About 51% in the US (Adobe Analytics, October 2025). Globally the number is higher (around 60%, with APAC pulling the average up). Your own mix depends entirely on category: apparel and beauty brands often see 60 to 70% of revenue from mobile, electronics and home brands often see 35 to 45%.
is mobile bigger than desktop yet in us ecommerce?
Yes, narrowly, and for the first time outside a holiday peak. Adobe reported 51.4% of US online spend came from mobile in October 2025, up 11.6% YoY versus +8.2% for total online. Mobile crossed the 50% line and is widening the gap over the trailing year.
why is my mobile conversion rate so much lower than desktop?
Two structural reasons. Mobile sessions skew toward browsing and discovery (social referral, push notifications) so intent is lower per session. And mobile checkout has more friction (typing, smaller fields, distraction context). Industry mobile conversion runs around 1.9% versus desktop 3.6% across categories. The gap is widest in high-AOV categories like electronics and home where buyers want to compare specs on a bigger screen.
what is the mobile share by category, apparel versus electronics versus supplements?
Roughly: apparel 60 to 65%, beauty 55 to 60%, supplements 45 to 50%, food and CPG around 45%, home and furniture 35 to 40%, consumer electronics 30 to 40%. These are 2026 Eightx triangulations from Adobe (overall mobile share), Contentsquare (conversion gap by vertical), and category-level public-company data. Treat them as directional planning anchors.
should i build a mobile app if mobile is already 60% of my traffic?
Probably not at $5M. Probably yes at $50M+ if you have subscription or high-repeat-purchase economics. The math is simple: an owned app costs $30k to $100k a year to maintain (Tapcart, Shop, or similar) plus your team time. To break even you need it to lift mobile-revenue conversion by enough to clear those costs. Beauty, supplements, and subscription brands hit that math sooner. Apparel and electronics often don't unless the app drives genuine repeat behavior.
how does etsy's 46% mobile app gms share compare to what i should expect on shopify?
Different number, but useful directionally. Etsy's 46% is mobile APP only and excludes mobile web. A Shopify brand without a native app should be looking at total mobile (web + app) share, which for an apparel or beauty DTC is typically 55 to 70%. If you build a Tapcart or Shop app, expect 15 to 30% of mobile revenue to migrate into the app over 12 to 18 months if your brand has repeat behavior.
is the mobile share higher in the uk or eu versus the us?
Yes. UK mobile hit 61.5% of online revenue in the 2025 holiday season per Adobe UK (vs 51% US). Korea and China run even higher. The US is structurally lower because of higher desktop attach in B2B-adjacent ecommerce and lower mobile-app penetration. AU and CA track closer to the US than to the UK.
how do i narrow the mobile conversion gap to desktop?
Three plays that move the number. One, install a one-tap pay stack (Shop Pay, Apple Pay, Google Pay) and remove guest checkout friction. Two, simplify your PDP for mobile: hero image plus single-action buy button above the fold, accordion the rest. Three, run a real mobile-only A/B test on your top three landing pages. Mobile rarely catches desktop fully but closing half the gap (going from 1.9% to about 2.5 to 2.7%) is realistic in 90 days.