
Insights
Average ecommerce operating margin by revenue band 2026: 20 public DTC brands
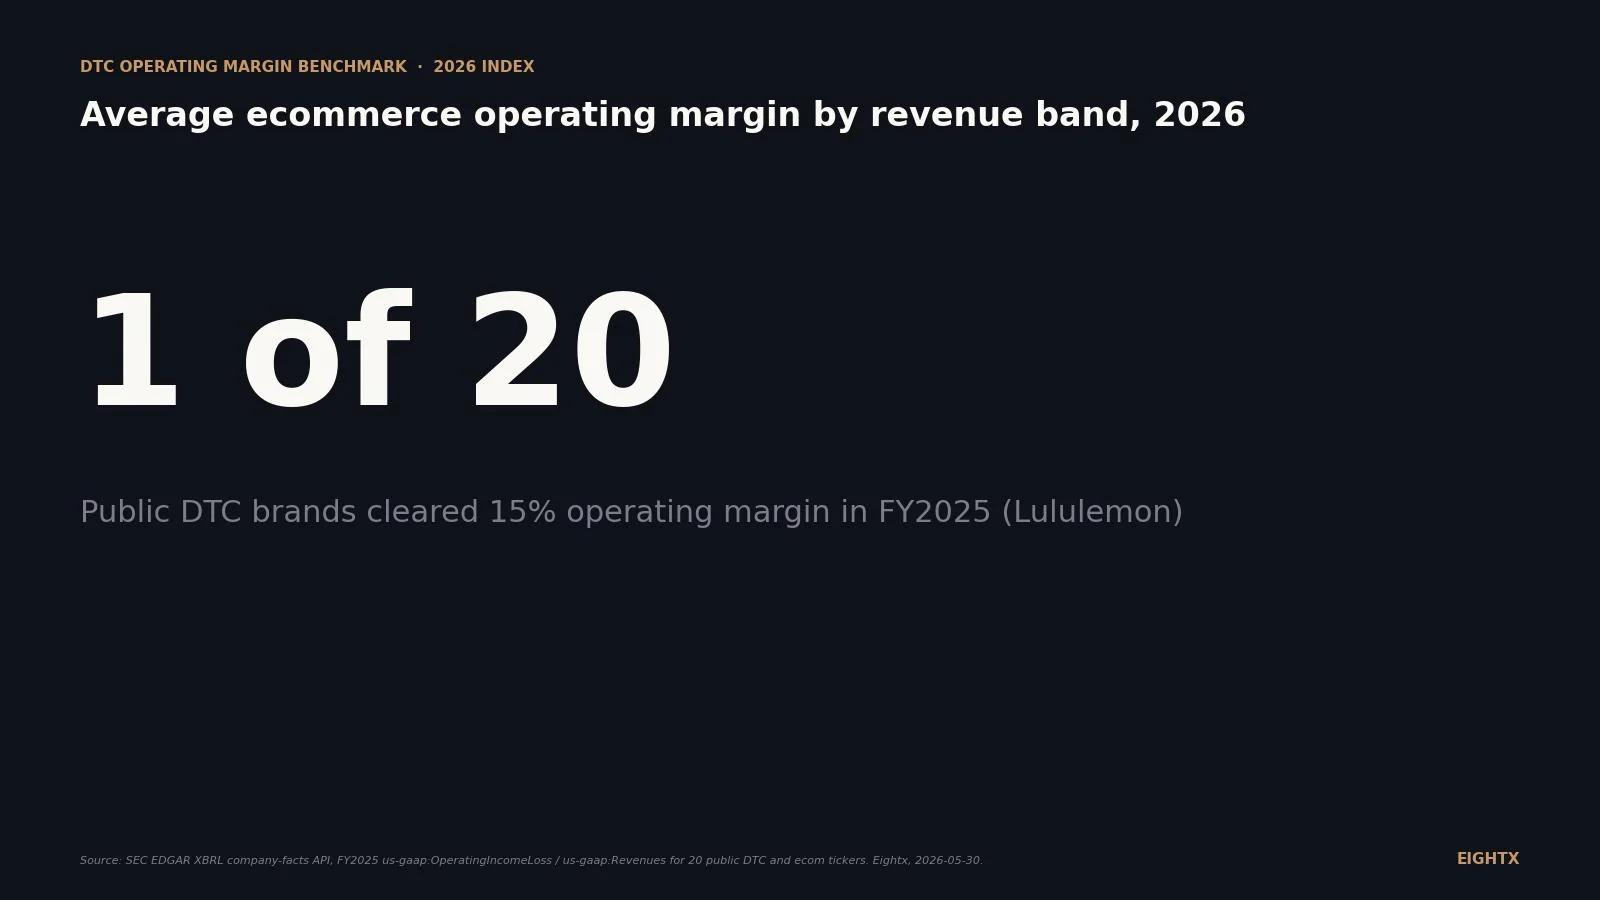
Median FY2025 operating margin across 20 public DTC and ecommerce brands is 2.9%, or 3.7% excluding Rent the Runway's rental-model drag. Only Lululemon clears 15%, and 7 of the 20 brands are negative. For private DTC operators, the takeaway is that positive operating margin at scale is not the norm: it is the exception earned by category dominance and disciplined SG&A management.
Key Takeaways
- Median FY2025 operating margin across 20 public DTC and ecommerce brands is 2.9%. The mean is negative 6.8%, dragged down by Rent the Runway's rental-model -131.3%; excluding RTR, the 19-brand mean is -0.3% and median is 3.7%. Only Lululemon (19.9%) clears 15%. Seven of 20 brands (35%) post negative operating income. Source: SEC 10-K filings, FY2025.
- Scale does not fix operating margin. Wayfair at $12.5B prints 0.1%. Chewy at $12.6B prints 2.0%. The $3B-plus band ranges from Lululemon 19.9% to Wayfair 0.1%, with an average of 5.9% and a median of 3.9%. Strip out Lululemon and the band average drops to 3.2%.
- The gross-to-operating leak is the real fight. Lululemon holds 56.6% gross to 19.9% operating: a 37-point leak, best in the dataset. FIGS leaks 60 points (66.5% gross to 6.0% operating) on heavy marketing. The brands that protect 30-plus points of gross profit margin down to operating are rare.
- 2026 OpEx headwinds are net negative. Retail trade wages up 3.3% YoY (BLS CES4200000003, April 2026). Warehousing wages up 4.1% YoY. Fed funds eased 170 bps from peak (5.33% to 3.63%) but rate relief lands below the operating line. Plan for modest operating margin compression in FY2026 absent specific action.
- Peloton is the 2-year recovery proof. Operating margin went from negative 42.7% (FY2023) to negative 1.5% (FY2025). A 41-point swing, driven by inventory writedown cycle ending and OpEx cuts. Scaled, money-losing DTC can rebuild operating margin in 24 months.
We pulled FY2025 operating-income data from 20 publicly-traded ecommerce and DTC brands, from Rent the Runway at $44M to Chewy and Wayfair at $12.6B and $12.5B. Sorted into four revenue bands, the data refutes the conventional "scale equals profit" story at the operating line. The median FY2025 operating margin across all 20 brands is 2.9%; the mean is negative 6.8%, dragged down by Rent the Runway's rental-model -131.3% print. Excluding RTR as a rental-revenue outlier (rental-asset depreciation runs through COGS), the 19-brand median is 3.7% and the mean is -0.3%. Only Lululemon (19.9%) clears 15%. Seven of 20 brands (35%) post negative operating income. The loss-makers cluster sub-$3B but extend into the largest band: Wayfair at $12.5B prints 0.1%, Chewy at $12.6B prints 2.0%. The driver is category, brand pricing power, and OpEx discipline. Not size.
For the sister read on the gross-margin side of this equation, see average ecommerce gross margin: Shopify vs Amazon. For the operating environment your OpEx is fighting, see the DTC macro pulse dashboard.
What 20 public ecom brands actually print at the operating line in 2025
Twenty tickers, four revenue bands, one operating margin column. The full roster sits below in a single reference table, then walked through.
Revenue band Company FY2025 revenue ($M) Operating margin (%) Under $500M Rent the Runway 43.8 -131.3 Under $500M Allbirds 152.5 -52.4 Under $500M Vera Bradley 269.7 -11.8 $500M-$1B FIGS 631.1 6.0 $500M-$1B Sweetgreen 679.5 -20.5 $500M-$1B Warby Parker 871.9 -0.6 $1B-$3B Torrid 1,000.1 2.1 $1B-$3B Revolve 1,225.7 6.1 $1B-$3B Stitch Fix 1,267.2 -3.1 $1B-$3B e.l.f. Beauty 1,636.5 4.5 $1B-$3B Dutch Bros 1,638.2 9.8 $1B-$3B YETI 1,868.5 11.4 $1B-$3B Peloton 2,490.8 -1.5 $1B-$3B Etsy 2,883.5 9.2 $3B+ Crocs 4,040.6 3.7 $3B+ Victoria's Secret 6,553.0 4.1 $3B+ Tapestry 7,010.7 5.9 $3B+ Lululemon 11,102.6 19.9 $3B+ Wayfair 12,457.0 0.1 $3B+ Chewy 12,601.5 2.0
Three patterns jump out. First, the distribution is bimodal at every band. The $1B-$3B band runs from YETI 11.4% and Etsy 9.2% beside Stitch Fix -3.1% and Peloton -1.5%. The $3B-plus band runs from Lululemon 19.9% to Wayfair 0.1%. Within-band variance dominates between-band variance. Second, the loss-makers cluster at the bottom of the size ladder but extend up: Rent the Runway, Allbirds, and Vera Bradley at sub-$500M, but also Stitch Fix at $1.27B and Peloton at $2.49B. Third, the 2 largest brands in the dataset (Wayfair $12.5B, Chewy $12.6B) print 0.1% and 2.0%, while the highest operating margin in the set comes from Lululemon at $11.1B. Scale by itself does not pick winners or losers.
The headline read is the median: 2.9% across all 20 brands, 3.7% if you exclude Rent the Runway's rental-model outlier. That is the number to anchor against when an operator asks "what should my operating margin be." It is not aspirational, it is what 20 scaled public DTC and ecom businesses actually print today. The 3.9% figure that gets cited elsewhere is the $3B-plus band median, not the full-set median; we surface both in the band table below so the cut is explicit.
The "scale fixes margin" story is mostly false at the operating line
Average operating margin by band tells the story.
Revenue band Brands (n) Average operating margin (%) Median operating margin (%) Under $500M 3 -65.2 -52.4 $500M-$1B 3 -5.0 -0.6 $1B-$3B 8 4.8 5.3 $3B+ 6 5.9 3.9 $3B+ ex-Lululemon 5 3.2 3.7
The band averages move in the right direction (negative 65.2% to 5.9%) but the journey is not linear and the destination is not impressive. Going from $1B-$3B (4.8% average) to $3B-plus (5.9% average) buys you 110 basis points of operating margin. Strip out Lululemon, and the $3B-plus band averages 3.2%, below the $1B-$3B band. The marginal operating margin improvement from $1B to $12B of revenue, ex-Lululemon, is negative.
The structural reason: at scale, you have absorbed more SG&A categories (corporate G&A, international ops, larger marketing org, real-estate footprint) than you have converted into gross-margin gains. The brands that beat the structural curve do it three ways: premium pricing power that holds gross margin (Lululemon 56.6% gross; YETI 57.4%), low-CAC community demand that compresses marketing line (Lululemon, YETI, Dutch Bros), and disciplined corporate cost growth (Lululemon's SG&A growth has trailed revenue growth in 3 of the last 4 fiscal years). The brands that miss have done the opposite: marketing as a percent of revenue that did not adjust to 2024-2025 CAC inflation (Allbirds, Sweetgreen, Stitch Fix), or acquisitions that bloated SG&A faster than they integrated (Tapestry's Capri-related charges, Crocs' HEYDUDE impairment).
For the operator at $10-150M revenue, this is the most important read in the dataset: do not plan your operating margin off a future revenue band. There is no "we will fix the margin when we hit $100M" trajectory in the public data. You fix operating margin by holding the gross margin and disciplining OpEx growth at every stage, or you do not fix it.
The gross-to-operating leak is the real fight
The single most actionable number in this dataset is the gross-to-operating-margin gap. Subtract operating margin from gross margin. That difference is your OpEx leak: marketing, SG&A, D&A, the lines between gross profit and operating income.
Company Gross margin (%) Operating margin (%) Leak (pts) Lululemon 56.6 19.9 36.7 (best discipline) YETI 57.4 11.4 46.0 Dutch Bros 25.9 9.8 16.1 (food-service model) Etsy 71.6 9.2 62.4 (R&D-heavy marketplace) Revolve 53.5 6.1 47.4 FIGS 66.5 6.0 60.5 (heavy marketing) Tapestry 75.4 5.9 69.5 (FY2025 deal-charge inflation) e.l.f. Beauty 70.7 4.5 66.2 Victoria's Secret 36.4 4.1 32.3 Crocs 58.3 3.7 54.6 (incl. impairment) Torrid 34.8 2.1 32.7 Chewy 29.8 2.0 27.8 Wayfair 30.2 0.1 30.1 Warby Parker 54.0 -0.6 54.6 Peloton 50.9 -1.5 52.4 Stitch Fix 44.4 -3.1 47.5 Vera Bradley 46.4 -11.8 58.2 Sweetgreen 38.0 -20.5 58.5 (food-service convention) Allbirds 41.0 -52.4 93.4 (sub-scale)
The pattern: leaks under 40 points are rare (Lululemon, Dutch Bros, Chewy, Wayfair, Victoria's Secret, Torrid), and most of them either have low gross-margin bases to start (Chewy 29.8%, Wayfair 30.2%, Victoria's Secret 36.4%, Torrid 34.8%) or food-service-anchored cost structures (Dutch Bros). The only brand in the dataset with a high-gross-margin base AND a tight leak is Lululemon. That combination is what produces the 19.9% top-of-table operating margin.
Apparel and accessories brands with 50-plus point gross margins generally leak 50-plus points to OpEx (FIGS 60.5, Crocs 54.6, Warby Parker 54.6, Peloton 52.4). Beauty and specialty marketplace brands with 70-plus point gross margins leak even more (Etsy 62.4, e.l.f. Beauty 66.2, Tapestry 69.5). The structural reason is the same: when your category supports a 60-75% gross margin, you almost always pay it back in marketing, R&D, or store-occupancy lines.
What separates the winners is OpEx discipline at scale. Lululemon's marketing as a percent of revenue has been measurably lower than Nike's, Allbirds', or Stitch Fix's for the last 5 years; YETI's wholesale channel mix holds SG&A growth below revenue growth most quarters. Dutch Bros' unit-level food-service economics absorb G&A across rapid same-store growth. These are choices, not byproducts of scale.
For the operator at $10-150M revenue, the read is: compute your own gross-to-operating leak this week. Take your trailing twelve-month gross margin, subtract your operating margin. If the leak is over 50 points, your operating margin problem is OpEx, and almost certainly marketing as the single biggest line. If the leak is under 30 points, your problem is gross margin. The fix is different in each case and the gross-to-operating diagnostic tells you which.
2026 OpEx headwinds: wages up, rates down, net effect modestly negative
Two BLS series sit directly on your SG&A line.
Period Retail AHE ($/hr) Warehousing AHE ($/hr) YoY retail YoY warehousing 2024-Jan 24.24 31.02 +3.0% +3.6% 2024-Jul 24.44 31.38 +2.1% +1.4% 2025-Jan 24.97 31.75 +3.0% +2.4% 2025-Jul 25.52 32.21 +4.4% +2.6% 2026-Jan 26.08 33.15 +4.4% +4.4% 2026-Apr 26.11 33.25 (Mar) +3.3% +4.1%
Retail trade wages are running 3.3% YoY in April 2026. Warehousing and storage wages are running 4.1% YoY in March 2026. Both are above the Fed's 2% inflation target. If your SG&A line tracks the BLS supersector for retail labor (which it does for any brand with retail headcount or fulfillment employees), you are baking in 3-4% labor inflation for FY2026 regardless of revenue trajectory.
The Federal Funds rate eased 170 basis points from peak: 5.33% in August 2024 to 3.63% in May 2026 (FRED DFF). That helps interest expense, which lands below operating income. The line that gets relief is net income, not operating income. If you carry $20M of debt at a 200 bps margin over Fed funds, your interest expense drops roughly $340K per year on the 170 bps move. That is real for net margin. It does not change your 2026 operating-margin plan.
Net effect: plan FY2026 operating margin to compress 50-100 basis points absent specific OpEx action. Wages alone account for 80-150 bps of pressure on a typical $20-50M brand where labor sits at 15-25% of revenue. Brands that hold or improve operating margin in FY2026 will do it through marketing optimization (lower CAC per unit, not higher CAC budget), price increases that the category supports, or G&A automation.
What this means if you're a private brand at $10M-$150M
The public dataset is not your peer set for absolute level, but it is your peer set for trajectory and OpEx discipline.
For absolute level, use the private panel benchmarks. Hycos 2026 puts median DTC net margin at 3-10%, with top-quartile beauty and supplements operators hitting low-teens EBIT at $50-150M. Storehero and other vendor panels triangulate to similar bands. Across our own Eightx client base at $5-20M, the working numbers are: 5-8% EBIT is stage-appropriate at $10M; 8-12% is top quartile at $25M; 12-18% is top quartile at $100M.
For trajectory and OpEx structure, the public peer set is the most useful comparison available because the data is auditable. Three operator decisions follow.
Decide which gross-to-operating leak benchmark you are anchoring against. If you are an apparel brand at $15M with 55% gross margin and 0% operating margin (55-point leak), Lululemon's 37-point leak is your aspirational discipline target and Stitch Fix's 47-point leak is your warning. If you are a beauty brand at 70% gross margin, the relevant ceiling is e.l.f.'s 66-point leak and the warning is FIGS' 60-point leak. The peer set you compare to depends on your gross-margin base, not your revenue.
Decide whether your operating margin gap is a CAC problem, an SG&A bloat problem, or a category-ceiling problem. CAC problem: marketing as a percent of revenue rose 200-plus bps over the last 2 years and gross margin held. Fix is in the marketing mix. SG&A bloat: corporate headcount, real-estate footprint, or platform tooling grew faster than revenue. Fix is org and vendor consolidation. Category-ceiling: gross margin is structurally below 30% (Chewy, Wayfair, Dutch Bros). Operating margin ceiling is built in; the play is to compete on share, not margin.
Look at Peloton's 2-year recovery as the playbook for scaled, money-losing DTC. Operating margin went from -42.7% (FY2023, on $2,800M revenue) to -1.5% (FY2025, on $2,491M revenue). A 41-point swing. Revenue declined 11% over the same window. The mechanism: inventory writedown cycle ended (gross margin recovered from low-double-digits to 50.9%), and OpEx absolute dollars dropped roughly 15% on real headcount cuts. Operating margin can be rebuilt in 24 months even when revenue is declining, if the gross-to-operating leak is the target and OpEx absolute dollars come out. That is a more useful playbook than "wait for scale to fix it."
Median operating margin across 20 scaled public DTC brands is 2.9% (3.7% ex-Rent the Runway). Only one of 20 clears 15%. Scale does not fix the metric. The gross-to-operating leak does. Compute your own leak this week, compare it to the peer set in this post, and pick the OpEx line that closes the gap.
How to use these benchmarks this quarter
Three reads to do this week.
Read your operating margin against your gross-margin peers, not your revenue peers. If you run 55-60% gross margin, Lululemon, FIGS, Crocs, and Peloton are your peer set. If you run 65-75%, Etsy, e.l.f., and Tapestry are. If you run sub-35%, Chewy, Wayfair, and Victoria's Secret are. The operating-margin ceiling for your business is set by where the best brand in your gross-margin band lands, not by the brand at your revenue.
Compute your gross-to-operating leak and rank yourself in the table above. If you are above the median leak for your gross-margin band, your problem is OpEx. If you are below, your problem is gross margin. The fix is different.
Plan FY2026 operating margin assuming 50-100 bps of compression headwind. The BLS wage data is leading. The Fed cuts land below the operating line. If you target flat operating margin year-on-year for FY2026, you are implicitly committing to OpEx-line action: marketing efficiency, headcount discipline, vendor consolidation, or price.
For the operator at $5-20M who wants to stress-test the math against current Fed funds and DTC cost-of-capital benchmarks, our fractional CFO services for ecommerce brands team runs this read as the first 30 minutes of a working session. For the public-peer trajectory cut on the next 8 quarters of public DTC results, see the DTC layoff and hiring tracker for the headcount side of the OpEx story.
Sources and methodology
company annual reports filed with the SEC. We pulled FY2025 fiscal-year data for 20 public DTC and ecommerce tickers via the company annual reports filed with the SEC (https://www.sec.gov/edgar). XBRL tags used: Revenues (or RevenueFromContractWithCustomerExcludingAssessedTax where present), OperatingIncomeLoss, and GrossProfit. Operating margin is computed as OperatingIncomeLoss divided by Revenues, with both numbers taken from the same fiscal-year filing.
Tickers retained (20). RVLV (Revolve), FIGS, WRBY (Warby Parker), ETSY, CHWY (Chewy), W (Wayfair), LULU (Lululemon), YETI, PTON (Peloton), BROS (Dutch Bros), BIRD (Allbirds), TPR (Tapestry), CROX (Crocs), SFIX (Stitch Fix), VSCO (Victoria's Secret), CURV (Torrid), VRA (Vera Bradley), RENT (Rent the Runway), ELF (e.l.f. Beauty), SG (Sweetgreen). On Holding (ONON) and Birkenstock (BIRK) were excluded because they file under IFRS-full taxonomy and the XBRL Frames API returned empty values for our tags. Both are logged for a v2 refresh.
Revenue band definition. Sub-$500M (3 inclusions: RTR, BIRD, VRA, with RTR flagged as a rental-model outlier). $500M-$1B (3: FIGS, SG, WRBY). $1B-$3B (8: CURV, RVLV, SFIX, ELF, BROS, YETI, PTON, ETSY). $3B-plus (6: CROX, VSCO, TPR, LULU, W, CHWY).
Fiscal year alignment. Calendar 2025 used wherever fiscal year ends December 31 (RVLV, FIGS, WRBY, ETSY, W, YETI, BIRD, CROX, VRA, BROS, SG). For brands with non-calendar fiscal years, we used the fiscal year ending closest to the 2025-2026 calendar cycle (LULU 2026-02-01, CHWY 2026-02-01, PTON 2025-06-30, TPR 2025-06-28, SFIX 2025-08-02, VSCO 2026-01-31, CURV 2026-01-31, ELF 2026-03-31). Fiscal-year misalignment is the largest single source of comparability noise in this dataset; we treat the band aggregates as directional rather than point-precise.
BLS CES series. Retail trade average hourly earnings: CES4200000003, seasonally adjusted. April 2026 = $26.11 (preliminary), up 3.3% year-on-year. Warehousing and storage average hourly earnings: CES4348400003, seasonally adjusted. March 2026 = $33.25 (preliminary), up 4.1% year-on-year. Both series pulled from January 2023 through the latest available point via the BLS public API.
FRED Effective Federal Funds Rate. Series DFF, monthly. Peak August 2024 = 5.33%. May 2026 = 3.63%. Total ease of 170 basis points over 21 months. Rate change affects interest expense below the operating-income line; we surface it for completeness but it is not a driver of FY2026 operating margin.
Private panel triangulation. For the private $1M-$150M operator read, we cross-reference Hycos 2026 ecommerce benchmarks (median DTC net margin 3-10%, top-quartile beauty and supplements operators at low-teens EBIT at $50-150M), and the Storehero 2026 DTC profitability tracking guide (similar bands). Private Shopify panels run 10-25 gross-margin points higher than public 10-K equivalents at every revenue tier (Hycos, Eightx prior posts), but operating margins compress to similar bands once SG&A is fully loaded.
Limitations. Public 10-K filings consolidate DTC and wholesale revenue inside one operating margin; pure-DTC operating margin is typically 100-300 bps different from blended for hybrid brands. Operating-income definition varies by issuer: Crocs FY2025 includes a large impairment charge on HEYDUDE goodwill; Tapestry FY2025 includes Capri-acquisition-related charges; Lululemon includes restructuring charges. Like-for-like requires reading the MD&A; the band aggregates are directional. The sample skews apparel and accessories (12 of 20). Marketplace, furniture, food-service, and beauty are 1-2 observations each. Private DTC at $10M-$150M is not in the SEC dataset; we triangulate via the 2026 private panels named above.
Update cadence. This index is refreshed quarterly as new 10-K filings land and BLS wage data refreshes. Next update target: August 2026 (Q2 earnings season close + BLS July data release).
Frequently asked questions
what's a good operating margin for a $10m dtc brand?
Honest answer: anywhere from 0% to 8% puts you in the typical band. The Hycos 2026 panel puts median private DTC at 3-10% net margin, with EBIT roughly the same for asset-light DTC. The public 10-K dataset does not include $10M brands because they are too small, so you cannot directly benchmark against a public peer. The working number we use with clients: 5% EBIT is a stage-appropriate target at $10M, 8-12% is top quartile. Below 0% is fine for one or two quarters if you are intentionally reinvesting, not fine for four.
does my operating margin actually get better as i scale to $50m or $100m?
Not automatically. The public 10-K data refutes the scale-fixes-margin story at the operating line. Wayfair at $12.5B prints 0.1%. Chewy at $12.6B prints 2.0%. The $3B-plus band ranges from Lululemon 19.9% to Wayfair 0.1%. What scales is your revenue base, not your operating margin. The operators who get to 12-18% EBIT at $50-150M do it by holding gross margin and keeping OpEx growth slower than revenue, not by waiting for scale to fix the metric.
why does lululemon print 20% operating margin and wayfair only 0.1%?
Two reasons, and the order matters. First, the gross-margin ceiling. Lululemon runs 56.6% gross vs Wayfair 30.2%. Wayfair sells furniture through a marketplace structure with thin take-rate economics. When your category caps you at 30% gross, even a tight 30-point OpEx leak burns the whole margin and leaves 0.1% at the operating line. Lululemon's 37-point leak on a 56.6% gross base still leaves 19.9%. Second, OpEx discipline at the leak. Lululemon's gross-to-operating leak is 37 points, the best in the dataset; Wayfair's is 30 points, also disciplined, but disciplined OpEx on a low-gross-margin base is not enough. Category sets the ceiling; OpEx discipline determines how close you get to it; the floor under that combination is what shows up at the operating line.
is breakeven operating margin acceptable for a growth-stage dtc brand in 2026?
Yes, for a defined window. The 2026 CAC environment (up 40-60% vs 2021 per Hycos) makes 0% EBIT the realistic baseline for any brand still investing aggressively in acquisition. The honest test: is your contribution margin (gross profit minus variable marketing) positive and growing? If yes, 0% EBIT is a reinvestment choice. If no, you are not at breakeven, you are at structural unprofitability and need to change the marketing mix. Across our client base the brands that break the curve at $5-20M almost always have CM3 above 20%.
how do i know if my operating-margin problem is a gross-margin issue or an opex issue?
Compute your gross-to-operating leak. Take your gross margin, subtract your operating margin. Compare against the public 10-K leaderboard in this post. Lululemon: 37 points (best). Median apparel brand in this dataset: 50-plus points. If your leak is below 30 points, your problem is gross margin. If your leak is over 50 points, your problem is OpEx, almost certainly marketing as the biggest single line. The fix is different in each case.
should i benchmark against public 10-k operating margins or private shopify panels?
Both. The public 10-Ks (this post) anchor the ceiling and floor at scale. The private panels (Hycos median 3-10% net) anchor the typical private band. Your gross margin tracks the private panels (Shopify-first brands run 10-25 gross-margin points higher than public 10-K equivalents). Your operating margin tracks the public 10-Ks because OpEx leak is universal once SG&A is fully loaded. Read both, use the gap.
why are so many public dtc brands operating at a loss in 2026?
Three structural reasons. First, the 2021-2022 cohort raised aggressively, built overhead, and is still right-sizing (Allbirds, Sweetgreen, Stitch Fix, Peloton). Second, CAC compression: the cost to acquire a customer is up 40-60% since 2021 (Hycos), and the loss-makers' marketing lines have not adjusted. Third, sub-scale fixed overhead: Vera Bradley at $269.7M and Rent the Runway at $43.8M cannot spread their G&A across enough revenue. The pattern is concentrated at the bottom of the size ladder, but Wayfair's 0.1% on $12.5B shows scale is not the universal cure.
what operating margin do i need to actually pay myself and reinvest?
For a $5-20M private DTC, the working math is roughly 8-12% EBIT to cover a founder salary at market rate (Eightx founder-salary-reality-check post sets that at $180-280K) plus 3-5% of revenue reinvested back into growth or inventory. Below 8% EBIT, one of those two has to give: either you underpay yourself or you do not reinvest. The brands that report near-breakeven publicly (Warby Parker -0.6%, Chewy 2.0%, Wayfair 0.1%) are absorbing scale costs and reinvestment ahead of operator pay. That works for a public company funded by capital markets and is structurally hard for a private operator without outside capital.
why did crocs go from 25% to 4% operating margin in one year?
Crocs' FY2025 includes a large impairment charge tied to the HEYDUDE acquisition's goodwill, plus higher SG&A. Strip the one-time charge and underlying run-rate is closer to 20%. This is why we footnote it in the leaderboard. The lesson for operators: a single-year operating margin print can swing 20-plus points on one impairment, restructuring charge, or acquisition-related expense. Always check the MD&A before reading a single-year number as a trend.