
Insights
Subscription revenue share by ecommerce vertical 2026: pet 83%, food 22%, beauty 9-15%
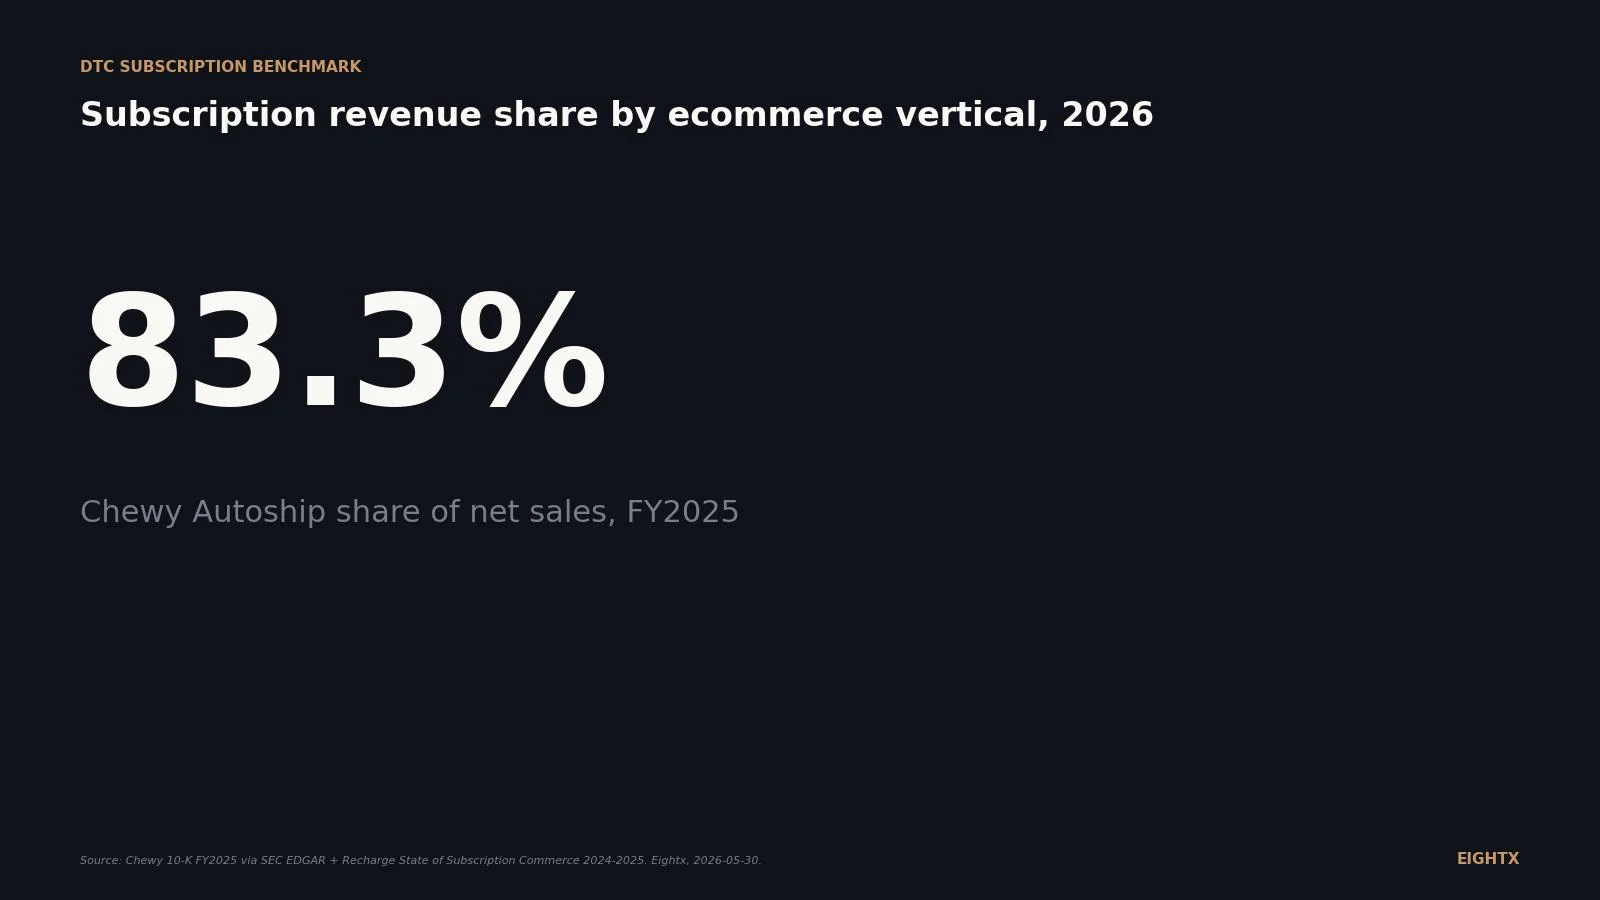
Chewy Autoship reached 83.3% of net sales in FY2025, the highest disclosed subscription share among public DTC brands. Recharge data puts food and beverage at 22% of subscription GMV. Beauty programs typically run 9 to 15% subscription share. The benchmark is a ceiling set by replenishment frequency and commodity intensity, not by program quality. Apparel and home will rarely approach pet or supplements.
Key Takeaways
- Chewy Autoship customer sales reached 83.3% of net sales in fiscal 2025 ($10.50B of $12.60B), up from 79.2% the year prior. That is the public-company ceiling for consumables DTC and the de-facto benchmark for any pet or CPG brand pitching an exit.
- Hims & Hers ended FY2025 at an estimated 90-97% subscription mix on $2.35B revenue (2.51M year-end subscribers; ~$83 monthly ARPU is a year-end figure, not blended). Wellness and telehealth is the highest-mix vertical we can observe in public filings.
- Recharge State of Subscription Commerce 2024-2025 puts food & beverage at 22.45% of subscription-ecommerce revenue, the single largest vertical slice. Health/wellness and beauty are the fastest YoY gainers.
- Peloton subscription is only 29.2% of segment revenue but ~67% of gross profit dollars. The razor-blade signal: hardware breaks even, subscription is the actual business.
- Most private $5-50M DTC brands run 10-20 points light on subscription mix versus their public comp. Closing that gap is the cheapest way to add a turn to your exit multiple.
Subscription revenue share is one of the most reliable predictors of DTC enterprise value at exit. It dictates lifetime value (LTV), customer acquisition cost (CAC) payback, working-capital intensity, and the multiple your acquirer is willing to pay. But there is no consensus benchmark for "what good looks like" by vertical, so most operators benchmark against whatever Recharge published last or whatever AG1 said on a podcast. This page collects the FY2025 disclosures from public DTC and subscription-led companies (Chewy, Hims & Hers, Peloton, BARK, Stitch Fix, LifeMD, FIGS, Solo Brands) and stacks them against the Recharge State of Subscription Commerce category data, so you can see the real range for your vertical and where you sit inside it.
What "subscription revenue share" actually means (three definitions, three numbers)
The first reason operator benchmarks are messy is that there are at least three different ways "subscription share" gets reported, and they are not the same number.
The first is gross merchandise share, used by Recharge and the rest of the subscription-platform vendors. This is the share of subscription-ecommerce GMV (gross merchandise value, the total transaction volume before refunds and chargebacks) that falls into a given vertical. It tells you how big a slice of the subscription pie your category owns. The Recharge data: food and beverage 22.45%, then health and wellness, beauty, household and pet, apparel.
The second is reported subscription-line-item share, which is how Peloton, Hims, LifeMD, and most software-style consumer companies report. They break out a "Subscription revenue" line in the 10-K and you divide by total revenue. Peloton's number is clean: $547.9M of $1,876.7M segment revenue is 29.2%. Hims is fuzzier: the company describes "the majority of online revenue" as subscription-based without giving an exact percentage.
The third is Autoship-customer-sales share, which is the way Chewy reports. Chewy's Autoship customer sales were 83.3% of net sales in fiscal 2025. The catch: that number includes one-time, non-subscription orders that Autoship customers place. So Chewy's "subscription revenue" is technically lower than 83.3% by some amount the company has never disclosed, but Autoship-customer-sales share is the public proxy.
When you benchmark your own subscription mix, pick one definition and stick to it. We use subscription-billed revenue divided by total net sales because that's the number an acquirer's quality-of-earnings analyst will calculate when they diligence you.
The vertical-by-vertical benchmark from public DTC filings
Eight public companies disclose enough subscription data to triangulate a benchmark for the verticals private operators actually care about: pet, wellness, beauty (no pure-play public yet), food and beverage, apparel, and lifestyle.
The chart ranks subscription share of revenue for the eight FY2025 disclosures we could pull. Two numbers are exact (Chewy 83.3%, Peloton 29.2%); the other six are Eightx estimates synthesized from disclosure language in the relevant 10-Ks.
Company Ticker Vertical Total revenue FY2025 Subscription metric disclosed Subscription share Chewy CHWY Pet $12.60B Autoship customer sales: $10.50B 83.3% (disclosed) Hims & Hers HIMS Wellness / Telehealth $2.35B 2.51M year-end subscribers; ~$83/mo year-end ARPU; "majority of online revenue" 90-97% (Eightx estimate; range, not point) Peloton PTON Connected fitness ~$2.71B Subscription revenue: $547.9M 29.2% segment share (disclosed) BARK BARK Pet $484.2M DTC revenue $415.8M (BarkBox + Super Chewer); subscription is a subset of DTC 60-65% (Eightx estimate) LifeMD LFMD Wellness / Telehealth ~$220M Subscription-based telehealth model ~90% (Eightx estimate) Stitch Fix SFIX Apparel ~$1.34B 2.31M active clients; Fix + Freestyle reorder ~55% (Eightx estimate) FIGS FIGS Apparel / Scrubs $631.1M Replenishment-driven (no separate subscription line) ~15% (Eightx estimate) Solo Brands SBDS Outdoor / Lifestyle $316.6M DTC declining; subscription not disclosed ~5% (Eightx estimate)
The pattern that matters for private operators: vertical sets the ceiling, business design sets the floor. Pet and wellness can support 60-97% subscription mix because the product is consumable and the customer commitment is monthly. Apparel and lifestyle top out at 50-60% (Stitch Fix) because the offer is a styling fix, not a replenishment. Connected fitness sits at 29% segment share because the hardware revenue is the bigger line item, even though the subscription is where the profit actually lives.
What Recharge data says about subscription ecommerce as a category
Recharge processes a large share of first-party subscription transactions on Shopify (the dominant DTC platform) so its State of Subscription Commerce report is the closest thing the industry has to a benchmark for category share of subscription GMV.
The headline: food and beverage owns 22.45% of subscription-ecommerce revenue, the single largest vertical slice. Health and wellness is roughly 18%, beauty and personal care around 15%, household and pet around 12%, apparel around 8% (22.45% is the verbatim disclosed Recharge figure; the other splits in this paragraph and Chart 2 are Eightx estimates from Recharge directional commentary). The "Other" bucket at ~25% sweeps up supplements (which Recharge splits inconsistently between health/wellness and food and beverage), home goods, hobby kits, and the long tail of niche subscription verticals.
The trend Recharge calls out: health and wellness plus beauty and personal care are the fastest YoY revenue growers from 2023 to 2024. Pet retains the best retention and customer lifetime value (CLV) but is no longer the fastest growing on a percentage basis because penetration is already high. That matches what we see in client portfolios: a $20M beauty brand can grow subscription faster than a $20M pet brand because pet penetration is closer to a ceiling.
Vertical Public-company benchmark (subscription % of revenue) Typical private DTC range Recharge category share of GMV Pet & pet food 83% (Chewy Autoship) 35-65% ~12% Wellness / telehealth 90-97% (Hims est.); ~90% (LifeMD est.) 50-80% ~18% Supplements (CPG) ~100% (AG1, private) 25-50% part of health/wellness Beauty & personal care N/A (no pure-play public) 10-25% ~15% Food & beverage / meal kit N/A 15-35% 22.45% Coffee N/A 30-60% part of food & bev Apparel & subscription box ~55% (Stitch Fix) 5-20% ~8% Connected fitness / hardware 29% segment (Peloton) N/A N/A
Chewy is the proof-point: 68% to 83% in six years
If you want one chart to show your board why subscription mix expansion is worth the operational pain, it is the Chewy Autoship trajectory.
Chewy Autoship customer sales went from roughly 68% of net sales in fiscal 2019 to 83.3% in fiscal 2025. That is roughly 250 basis points of subscription-share expansion per year, every year, including through the 2022-2023 consumables price-shock that broke a lot of subscription cohorts. Chewy did it by leaning into Autoship onboarding (the second-purchase incentive), expanding the Autoship eligible SKU base, and building out auto-replenishment for high-frequency categories like pet food and litter.
The lesson for private operators: subscription-share expansion is a multi-year operational project, not a quarterly initiative. The Chewy curve is roughly linear, which means roughly the same tactics roughly the same amount of effort, applied roughly forever. The brands that hit the public-company benchmark do it because they treat subscription mix as a P&L line they own, not a marketing experiment that runs in Q4.
Why your private DTC subscription mix probably looks 10-20 points light
When we diligence a private DTC brand at $5-50M revenue, the subscription mix is almost always 10-20 percentage points below the public comp for its vertical. Pet brands at 50% versus Chewy's 83.3%. Beauty brands at 8% versus the 15-25% range Recharge implies. Wellness brands at 35% versus Hims's estimated 90-97%.
There are four reasons for the gap, and three are fixable.
First, founder-led brands underweight subscription onboarding because the first-time purchase is the dopamine hit and the team optimizes there. The repeat playbook is the harder, slower compound that gets pushed to "next quarter" for two years.
Second, most private brands offer the subscription discount as 5-10% off, which is not enough to overcome the activation friction. Public companies that crack subscription mix offer 15-25% off the first order or month, then taper. The math works because the LTV expansion more than pays for the first-order margin compression.
Third, subscription-only SKUs do not exist in most private brand catalogs. Hims sells GLP-1 protocols only on subscription. AG1 sells AG1 only on subscription. Most private brands let the customer choose subscription or one-time on every SKU, which means a meaningful fraction of subscription-eligible buyers default to one-time.
Fourth, churn is structurally higher in private brands because the onboarding sequence stops at the welcome email. The brands that hit 30%+ subscription mix run a 30-90 day onboarding flow specifically designed to get the second shipment to ship before the customer churns.
Why this matters for your business: a private DTC brand at $20M revenue with 15% subscription mix is worth roughly 1.5-2.0x revenue at exit. The same brand at $20M with 35% subscription mix is worth roughly 2.5-3.5x. Subscription-mix expansion is the cheapest valuation lever in the business because the channel and the customer base already exist. You are not buying new traffic; you are converting traffic you already have.
The playbook to push subscription from 10% to 30% in 12 months
We have run this with enough portfolio brands now that the sequence is predictable. The order matters more than any individual tactic.
Month 1-2: instrument the baseline. Pull subscription revenue, one-time revenue, subscription monthly churn, second-shipment ship rate, and subscription AOV. If you cannot pull these five metrics by SKU and by cohort, fix that first. Most brands are running blind on subscription unit economics because the Shopify default reporting buckets subscription orders with one-time.
Month 2-3: redesign the offer. Add 15-20% off the first subscription order (not 5%). Make subscription the default checkout option on consumables PDPs with a one-time toggle. Build a "skip, swap, or pause" UX before "cancel" in the subscriber portal. The cancel button still has to exist, but it cannot be the only option above the fold.
Month 3-6: launch the onboarding sequence. A 30-day flow that lands four touchpoints: welcome (day 0), product-use education (day 7), social-proof or community moment (day 14), and a check-in before the second shipment ships (day 25-28). The goal is to get shipment two to ship. Once shipment two ships, churn drops by 30-50%.
Month 6-9: launch subscription-only SKUs or bundles. One or two products that cannot be bought one-time. This creates a lock-in moment for power buyers and pulls subscription-eligible customers off the one-time SKU. It also creates a higher-margin subscription tier you can price test.
Month 9-12: lock in retention. Run a quarterly value moment for active subscribers (free product, content drop, early access). Build a churn-prediction model on the subscription portal data (skip behavior, customer support tickets, product-feedback signal). Intercept at-risk subscribers with a save offer before they cancel.
Most brands that run this sequence hit 25-30% subscription mix by month 12 from a 10-15% start. The brands that fail usually fail at month 2: they cannot agree to take the 15-20% first-order discount because the founder is loss-averse on the margin hit. The math on that is wrong (LTV expansion pays for it 3-5x) but the politics is real.
Subscription revenue share is the cheapest valuation lever in your DTC business. The public comps for your vertical set the ceiling. The gap between you and the ceiling is the easiest 0.5-1.0 turn you can add to your exit multiple. Most $10-50M private brands are leaving it on the table because subscription is treated as a marketing initiative, not a P&L line the CFO owns.
What we're watching next
The next Recharge State of Subscription Commerce update lands in Q3 2026 and we'll refresh the vertical-share data when it does. The Q1 2026 10-Q filings from Chewy, Hims & Hers, Peloton, and BARK will tell us whether the Autoship trajectory keeps climbing (Chewy guidance implies 85%+ by FY2027) and whether Hims's subscriber growth survives the GLP-1 supply normalization. The third signal to watch is Amazon Subscribe & Save category share: if it keeps bleeding versus first-party subscription, that is bullish for any DTC brand investing in Recharge, Stay AI, or Skio.
For more on how subscription unit economics interact with the rest of your P&L, see our average subscription churn rate by category benchmark and our fractional CFO services for ecommerce brands overview.
Sources and methodology
SEC EDGAR Form 10-K filings, FY2025. We pulled subscription disclosures from eight public companies for the most recent fiscal year ending between June 2025 and February 2026. Chewy (CIK 0001766502) reported Autoship customer sales of $10.50B against net sales of $12.60B in its FY2025 10-K, which is 83.3% (compared to 79.2% the year prior). Hims & Hers (accession 0001773751-26-000022, filed 2026-02-23) reported 2.51M year-end subscribers FY2025 with ~$83 monthly ARPU (also year-end) on total revenue of $2.35B and online channel of ~98.5% of revenue; the company describes "the majority of online revenue" as subscription, which we treat as a 90-97% range. Note the simple ARPU × subscribers × 12 math (2.51M × $83 × 12 = $2.50B) overshoots disclosed total revenue, which confirms 2.51M is the year-end snapshot and blended-average subscriber count for FY2025 is materially lower. Peloton's FY2025 10-K (filed 2025-08-07, period ending June 30, 2025) reported Subscription revenue of $547.9M against Connected Fitness Products of $1,328.8M. BARK's FY2025 10-K (accession 0001819574-25-000024) reported DTC revenue of $415.8M against total revenue of $484.2M; subscription is a subset of DTC (BARK has wholesale and one-time DTC purchases mixed in), so we estimate BarkBox + Super Chewer subscription at 60-65% of total revenue rather than the full 86% DTC share.
Recharge State of Subscription Commerce 2024-2025. Recharge publishes an annual report on subscription-ecommerce GMV and category mix. Food and beverage share at 22.45% is the headline figure from the 2024 edition. The vertical splits in our Chart 2 are Eightx estimates from Recharge directional commentary; the gated PDF report contains the verbatim category breakdown. Recharge data covers first-party subscription on Shopify and Shopify-adjacent platforms, which makes it the closest available proxy for the DTC subscription universe but it understates Amazon Subscribe & Save and standalone subscription platforms.
eMarketer / Insider Intelligence Amazon Subscribe & Save data. Penetration for participating CPG sellers ranges from 20-35% of Amazon sales. eMarketer reported in 2024 that Subscribe & Save lost share in 9 of the top 10 CPG categories year-over-year, which we treat as evidence that first-party subscription is taking share from Amazon-managed subscription.
foundrycro.com 2026 DTC supplements benchmarks. Subscription churn ranges of 5-8% monthly for vitamins and 12-18% monthly for meal kits are sourced from foundrycro.com aggregated cohort data. We use these to set the floor on subscription mix expectations by vertical because higher churn forces higher one-time mix to backfill revenue.
Disclosure on Eightx estimates. Six of the eight subscription-share figures in Chart 1 (Hims 90-97%, LifeMD ~90%, BARK 60-65%, Stitch Fix ~55%, FIGS ~15%, Solo Brands ~5%) are Eightx estimates synthesized from disclosure language in the relevant 10-Ks. Only Chewy (83.3%) and Peloton (29.2%) are exact-disclosed. The FY2019-FY2023 points on Chart 3 are Eightx estimates from year-over-year directional disclosures in Chewy MD&A; FY2024 (79.2%) and FY2025 (83.3%) are exact. We flag these in the chart captions and in the data tables.
Update cadence. This page is a living index refreshed quarterly when Recharge and the bulk of public-company 10-Qs land together. Next update target: Q3 2026 (post-Recharge 2026 report release and Q2 10-Q filings).
Frequently asked questions
what percent of revenue should be subscription for my dtc brand?
It depends on your vertical, but the public comps say: pet 60-83%, wellness/telehealth 90%+ (estimated range), food and beverage 15-35%, beauty 10-25%, apparel 5-20%. If you are a consumables brand under 30% subscription mix, you are leaving valuation on the table because acquirers pay a higher multiple for recurring revenue.
how does my subscription mix compare to chewy or hims?
Chewy at 83.3% Autoship and Hims at an estimated 90-97% are the ceiling, not the average. They are the public-company benchmark for consumables and telehealth. Most private DTC brands we work with at $5-50M revenue run 10-20 points light versus the public comp for their vertical.
is 20% subscription revenue good or bad for a beauty brand?
It is roughly average. Recharge data puts beauty and personal care at 15% of subscription-ecommerce GMV and we see private beauty brands run 10-25% subscription mix. Good is 25-35%. To get there you need a replenishment offer, a meaningful first-order discount, and onboarding that gets the second shipment to ship before the customer cancels.
what's the subscription revenue share for supplements vs coffee vs food?
Supplements run 25-50% private and up to ~100% for single-SKU brands like AG1 (reported ~$600M annually on one $79 monthly subscription; AG1 is private and the figure is press-released, not audited, so treat as directional). Coffee runs 30-60% because grind-and-ship is the natural offer. Food and meal kit runs 15-35% with higher churn (12-18% monthly) than supplements (5-8%), which is why subscription mix is structurally lower.
does subscribe and save count as subscription revenue for valuation purposes?
Acquirers discount Amazon Subscribe and Save versus first-party subscription because you do not own the customer relationship. The data shows it: Subscribe and Save penetration is 20-35% for participating brands but the program lost share in 9 of 10 top CPG categories YoY 2024 (eMarketer). Build first-party subscription via Recharge, Stay AI, or Skio if you care about multiple expansion.
how do public dtc companies report subscription revenue in their 10-k?
Inconsistently, which is the catch. Chewy uses "Autoship customer sales" (includes one-time orders from Autoship customers). Peloton breaks out subscription as a segment line item. Hims says "majority of online revenue" but does not split the number. Stitch Fix uses "active clients." When you benchmark, compare like-for-like definitions or convert everything to a single denominator (net sales).
what subscription mix do i need to raise a series b at a 5x revenue multiple?
No public dataset prices recurring versus one-time DTC revenue at separate multiples cleanly, so treat this as a directional rule of thumb from M&A-advisory practice rather than a published comp. The working heuristic we use with Eightx M&A engagements is that Series B investors implicitly value recurring revenue at roughly 3-5x higher than one-time revenue, so to hit a 5x blended multiple you typically need 50%+ of revenue running through subscription with sub-10% monthly churn. Lower mixes can still hit 5x if your one-time CAC payback is under 6 months and your repeat rate is above 40%, but the bar gets harder fast. Pull your own PitchBook comp set before quoting a specific multiple to a VC.
how do i grow subscription from 10% to 30% of revenue without killing one-time conversion?
Four moves. Add a first-order subscription discount of 15-20% (not 5%, the math will not work). Make the subscription offer the default on consumables PDPs with a one-time toggle, not the other way around. Build a 30-day onboarding sequence that gets the second shipment to ship. Launch one or two subscription-only SKUs that cannot be bought one-time. Most $10M brands hit 25-30% within four quarters running this play.