
eCommerce
Average TikTok Shop revenue share by ecommerce vertical (2026): beauty 22%, fashion 24%, food 7%
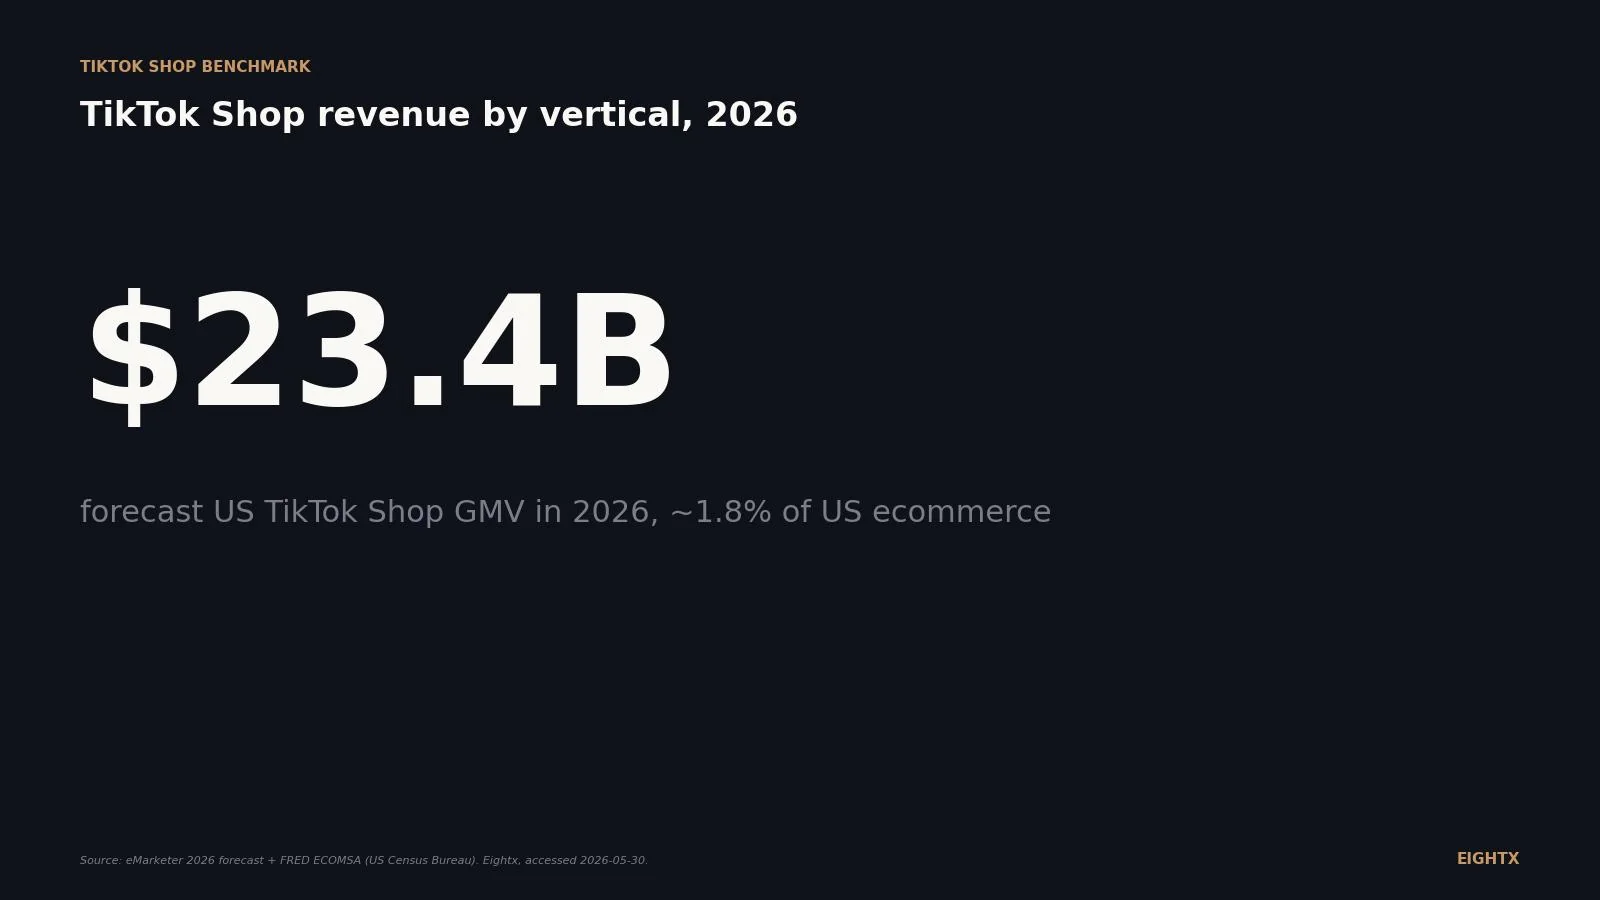
US TikTok Shop GMV is on pace for $23.4B in 2026, up 48% year on year (eMarketer). Fashion owns roughly 24% of that GMV mix, beauty owns 22%, and food and beverage accounts for around 7%. TikTok Pixel adoption on Shopify is highest in beauty and apparel, confirming where the commercial intent is thickest. Operators outside those two categories should model TikTok Shop as a test channel, not a primary revenue driver.
Key Takeaways
- US TikTok Shop GMV is on pace for $23.4B in 2026 (eMarketer), up 48% YoY from $15.82B in 2025. The 2025 number was itself +108% over 2024.
- Beauty and personal care is the largest single vertical at ~22% of US GMV (~$2.49B in 2025). Fashion (women's + men's + footwear) is ~24% combined. Food is 7%, home supplies 4%.
- TikTok Shop is ~1.8% of total US ecommerce but ~18% of US social commerce. Total US retail ecommerce was $326.7B in Q1 2026 (FRED ECOMSA, ~$1.3T annualized).
- Shopify Plus merchants run TikTok Pixel at 28.7%, vs. 10.4% on regular Shopify (Storeleads, May 2026). Larger brands moved earlier; the smaller-Shopify gap is the open category opportunity.
- For most mid-market DTC brands, TikTok Shop is a 5-15% revenue contribution, not a Shopify replacement. Beauty and impulse-supplements brands can push 20%+. Food and home brands can wait without missing much.
US TikTok Shop GMV (gross merchandise value, the dollar value of goods sold through the channel) is on pace for roughly $23.4B in 2026, up 48% year-over-year from $15.82B in 2025. The 2025 number was itself a 108% jump on 2024. That growth is real, but the channel is still ~1.8% of total US ecommerce. The decision on a $5-50M DTC operator's desk is not "do I launch on TikTok Shop." It is "given my category, what share of revenue should I plan for, and when." This page is a living index that we refresh quarterly as eMarketer, FRED, and Storeleads update.
The 2026 number that matters: $23.4B in GMV, ~1.8% of US ecommerce
Two numbers anchor the channel discussion. The first is TikTok Shop's $23.4B 2026 GMV forecast (eMarketer). The second is the size of the market it sits inside: $326.74B in US retail ecommerce in Q1 2026 (FRED series ECOMSA, seasonally adjusted), or about $1.31T annualized. Ecommerce is now 16.9% of total US retail (FRED ECOMPCTSA, Q1 2026).
Inside that $1.3T, TikTok Shop is small. $23.4B divided by ~$1.3T puts the channel at roughly 1.8% of US ecommerce. The growth trajectory matters more than the level: TikTok Shop's GMV roughly doubled in 2025 and is forecast to add another ~50% in 2026. That is fast, but the absolute base is still a single-digit share of where DTC dollars get spent.
The two series live on different scales, which is why the chart uses a secondary y-axis. TikTok Shop is in single-digit billions; total US ecommerce is in low-trillion territory. Plotting them on the same axis would flatten the TikTok line into invisibility.
Year TikTok Shop US GMV ($B) Total US ecommerce ($B annualized) TikTok Shop share of ecommerce (%) 2023 1.0 1,138.0 0.09% 2024 7.0 1,167.4 0.60% 2025 15.82 1,230.1 1.29% 2026E 23.4 1,306.96 1.79%
Within social commerce specifically, TikTok Shop is much bigger. eMarketer puts it at 18.2% of US social commerce in 2025, climbing toward 24% by 2027. Social commerce as a whole hit $87B in 2025 and is forecast to pass $100B in 2026 (eMarketer).
Where the GMV actually goes: beauty and fashion own ~46% of tracked-category GMV
TikTok does not publish US GMV by category officially. The cleanest third-party breakdown is AfterShip's Charm.io-based table for 2025. Beauty leads at ~22% of tracked-category GMV, followed by womenswear (12.6%), menswear (8.1%), food and beverages (6.9%), home supplies (4.1%), and shoes (3.6%). Beauty plus the three fashion sub-categories combine for roughly 46% of GMV.
Category GMV ($M, 2025) Share of US TikTok Shop tracked GMV (%) Beauty & personal care 2,490 22.5% Womenswear & underwear 1,390 12.6% Menswear & underwear 890 8.1% Food & beverages 759.8 6.9% Home supplies 457.5 4.1% Shoes 400 3.6% All other categories 4,670.7 42.2% Total tracked categories (2025) 11,058 100.0%
A quick note on a number that floats around. Capital One Shopping has been cited as saying "health and beauty products account for 79.3% of TikTok Shop sales." That figure is product-tag share of observed sales, not a GMV taxonomy. It cannot be averaged against the ~22% Statista / Charm number; the two use different denominators. The 21-23% range for the Beauty & Personal Care category is the right number to plan against. We flag the 79.3% so you can spot it when other write-ups cite it.
The Shopify adoption signal: who's actually selling there
Charm.io tells us what is selling. Storeleads tells us who is set up to sell. We pulled a May 2026 cross-tab of TikTok Pixel adoption across the global Shopify universe and cut it by category (full methodology and the broader Plus-vs-regular split lives in our TikTok Shop adoption curve breakdown).
The category skew matches the GMV story. Beauty face and body care Shopify stores run TikTok Pixel at 20.2%. Health and nutrition is 18.8%, athletic apparel 17.8%, footwear 17.2%, and food and drink sits at the all-Shopify baseline (10.7%). The all-Shopify rate is 10.77%.
Shopify category cohort TikTok Pixel adoption (%) vs. all-Shopify baseline (10.77%) Beauty (face & body care) 20.2% +9.4 pts Health & nutrition 18.8% +8.0 pts Athletic apparel 17.8% +7.0 pts Footwear 17.2% +6.4 pts Food & drink 10.7% roughly at baseline All-Shopify baseline 10.77% (reference)
The bigger Shopify Plus number (28.7% TikTok Pixel adoption) tells you the larger, more sophisticated brands moved earlier. The integration gap on regular Shopify (10.4%) is where the open category opportunity sits for a $5-20M DTC operator who has not launched yet. If you are in beauty, health, athletic apparel, or footwear and you are not on TikTok Shop, you are behind the category cohort.
One important caveat. TikTok Pixel presence is a proxy. Some installs are ads-only (running TikTok ads to a Shopify product page) rather than commerce (active TikTok Shop sales channel). The number is directionally right for "who is meaningfully engaged with TikTok as a commerce channel," but it is not a hard count of TikTok Shop merchants.
What this means for your channel mix as a $5-50M DTC brand
The decision is not whether TikTok Shop is real. It is real. The decision is how much of your channel mix should it be, and when.
For most mid-market DTC brands we work with, TikTok Shop lands in the 5-15% of revenue range once the program is built. Beauty, impulse supplements, and lower-AOV ($40-$120) impulse soft-goods brands can push 20%+. We see a $30M apparel brand currently planning a TikTok-first DTC launch in 2026; we also see a 9-month-old supplements brand whose channel mix is Amazon and TikTok Shop dominant, with Shopify trailing. Both are the exception, not the rule.
The more common pattern: Shopify stays 50-70% of revenue, Amazon 10-40%, TikTok Shop 5-15%, retail and wholesale fill the rest. TikTok Shop earns its keep two ways. First, direct GMV (the visible number). Second, halo lift on Shopify and Amazon (the harder-to-measure one). Multiple operators we have on tape describe TikTok Shop as a discovery and content channel that lifts other channels, not a primary commerce rail.
Three operator moves for this quarter.
If you are in beauty, athleisure, supplements, or footwear and not on TikTok Shop, launch this quarter. The category-Pixel adoption is already at 17-20% of Shopify stores in your bucket. Waiting another six months puts you behind the cohort that will own the auction in 2027.
If you are in food and beverages or home supplies, you can sequence TikTok Shop for 2027. The GMV (7% and 4% respectively) does not justify pulling creative and ops capacity from higher-return work. Run a 90-day creative test if you have spare bandwidth; don't reorganize the team.
If you are scaling TikTok Shop already, build the attribution stack to see halo lift. If your TikTok Shop direct GMV is 8% of revenue but your Shopify direct traffic from TikTok-tagged sessions is another 10-15%, your real channel contribution is double the visible number. That changes how much you should spend on TikTok creative.
The TikTok Shop story most operators get wrong is the size of the channel. It is exploding (48% YoY in 2026) and it is small (~1.8% of US ecommerce). Both are true. Build a 5-15% revenue plan in beauty, fashion, and supplements; let food and home wait. The category skew is what drives the decision, not the headline growth rate.
What we're watching for the next refresh
The next eMarketer TikTok Shop release usually lands alongside the Q3 commerce update. We will be watching whether the $23.4B forecast holds (third-party trackers vary based on US regulatory enforcement risk) and whether Charm.io's category mix shifts toward supplements or away from beauty.
On the Shopify side, the Storeleads cross-tab refreshes monthly. The number to watch is regular-Shopify TikTok Pixel adoption. It sits at 10.4% today. If it climbs above 15% by end of 2026, the integration gap is closing and the "category opportunity for late movers" framing in this post needs an update. We will refresh the chart and the bands in early Q4 2026.
For more on the operator playbook around TikTok Shop, see the companion TikTok Shop adoption curve breakdown, the ecommerce penetration by category benchmark, and our fractional CFO for ecommerce overview.
Sources and methodology
eMarketer 2026 TikTok Shop US GMV forecast. $23.41B US GMV in 2026, +48% YoY; $15.82B in 2025, +108% YoY. We use the eMarketer top-line for total-market figures and apply Charm.io category shares against the Charm tracked-category base for category-level GMV. Where the methodology gap matters (Charm tracks ~$11B of categories vs. eMarketer's $15.82B total), we note it in the figcaption. eMarketer also publishes 18.2% TikTok Shop share of US social commerce in 2025 and a 24% projection by 2027.
FRED ECOMSA and ECOMPCTSA. US Census Bureau quarterly retail ecommerce sales, seasonally adjusted. Q1 2026 = $326.74B; Q1 of each prior year annualized (Q1 x 4) for clean year-over-year comparison in the time-series chart. Ecommerce as a share of total US retail is 16.9% in Q1 2026. Data accessed via the Federal Reserve Bank of St. Louis FRED database on 2026-05-30.
AfterShip / Charm.io 2025 US TikTok Shop category GMV table. Beauty $2.49B (22.5%), Womenswear $1.39B (12.6%), Menswear $0.89B (8.1%), F&B $0.76B (6.9%), Home Supplies $0.46B (4.1%), Shoes $0.40B (3.6%). The same percentages appear in multiple vendor summaries, all derived from the Charm.io US category cut. Statista reports the beauty figure at 21%, consistent within rounding.
Storeleads Shopify cross-tab, May 2026. 387,057 of 3,593,277 global Shopify stores run TikTok Pixel (10.77%). US Shopify: 147,189 of 1,267,098 (11.62%). Shopify Plus: 21,693 of 75,592 (28.70%). Regular Shopify: 365,364 of 3,517,685 (10.39%). Category-level cuts: beauty face and body care 20.2%, health nutrition 18.8%, athletic apparel 17.8%, footwear 17.2%, food and drink 10.7%. Eightx analysis of Storeleads structured snapshot.
Methodology limitations to flag. TikTok does not publish official US GMV by category, so all category-level numbers are third-party derived. The Capital One Shopping "79.3% health and beauty" figure is product-tag-based, not a GMV taxonomy, and is not comparable to the Statista / Charm 22% number. The "$108K average GMV per active seller" figure assumes uniform distribution across the ~216K active US shops; real distribution is power-law and the median seller does meaningfully less. TikTok Pixel adoption is a proxy for TikTok Shop activity, not a direct count of active commerce merchants. Several primary sources (full eMarketer reports, Bloomberg Second Measure, EarnestAnalytics, Similarweb proprietary panels) are paywalled and were not accessible for this build; we triangulated from the publicly visible summaries and noted the methodology gap.
Operator-call references. The two anonymized brand patterns ($30M apparel brand planning TikTok-first DTC launch; 9-month-old supplements brand with Amazon and TikTok Shop dominant) are drawn from Eightx founder-call records, anonymized and used with consent for benchmark purposes.
Update cadence. This page is a Group A living index. We refresh quarterly when eMarketer, FRED, AfterShip / Charm.io, and Storeleads publish updates. Next refresh target: late August 2026 (post Q2 ecommerce data + late-summer Storeleads snapshot). The variableMeasured block and the chart data will be updated in place; the dateModified will bump.
Frequently asked questions
what % of tiktok shop revenue is beauty in 2026?
Beauty and personal care is about 22% of US TikTok Shop GMV in 2025 (~$2.49B), and most analyst write-ups expect 2026 to land in the 20-25% range as the category mix holds. The widely-cited 79.3% figure (Capital One Shopping) is product-tag share of observed sales, not GMV-share. Use the 22% number for channel-mix planning.
how big is tiktok shop in the US vs total ecommerce?
Total US retail ecommerce was $326.7B in Q1 2026 (FRED ECOMSA), roughly $1.3T annualized. TikTok Shop's forecast $23.4B is about 1.8% of that. Within social commerce specifically, TikTok Shop is ~18% of the US market and eMarketer projects ~24% by 2027.
how much does the average tiktok shop seller make per year?
Roughly $108K in GMV per active US seller in 2026 ($23.4B divided by ~216K active shops, ~46% of the 475K registered). That is a top-down average. Real distribution is power-law: the top 1% of sellers likely capture 50%+ of GMV. Most sellers do meaningfully less than the average.
is tiktok shop bigger than amazon for dtc brands?
No. Amazon is the dominant US ecommerce player by a wide margin. TikTok Shop is ~1.8% of US ecommerce. For a mid-market DTC brand the typical channel mix is Shopify 50-70%, Amazon 10-40%, TikTok Shop 5-15%. Beauty and impulse-supplements brands sometimes push TikTok Shop to 20%+, but it is rarely the dominant channel.
what category sells best on tiktok shop right now?
Beauty and personal care leads at ~22% of US GMV, followed by womenswear (~13%), menswear (~8%), food and beverages (~7%), home supplies (~4%), and shoes (~3.6%). Health and nutrition is meaningful but smaller in GMV than Shopify-Pixel adoption suggests.
should my food brand even bother with tiktok shop in 2026?
If you are under $20M revenue and not already there, probably not as a Q3 priority. Food and drink Shopify stores adopt TikTok Pixel at 10.7%, almost exactly the all-Shopify baseline. The 'viral TikTok food' narrative is louder than the GMV (food is 7%). Build the muscle for 2027 if you have spare creative capacity, but it is not where your next $1M of revenue is coming from this quarter.
how does tiktok shop revenue split between fashion vs beauty vs home?
Beauty is ~22%, fashion (women's + men's + footwear) is ~24% combined, home supplies is ~4%, and food and beverages is ~7%. Beauty and fashion together own about 46% of tracked-category GMV. Everything else is the long tail.
what % of shopify merchants are integrated with tiktok shop?
About 11% of US Shopify stores run the TikTok Pixel (Storeleads, May 2026). Shopify Plus runs at 28.7%, vs. 10.4% on regular Shopify, so larger brands moved earlier. Pixel presence is a proxy for activity, not a direct count of TikTok Shop merchants; some installs are ads-only.