
Insights
Average ecommerce vs retail revenue share by vertical, 2026: 10 public consumer brands, 1 clean disclosure
FY2025 10-Ks from 10 public consumer brands show own-retail revenue share split into three tiers: pure-DTC online brands like FIGS and e.l.f. Beauty at 0 percent physical retail, omnichannel DTC like Warby Parker at over 60 percent and On Holding at 41.8 percent, and wholesale-first like Levi's at 33 percent company-operated retail. Most brands combine channels. US ecommerce as a share of total retail reached 16.9 percent in Q1 2026 (Census Bureau seasonally adjusted).
Key Takeaways
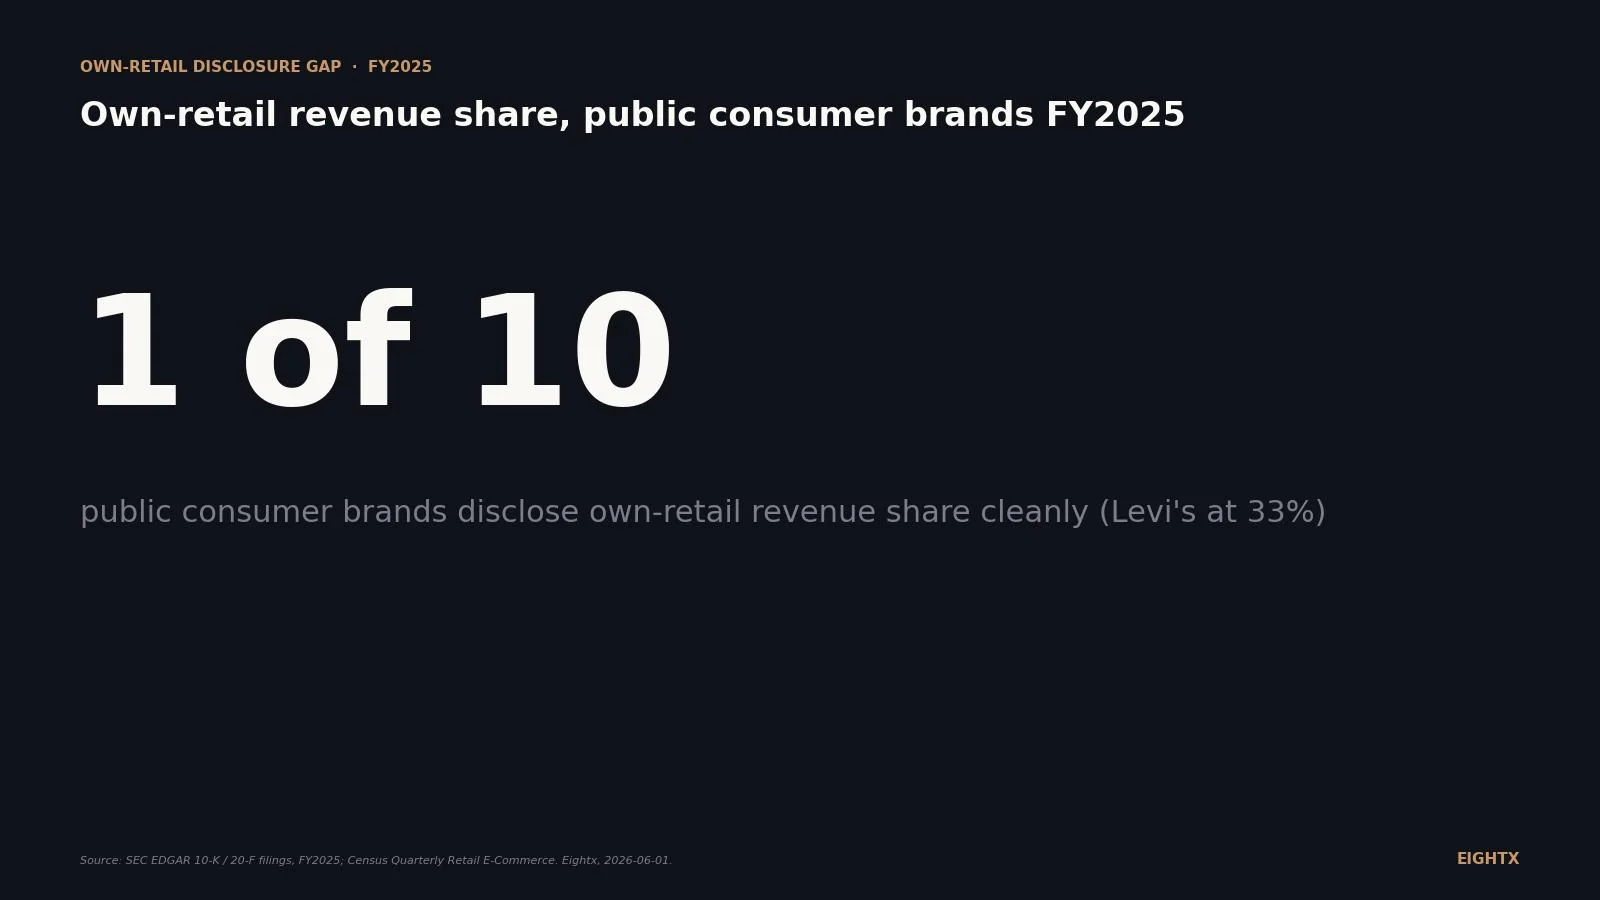
- Only 1 of 10 public consumer brands we pulled discloses own-retail-store revenue share cleanly in their FY2025 10-K or 20-F: Levi Strauss at 33%. Every other brand (Lululemon, Warby Parker, Birkenstock, On Holding, Crocs, FIGS, Allbirds, e.l.f. Beauty, YETI) either lumps retail and e-commerce into a single DTC bucket or does not disclose at all. The benchmark every founder Googles does not exist in the form they expect.
- A clean three-tier ladder shows up once you triangulate. Digitally-native brands sit at 0% to 10% own-retail (FIGS 0, ELF 0, YETI under 5%, Allbirds declining). Omnichannel premium brands sit at 25% to 40% (Levi's 33% disclosed, Birkenstock 38% DTC, On Holding 42% DTC). Store-led specialty brands run 40% and higher (Lululemon estimated 40-50%, Warby Parker estimated greater than 60%).
- Allbirds closed every remaining US full-price store in Q1 2026. From 23 stores a year earlier to 4 globally (2 US outlets plus 2 UK). FY2025 revenue 152.5 million dollars, down 19.7%, net loss 77.3 million. The cautionary case study in opening stores before you have the brand awareness to fill them.
- US e-commerce share of total retail trade is still 16.9% at Q1 2026. Even at peak holiday seasonality the line has never broken 20%. Brick-and-mortar still owns more than 83% of US retail dollars. The 'ecommerce is the future' pitch deck is technically true and operationally misleading at the same time.
- Most public brands do not disaggregate own-retail vs e-commerce inside DTC because they do not have to and because the mix shift would highlight margin compression. Investor calls reward 'DTC growth' as a single number. The disclosure gap is a feature for the IR team and a bug for any operator trying to benchmark.
If you run a $5M to $50M ecommerce brand, the question "should we open a store" usually arrives between board meeting two and board meeting three. The first answer most founders find is a calculator on a real-estate blog. The second is a McKinsey deck about omnichannel. Neither tells you what share of revenue publicly traded consumer brands actually pull from their own retail stores. We pulled FY2025 10-Ks and 20-Fs for 10 public consumer brands to answer the question directly. The headline finding: only one company (Levi Strauss, 33%) discloses own-retail-store revenue share cleanly. Everyone else either lumps stores and e-commerce into a single DTC bucket or does not disclose at all. Underneath the disclosure gap is a clean three-tier ladder that tells you where your business should actually sit.
What public 10-Ks actually disclose about own-retail-store revenue
The disclosure gap is the most important finding in the data, because it shapes what every other benchmark you read online is actually measuring.
Of 10 public US-listed and dual-listed consumer brands we pulled, exactly one (Levi Strauss) discloses own-retail-store revenue share as a clean percentage. Levi's FY2025 10-K (filed 2026-01-28) reports company-operated brick-and-mortar retail stores at 33% of net revenues, up from 32% in FY2024 and 30% in FY2023, across 1,231 stores in 38 countries.
Every other brand in the sample blurs the line. Lululemon reports a single consolidated segment (no retail-vs-ecommerce dollar split disclosed) but does report 811 stores at $1,426 sales per square foot. Warby Parker (323 stores, $871.9M revenue) calls it "holistic vision care" and reports as one segment. Birkenstock (62% wholesale / 38% DTC) and On Holding (58.2% wholesale / 41.8% DTC) both disclose DTC as a single line that includes e-commerce and own-retail combined.
The pattern is structural, not accidental. The higher the wholesale share, the cleaner the disclosure. The higher the own-retail share, the murkier. From an investor-relations standpoint, "DTC growth" reads better as a single number than "store growth held flat while e-commerce dropped." The disclosure gap is a feature for the IR team and a bug for any operator trying to benchmark.
The data table below shows what each brand discloses and what they do not.
Brand Ticker Vertical FY-end Own stores Own-retail % rev Wholesale % rev Ecommerce % rev Levi Strauss LEVI Denim apparel Nov 30 2025 1,231 33% (disclosed) ~64 ~3 (ecom in DTC) Lululemon LULU Athletic apparel Feb 1 2026 811 40-50 (est) ~3 45-55 (est) Crocs CROX Footwear Dec 31 2025 514 12-18 (est) ~47.9 37.8 (digital, incl e-tailer) Warby Parker WRBY Eyewear Dec 31 2025 323 60+ (est) 0 under 40 (est) On Holding ONON Performance footwear Dec 31 2025 ~50 (est) N/D (DTC=41.8 incl ecom) 58.2 N/D Birkenstock BIRK Footwear Sep 30 2025 N/D N/D (DTC=38 incl ecom) 62 N/D YETI YETI Drinkware Jan 3 2026 27 under 5 (est) 40 ~55+ (incl Amazon) FIGS FIGS Healthcare apparel Dec 31 2025 5 0 disclosed 0 ~95+ (digital + TEAMS) Allbirds BIRD Sustainable footwear Dec 31 2025 4 Declining ~minimal ~majority e.l.f. Beauty ELF Mass beauty Mar 31 2026 0 0 76 24
The three tiers: digitally-native (0-10%), omnichannel (25-40%), store-led (40%+)
Once you triangulate around the disclosure gap, a clean three-tier ladder shows up.
Tier 1 (digitally-native, 0% to 10% own-retail). FIGS at 0% disclosed (5 Community Hubs framed as brand-awareness vehicles, not a revenue channel). e.l.f. Beauty at 0% (76% wholesale through Target, Walmart, Amazon, Sephora and 24% e-commerce, zero owned stores). YETI under 5% (27 owned stores against 1.7 billion dollars revenue, with Amazon Marketplace driving DTC growth). Allbirds declining (4 stores left globally after Q1 2026 closures). The operator pattern: stores are a brand vehicle or absent. Capital is concentrated in customer acquisition through digital and wholesale.
Tier 2 (omnichannel premium, 25% to 40% own-retail). Levi Strauss at 33% disclosed (1,231 stores, the cleanest data point in the entire ladder). Birkenstock at 38% DTC including e-commerce (which Eightx estimates puts own-retail in the high teens to mid-20s once e-commerce is stripped out). On Holding at 41.8% DTC including e-commerce (similar pattern). Crocs at an estimated 12% to 18% own-retail (514 stores, of which 269 are outlets, where the merchandising mode is closer to inventory clearance than full-price retail). The operator pattern: stores and e-commerce share growth duties. Both channels require real merchandising and footprint discipline. This is the zone most $50M+ public DTC brands aspire to.
Tier 3 (store-led specialty, 40%+ own-retail). Lululemon at an estimated 40% to 50% (811 full-price stores, $1,426 per square foot, $11.1B revenue, with the math shown in the methodology section). Warby Parker at an estimated 60%+ (323 stores, $871.9M revenue, management commentary that "the majority of revenue" comes from stores). The operator pattern: the business is a retail store fleet that happens to have an e-commerce site. Capital allocation, hiring, and operating cadence look more like Gap or J.Crew than like a Shopify brand.
The macro context anchors why own-retail still matters even for digitally-native brands. US e-commerce share of total retail trade was 16.9% in Q1 2026 (FRED ECOMPCTSA, seasonally adjusted, republishing the Census Bureau Quarterly Retail E-Commerce Sales release). Even at peak holiday seasonality the line has never broken 20% on this series. Brick-and-mortar still owns more than 83% of US retail dollars. Most retail dollars are still spent in physical stores, which is exactly why every Tier 3 specialty brand in the table above is built around a store fleet. Vendor reports (eMarketer, Forrester) tend to land 5 to 10 percentage points higher because they include broader e-commerce definitions; we anchor on ECOMPCTSA because it is the official Census number and the cleanest apples-to-apples series.
Allbirds is the case study in getting it wrong
The Allbirds disclosure is the clearest cautionary tale in the public set.
The FY2025 10-K (filed 2026-03-31) confirms the company closed all remaining US full-price retail stores in Q1 2026. Total global fleet went from 23 stores a year earlier to 4 stores today: 2 US outlets and 2 UK stores. The retail workforce went from over 200 employees to under 50. FY2025 net revenue was 152.5 million dollars, down 19.7% YoY. Net loss was 77.3 million dollars on that revenue.
The 10-K is explicit about the cause: "declines in our retail and e-commerce businesses resulting from store closures" combined with an international shift from owned operations to distributors. Allbirds opened a Tier 2 / Tier 3 store fleet during 2020 to 2022 on a Tier 1 brand-awareness base. When the digital channel softened, the store P&L did not have the unaided demand to backstop it.
The pattern operators should take away: closing all your stores after opening them is far more expensive than never opening. Allbirds spent the capital twice: once on build-out, once on closure. The downstream costs (severance, lease-break, write-downs) hit the FY2025 P&L. Allbirds opened ahead of the LTV math could justify. If you are a 5 to 50 million dollar DTC brand asking the question now, the Allbirds case is the one to study, not the Lululemon case.
What this means for your channel-mix plan in 2026
Three things to do this quarter.
Diagnose your tier honestly before you set a target. If your brand has under 5% unaided awareness in your top-3 markets and your branded-search volume is flat YoY, you are a Tier 1 operator regardless of what your ad agency tells you. Stores will not fix demand. They will absorb cash. Spend the next two years on retention, content, and brand-search lift before signing a lease.
If you do open a store, open one and instrument the catchment. A single store in your highest-LTV city for 18 to 24 months gives you a clean read on whether stores lift total-channel revenue in the catchment or just substitute for online. Most failed retail expansions skipped this step. The data you need is post-open digital revenue in the trade area against pre-open digital revenue in the same trade area, controlled for total-business growth. If digital drops more than 10% in the catchment, your store is cannibalizing, not adding.
Build the capital plan to absorb 18 to 24 months of store loss before contribution turns positive. Sales-per-square-foot benchmarks (Lululemon at $1,426 in FY2025, down from $1,574 a year earlier) are top-quartile-brand numbers. A new store at a 5 to 50 million dollar DTC brand will run at 30% to 50% of that productivity in year one. Assume 1.0 to 2.5 million dollars in year-one revenue per store and a contribution loss of 200 to 500 thousand dollars while the store ramps. If your balance sheet cannot absorb that without diluting growth in your highest-ROI channel, the lease is the wrong decision regardless of how well your brand is performing on Shopify.
Levi Strauss is the only brand in our sample that discloses own-retail-store revenue share cleanly: 33%. Everyone else either lumps it into DTC (Birkenstock 38%, On Holding 41.8%) or does not disclose at all (Lululemon, Warby Parker, Crocs, FIGS, ELF, YETI). The three-tier ladder shows up once you triangulate: digitally-native at 0% to 10%, omnichannel at 25% to 40%, store-led at 40%+. Most $5 to $50 million DTC brands are Tier 1 operators behaving like Tier 2 operators. Allbirds is the case study in what that costs.
Sources and methodology
Primary data was pulled from SEC EDGAR 10-K and 20-F filings for the most recently completed fiscal year, accessed 2026-06-01. The 10 brands in our sample (Levi Strauss, Lululemon, Warby Parker, Birkenstock, On Holding, Crocs, FIGS, Allbirds, e.l.f. Beauty, YETI) cover apparel, footwear, eyewear, healthcare apparel, mass beauty, and drinkware. Fiscal year-ends vary: Levi's ends November, Lululemon ends late January / early February, Birkenstock ends September, ELF ends March, and the remaining brands report on calendar-year-end. The FY2025 label in our data table refers to each company's most recent annual filing, not a calendar-year apples-to-apples comparison.
Own-retail-store revenue share is the metric of interest. Levi Strauss is the only brand that discloses this directly as a percentage of net revenues in the Item 1 Business section of its 10-K (33% in FY2025, up from 32% in FY2024 and 30% in FY2023). For every other brand, we either flag the value as N/D (not disclosed) where the company does not provide channel detail (Birkenstock own-retail standalone, On Holding own-retail standalone), or provide a triangulated estimate where store count, square footage, sales-per-square-foot, and management commentary support a directional read.
For triangulated estimates: Lululemon's $1,426 sales per square foot across 811 stores, combined with an estimated average store size of 3,500 to 4,500 square feet (typical for full-price athletic-apparel flagships, which run larger than Levi's denim format), supports an own-retail revenue band of 36% to 47% against $11.1B FY2025 revenue (math: 811 × 3,500 × $1,426 = $4.05B / $11.1B = 36%; 811 × 4,500 × $1,426 = $5.20B / $11.1B = 47%). We round the band to 40% to 50%. This is also consistent with a peer-scale read against Levi's disclosed 33% own-retail share adjusted upward for Lululemon's full-price-only positioning (Levi's includes outlets), higher per-store productivity, and effectively zero wholesale channel. Warby Parker's $871.9M revenue against 323 stores, plus management commentary that the majority of revenue comes from physical locations, supports an own-retail estimate above 60%. Crocs' 100% minus 47.9% wholesale minus 37.8% digital (which includes brand-owned websites plus third-party e-tailer wholesale plus marketplaces) leaves a 12% to 18% own-retail residual. YETI's 27 owned stores against $1.7B+ revenue puts own-retail under 5% even at high per-store productivity.
For macro context: US e-commerce share of total retail trade is from the FRED series ECOMPCTSA, which republishes the US Census Bureau Quarterly Retail E-Commerce Sales release. Q1 2026 value is 16.9% of total retail (NAICS 44-45 plus 454, seasonally adjusted). We use ECOMPCTSA specifically because it measures total e-commerce sales (pure-play plus chain e-commerce) as a share of total retail. A related Census series, NAICS 4541 ("Electronic shopping and mail-order houses") divided by total retail trade, comes in higher at 19.3% (December 2025, $122.5B / $634.8B); that series measures a sector ratio rather than total e-commerce penetration. Vendor reports from eMarketer and Forrester typically land at 22% to 23%, including broader definitions of digital commerce. The Census quarterly e-commerce share (ECOMPCTSA) is the cleanest "ecommerce vs brick-and-mortar" benchmark available and is the series we recommend operators anchor against.
Triangulation sourcing also included a Pinecone retrieval over 5,400+ Eightx founder-call segments where own-retail-store decisions were discussed. The recurring partner-call pattern when founders ask about opening stores: stores require independent brand awareness for sell-through; without awareness the store will not pick the brand out of the shelf or the shop window. That voice is reflected in the operator section above. We also reviewed Perplexity-sourced commentary on Warby Parker, FIGS, Allbirds, On Holding, Birkenstock, ELF, and YETI to cross-check our 10-K reads against analyst and press summaries.
Limitations: most public brands do not disaggregate own-retail vs e-commerce inside their DTC line. For those companies (Birkenstock, On Holding, Lululemon, Warby Parker) we provide an estimated band rather than a point estimate. The estimates use the methodology shown above and should be read as directional, not as precise as the Levi's disclosed 33%. The sample is also weighted toward US-listed brands; the broader global picture (Adidas, Nike, Inditex, H&M, MUJI) would shift the tier-2 omnichannel band slightly higher. This tracker is refreshed quarterly when new 10-Ks land: February (calendar-year filers), March (Lululemon plus ELF), May (ELF FY-end), September (Birkenstock FY-end).
For related benchmarks, see our average ecommerce gross margin Shopify vs Amazon and average ecommerce MER by vertical. For the operator framing on when to open a store, see fractional CFO services for ecommerce.
Frequently asked questions
what's the average percentage of revenue a dtc brand gets from owned retail stores?
There is no single average because most public brands do not disclose it. Across the 10 public consumer brands we pulled for FY2025, only Levi Strauss reports own-retail revenue share cleanly (33%). The rest sit in three operator tiers: digitally-native at 0% to 10% (FIGS, ELF, YETI, Allbirds), omnichannel at 25% to 40% (Levi's, Birkenstock, On Holding), and store-led at 40%+ (Lululemon estimated 40-50%, Warby Parker estimated 60%+). Pick your tier, then benchmark.
should i open a flagship store if i'm at $10m dtc revenue?
Only if you can answer yes to three questions. First, is your branded-search traffic growing year over year (proxy for unaided awareness)? Second, does your highest-LTV ZIP code have at least 8x your blended customer density (proxy for catchment)? Third, can you absorb 18 to 24 months of rent and payroll without the store covering its own contribution margin (proxy for capital runway)? Below those three thresholds, the store will look like growth on the P&L for two quarters and a drag on cash for the next two years.
how many own retail stores does lululemon actually have in 2026?
811 worldwide as of the FY2025 10-K (fiscal year ending February 1, 2026). 476 in the Americas, 172 in China Mainland, 163 in Rest of World. Up from 767 a year earlier. Sales per square foot dropped from 1,574 dollars to 1,426 dollars, which is the lululemon-specific data point most operators miss: same-store productivity is slipping even as the fleet expands.
did allbirds really close all their us full-price stores?
Yes, in Q1 2026. The FY2025 10-K (filed 2026-03-31) confirms only 4 stores remain globally: 2 US outlets and 2 UK stores, down from 23 a year earlier. The company posted a 77.3 million dollar net loss on 152.5 million in revenue (down 19.7% YoY). Allbirds' retail workforce went from 200+ employees to under 50. The 10-K explicitly attributes the revenue decline to 'store closures.'
what percent of warby parker's revenue comes from their physical stores vs online?
Warby Parker does not disclose the split in its 10-K. Management commentary points to 'the majority of revenue' coming from the 323-store fleet (Eightx triangulated estimate: 60% to 70% of net revenue from own-retail). The 10-K reports holistic vision-care as a single segment, which is the IR-friendly framing. Our directional read: Warby is closer to a retailer with an e-commerce site than a DTC brand with stores.
if i open a brand store does that cannibalize my shopify sales?
Some cannibalization is unavoidable. The cleaner question is net revenue lift inside the store's catchment area. The Eightx senior-partner pattern across $5M-$50M DTC client work is that a healthy store lifts total-channel revenue inside its catchment in year one, with digital typically holding flat to down a few points in the same trade area; magnitudes vary widely by vertical and we are not pinning a public benchmark on it. If your post-open digital channel drops more than 10% in the catchment, your store is substituting for online, not adding to it.
what's the right own-store revenue share to target by vertical?
Three honest answers by tier. Digital-native verticals (healthcare apparel, mass beauty CPG, drinkware): target 0% to 10%, do not chase a number, treat stores as brand vehicles only. Omnichannel verticals (premium apparel, footwear, denim): target 25% to 40% over a 3 to 5 year build-out. Specialty verticals where the product needs try-on or fit (eyewear, athletic apparel): target 50%+ but expect to operate like a retailer, not a DTC brand.
how much revenue does one own retail store generate at a $20m dtc brand?
Lululemon's FY2025 sales per square foot is 1,426 dollars across 811 stores. A typical specialty store of 2,500 to 4,000 square feet at that productivity is 3.6 million to 5.7 million dollars per store per year. Levi's company-operated store productivity (33% of 6.4 billion dollars revenue divided by 1,231 stores) is closer to 1.7 million dollars per store per year. The right benchmark for a $20M DTC brand: assume 1.0 million to 2.5 million per store in year one, ramping to 2.5 million to 4.0 million by year three if your brand is doing the work.