
Insights
Subscription trial-to-paid conversion by vertical (2026): the spread operators benchmark wrong
Card-required subscription trials convert at 31.4% globally; no-card trials convert at 8.9% (Adapty 2026). Replenishment categories like coffee and supplements hold 92% or more of first-box subscribers into a second box. Beauty and curation boxes lose 30 to 40% at the first renewal. The benchmark that matters is not trial conversion but first-to-second-box rate, which is the true subscription health signal.
Key Takeaways
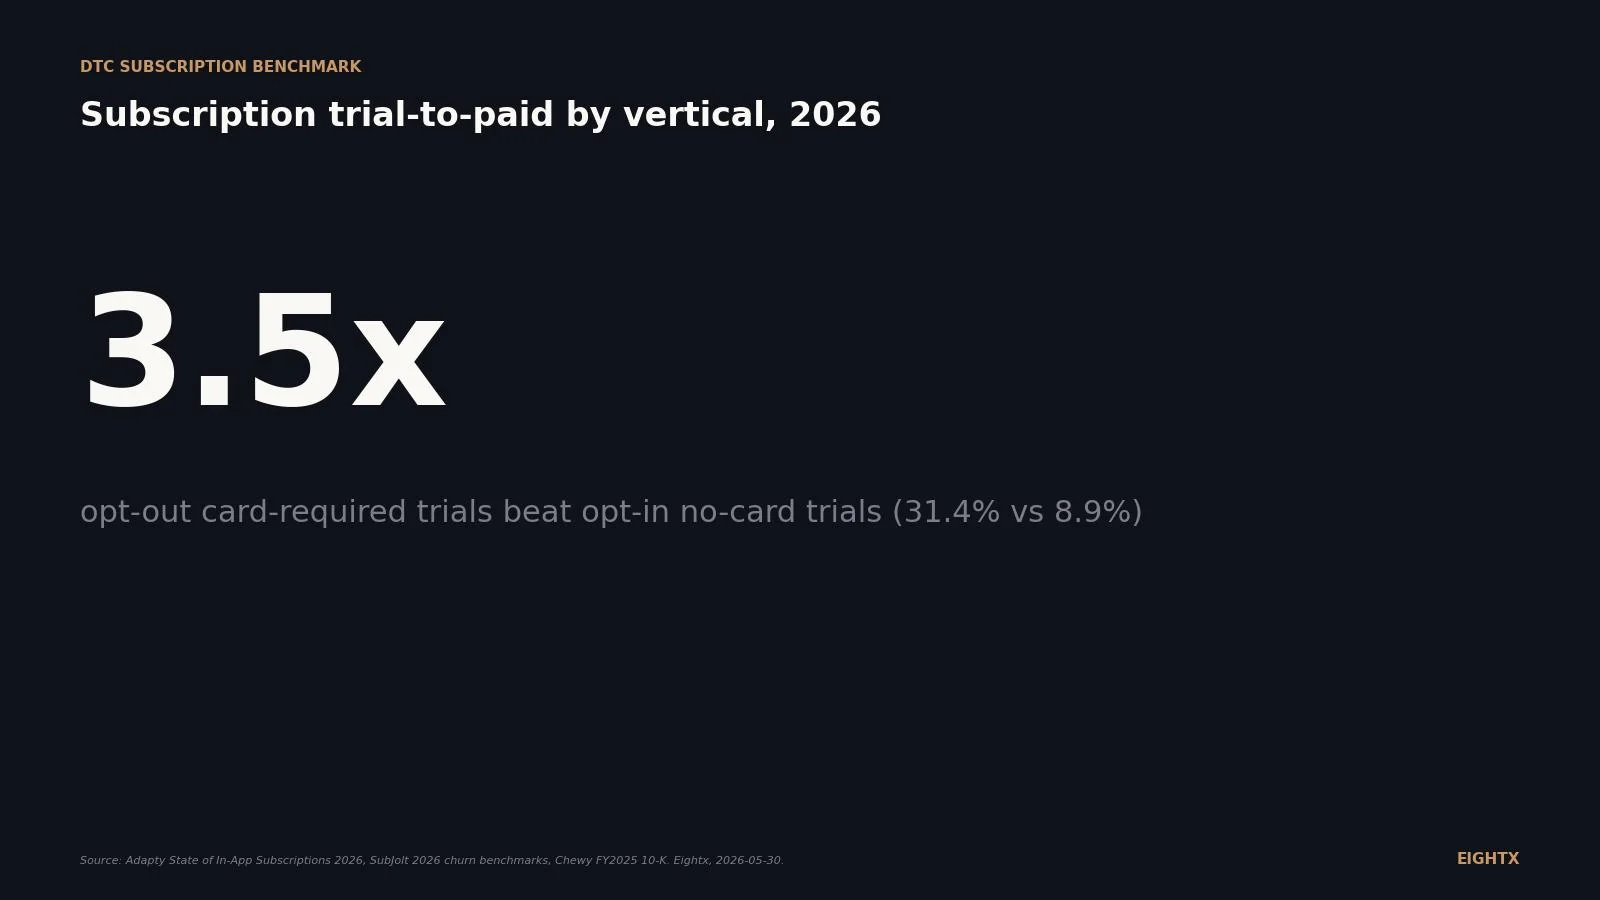
- Opt-out free trials (credit card required) convert at 31.4%; opt-in free trials (no card) convert at 8.9% (Adapty State of In-App Subscriptions 2026). A 3.5x gap inside the same product. Most physical-subscription flows are card-required, so the 31% band is your benchmark, not the 25% global blend.
- Discounted first-box trials in physical DTC convert at 25-40% (Shopify 2026 subscription benchmarks); the often-cited 43% figure is a SaaS aggregation (Totango / OPEXEngine via Cobloom) and overshoots most physical-product flows. A too-deep discount also tanks 90-day retention.
- Replenishment verticals (pet food, supplements, coffee) hold 92-96% first-box-to-second-box. Beauty curation boxes bleed 30-40% on the first box. Vertical sets the shape of the curve, not just the average.
- Chewy got 83.3% of FY2025 net sales from Autoship customers ($10.50B of $12.6B, 21.3M active customers, $591 per customer per year). The operating proof that at scale, subscribe-and-save is the P&L, not a feature.
- 40-60% of subscription cancellations happen in the first 90 days. Most operators report monthly churn as a single number. Split it by cohort first. If month-1 cohort is 3-4x steady-state, onboarding is the binding constraint, not retention.
On a recent CFO call with a multi-category DTC subscription operator, the founder opened with "our monthly churn looks fine at 7%." We split it by cohort. Their month-1 cohort was at 28%. Their month-12 cohort was at 3-4%. That is not a retention problem at month 12. That is a first-box problem. They were reporting a single blended number and hiding the leak. Most ecommerce-subscription operators do the same thing, and most benchmark against the wrong "trial-to-paid" number on top of it.
Most ecommerce-subscription operators benchmark against the wrong number because "trial-to-paid conversion" means three different things, and the publicly cited averages mix them up. This post separates the three meanings, gives the 2026 numbers for each, and walks through how to set your target at $5M to $150M in subscription gross merchandise value (GMV).
The three things trial-to-paid can mean (and why operators benchmark wrong)
"Trial-to-paid" is a phrase that came out of SaaS and got applied loosely to ecommerce. There are three distinct flows it can describe.
First, mobile app subscriptions. The Adapty State of In-App Subscriptions 2026 ($3B+ in revenue analyzed) reports a 25.6% global trial-to-paid average, with health and fitness apps at 35% and entertainment at 19.1%. This is the most-cited "trial-to-paid" benchmark on the internet. It is for apps like Calm, Strava, and MyFitnessPal, not for ecommerce subscriptions.
Second, software-as-a-service (SaaS) trials. Pulseahead 2026 puts SaaS paid-trial median conversion around 43% and reports a 3.5x opt-in vs opt-out structural delta. Still digital products, still trial-first. The trial-structure mechanic transfers to physical DTC; the absolute SaaS percentages do not.
Third, physical-product subscribe-and-save. There is no "trial" in the SaaS sense. The closest analog is "first-box-to-second-box conversion" (did the first delivery convert into a second billing). For replenishment categories (pet food, supplements, coffee), that number runs 92-96%. For curation boxes (beauty, lifestyle), it runs 60-70%.
When operators read "the trial-to-paid average is 25%," they are reading a mobile-app number. When they read "trial conversion is 50%," they are reading a SaaS number. Neither is the right benchmark for a Shopify subscription brand on Recharge or Loop. The right benchmark is the structural-trial number for the trial type they actually run (covered next), filtered through their vertical's churn curve (covered after).
Trial structure flips the number 3-5x before vertical matters
The single biggest driver of trial-to-paid conversion is not vertical. It is whether you require a credit card.
The three structures and 2026 conversion bands:
Trial structure 2026 conversion to paid Notes Opt-in free trial (no credit card) ~9% (avg 8.9%) Adapty 2026 in-app data. Common in app stores and SaaS product-led-growth flows. Opt-out free trial (credit card required) ~31% (avg 31.4%) Card on file. Adapty 2026 in-app data; treat as the structural ceiling for card-required physical DTC, not the level. Free first-box trial, physical DTC 15-25% Shopify 2026 subscription benchmarks (cross-category). Discounted first-box trial, physical DTC ($1 / 30-50% off) 25-40% Shopify 2026 benchmarks. Highest converter for physical DTC. Lowest 90-day retention if the discount is too deep. Paid trial, SaaS aggregation ~43% (median) Cobloom aggregation of Totango / OPEXEngine SaaS B2B data. Structural mechanic transfers; absolute number does not. 30-day post-purchase auto-enroll into subscribe-and-save 70-90% (operator observation) Recharge and Ordergroove operator practice, not a published benchmark. Closest analog to Chewy Autoship onboarding.
Most physical-subscription flows on Recharge, Loop, or Stay AI default to card-required at trial start. That places them above the 8.9% opt-in band but, for physical product specifically, in the 25-40% discounted-first-box range per Shopify 2026 subscription benchmarks, not at the 31.4% Adapty in-app number (which is mobile-app product, not a physical first box). A founder benchmarking their 28% trial-to-paid against "the 25% global industry average" is benchmarking against the wrong number and feeling artificially good. Benchmark against the matching structure for your category: 15-25% if you run a true free first box, 25-40% if you run a discounted first box.
Paid trials convert highest but come with a retention tail. The mechanic that lifts conversion is the same mechanic that anchors price-sensitivity in the buyer. We see brands running 70% off first-box offers pull conversion into the upper band and then bleed 30-40% of those buyers on the second billing. The middle path most CFOs land on is a 30-50% off first box (not 70-90%) plus card-required commitment.
Vertical sets the shape of the trial curve
Once you have the right structural benchmark, vertical sets the shape of what happens after the first billing.
Replenishment categories (pet food, supplements, coffee, household consumables) hold 92-96% of first boxes because the buyer re-needs the product on a clock. The subscription cadence matches the consumption cadence. Curation categories (beauty boxes, lifestyle boxes) bleed 30-40% of first boxes because the buyer bought novelty. Once the novelty hits, a chunk are out. Skincare sits in between (replenishment in theory, curation in practice for new buyers).
Vertical First-month / first-box churn Trial-to-paid conversion Pet food / supplies 3-5% 95-97% Supplements / vitamins 5-8% 92-95% Coffee / staples 6-8% 92-94% Skincare (replenishment) 25-30% 70-75% Beauty curation box 30-40% 60-70% Color cosmetics 35-40% 60-65% General curation box 10-15% 85-90% Meal kits 40-50% (first 90d) 50-60%
In a recent CFO call with a multi-category DTC subscription operator, we found their blended monthly churn was 7%. Looked fine. Split by cohort, their month-1 churn was 28% and their month-12 cohort was at 3%. That is not a retention problem on month 12. That is a first-box problem. Fix the unboxing experience and the offer matches, and the blended number drops two points without touching anything else.
The practical read for a replenishment brand running above 90% first-box conversion: the lever is shipping frequency (auto-shipped cadence, swap availability), not conversion. The conversion ceiling for replenishment is roughly 95%, and the brands at 92-93% are already at the band's mid. The lift is in cadence and basket size, not the first-box decision.
What trial-to-paid looks like at scale: Chewy's 83.3% Autoship share
The cleanest scaled benchmark in public ecommerce subscription is Chewy. Their FY2025 10-K disclosed $12.6B in net sales, $10.50B from Autoship customers (83.3% share, up from 79.2% the year prior), 21.3M active customers, and $591 net sales per active customer per year.
The trajectory matters as much as the level. Chewy's Autoship share has gone up every fiscal year for six years, from 65.7% in FY2019 to 83.3% in FY2025. That is the operating proof that at scale in a replenishment category, subscribe-and-save is not a feature on top of one-time purchase. It is the P&L. The first-box-to-second-box step (first Autoship order to second Autoship billing) is the single most-disclosed retention metric Chewy talks about in MD&A.
Fiscal year Autoship % of net sales Active customers (millions) Net sales per active customer FY2019 65.7% n/a n/a FY2020 68.3% n/a n/a FY2021 70.1% 20.5 $388 FY2022 72.6% 20.4 $477 FY2023 75.8% 20.1 $540 FY2024 79.2% 20.5 $578 FY2025 83.3% 21.3 $591
Caveat: pet food is the structurally easiest vertical to subscribe. The 83.3% Autoship share is a ceiling, not a target for non-replenishment brands. A beauty curation box running 30% subscription share of revenue is doing well for the category. A supplements brand running 60% subscription share has room. A pet-adjacent brand running below 70% is leaking against the public-company comparable.
The first 90 days is where 40-60% of LTV is won or lost
Across Recurly research and Rivo benchmarks, 40-60% of subscription cancellations happen within the first 90 days. Nearly half of all churn decisions are made after the first delivery. The "trial-to-paid" event for physical subscription is effectively "did the first box land well enough to allow the second billing."
Most operators measure monthly churn as a blended number. That is the leak. Month-1 cohort churn typically runs 2-4x steady-state. A brand reporting "7% monthly churn" usually has a 20%+ first-box bleed hiding inside it. The diagnostic order:
- Split your churn by cohort (month-1, month-3, month-6, month-12, month-24).
- If month-1 is 3x+ your steady-state, onboarding is the binding constraint. Fix unboxing, fix expectation-setting, fix the offer fit.
- If month-1 is roughly the same as steady-state, the problem is elsewhere (product, price, or category fit).
- If month-3 is higher than month-1, you have a product-fit problem. People got the box, used it, did not love it.
The biggest thing for me is always constraint-based. What is the thing that is holding you back? Fix that first and everything else will come after it. Most subscription brands diagnose backwards. They optimize the trial CRO when their month-1 cohort is bleeding, or they optimize retention emails when their offer-to-product fit is the leak.
How to set your trial-to-paid target at $5M to $150M revenue
Three concrete actions for the operator running a subscription brand in this band.
Pick the matching structural benchmark. Are you opt-in (no card), card-required free trial, or paid (discounted first box)? For physical DTC: free first-box trials run 15-25%, discounted first-box trials 25-40% (Shopify 2026 benchmarks). The Adapty 8.9% / 31.4% / 43% ladder you see most often is mobile-app and SaaS data; the structural delta (3.5x opt-out vs opt-in) transfers, the absolute numbers do not. If you are running a discounted first-box trial and converting at 22%, you are below the 25-40% band. If you are running a free first box and converting at 28%, you are at the top. Diagnose against the matching structure.
Split your monthly churn by cohort before any retention work. If month-1 cohort is 3-4x steady-state, the binding constraint is onboarding. Fix the unboxing experience, the offer fit, and the expectation-setting before you spend on email retention sequences. If month-1 is roughly the same as steady-state, optimize retention. If month-3 is higher than month-1, the leak is product-fit and no retention motion saves you.
For replenishment brands above 92% first-box conversion, the LTV lever is frequency, not conversion. Auto-shipped cadence, basket-size expansion, swap availability, and prepaid commits (Recurly reports roughly 40% retention lift from prepaid 3-month or 6-month commits) move LTV more than another point of trial conversion. Stop chasing 96% if you are at 93%. The marginal point costs more than the same effort spent on cadence.
The 25% trial-to-paid average you keep seeing on LinkedIn is a mobile-app number, and the 43% paid-trial number is a SaaS aggregation. For physical DTC, discounted first-box trials run 25-40% and free first-box trials run 15-25%. Most brands also optimize the wrong cohort. Split month-1 from steady-state before you spend a dollar on retention.
Cross-references in the cluster
The metric stacks. We have parallel cuts on subscription churn by category, AOV for subscription vs one-time, and LTV subscription vs one-time. Reading any one in isolation hides the operating picture. See average subscription churn rate by category, average ecommerce AOV subscription vs one-time, and average LTV subscription vs one-time.
For the broader ecommerce-conversion benchmark (not subscription-specific), see average conversion rate by ecommerce vertical.
Sources and methodology
Adapty State of In-App Subscriptions 2026. Sample: $3B+ in-app subscription revenue across 115,000+ apps. Reports global trial-to-paid 25.6%, health and fitness 35.0%, entertainment 19.1%, opt-in 8.9%, opt-out 31.4%. Metric = "started trial then became paying subscriber on first paid period." Not directly transferable to physical-subscription first-box conversion, but the trial-structure delta (3.5x opt-out vs opt-in) does transfer. Cross-confirmed against the RevenueCat State of Subscription Apps 2026 (115,000+ apps, $16B subscription revenue).
2026 churn-rate benchmark compilation. Reports first-month vs steady-state monthly churn by ecommerce vertical: pet 3-5%, supplements 5-8%, beauty 6-8% steady (25-40% first-month), curation boxes 10-15%, meal kits 40-50% in first 90 days. Methodology is aggregated subscription brands across categories. Sample size not publicly disclosed; cross-referenced against Recurly and Recharge published bands.
Recurly Benchmarks for Subscription Ecommerce (2026). Reports pause-vs-cancel data (25% of would-be churners pause when offered), replenishment-vs-curation 12-month retention (~45% vs ~35%), prepaid retention lift (~40% on 3 or 6-month commit).
Chewy Inc. FY2025 10-K filing. SEC EDGAR CIK 0001766502, filed March 2026. Disclosed FY2025: $12.6B net sales, $10.50B Autoship customer sales (83.3% share), 21.3M active customers, $591 net sales per active customer. Earlier fiscal years sourced from each year's "Key Operating Metrics" MD&A section. FY2019 and FY2020 Autoship-share figures are from the respective fiscal-year 10-Ks; treat the pre-FY2021 numbers as MD&A disclosures, not restated.
Lifecycle Architect Beauty Boxes Trial-to-Paid Benchmarks (March 2026). Reports median 20-35%, top quartile 40-60%+, bottom quartile under 15% for beauty box subscriptions. Confirms paid trials convert 10-20 percentage points higher than free trials.
FoundryCRO DTC Supplements and F&B Marketing Benchmarks 2026. Reports established-supplement subscription conversion at 40-70%, coffee subscription at 52-55%, snack subscription at 38%. Cross-references with the compiled vertical bands.
Multi-source DTC subscription 2025-26 syntheses (dollarpocket, Focus Digital, Rivo, IdeaFloat). Used to triangulate first-month vs steady-state churn ranges across verticals. None are primary sources individually; convergence across multiple sources at the same range is the citation basis.
Limitations. Trial-to-paid is not a uniform metric across ecommerce subscription. It is effectively three different metrics (mobile-app trial, SaaS trial, physical first-box-to-second-box) and most published benchmarks mix them. The frequently cited ~43% paid-trial number derives from SaaS B2B aggregations (Totango / OPEXEngine via Cobloom) and overshoots physical-DTC reality; for physical DTC subscription boxes specifically, Shopify 2026 benchmarks (via FoundryCRO and adjacent DTC sources) put discounted-first-box trials at 25-40% and free first-box trials at 15-25%. The Adapty 31.4% opt-out figure is also mobile-app data; cite it for the structural delta (3.5x opt-out vs opt-in), not as a physical-DTC level. Recharge does not publish a public vertical-by-vertical trial-to-paid number in its open materials, and the April 2026 Recharge → Skio acquisition ($105M) consolidates the Shopify subscription platform layer to effectively two independents (Recharge / Skio combined and Loop, plus Stay AI as a premium third), which will likely tighten the trial-flow templates operators benchmark against in 2027. Beauty-box and curation-box first-month churn data is well-documented in trade press but rarely tied to a specific named sample. Public DTC subscription pure-plays at scale are limited to Chewy. The trial-structure delta (opt-in vs opt-out) is the transferable insight; the absolute conversion numbers are category-specific.
Update cadence. This is a living benchmark, refreshed quarterly. Next refresh target: 2026-08-30 (pull Chewy Q1 FY2026 Autoship %, check for Recurly mid-year updates, recheck Lifecycle Architect beauty-box bands).
Frequently asked questions
what is the average trial-to-paid conversion rate for an ecommerce subscription in 2026?
There is no single number because trial-to-paid means three different things. Mobile-app trials run 25.6% global average (Adapty 2026). Card-required free trials in subscription commerce run about 31%. Paid or discounted first-box trials run about 43%. Physical subscribe-and-save first-box-to-second-box conversion runs 92-96% for replenishment categories and 60-70% for beauty curation boxes. Pick the metric that matches your flow before you compare.
is free trial no credit card or paid one dollar trial better for a dtc subscription brand?
Paid wins on conversion. Free no-card converts at about 9%, card-required free at 31%, and paid trials at about 43% across 2026 benchmarks. The catch is downstream retention. A too-deep first-box discount (say, 70% off) pulls in price-shoppers who churn the second box. Aim for a 30-50% off first-box anchor with card on file. That keeps the conversion lift and avoids the discount-anchor retention hit.
why does my beauty box lose 35% of subscribers after the first month while the supplement guys lose 5%?
Different products, different buyer jobs. Supplements are replenishment. Buyers re-need the product on a 30-day clock and a subscription matches the cadence. Beauty curation boxes sell novelty. Once the novelty hits, a chunk of buyers got what they wanted and leave. The supplement guys are running a higher-conversion structural game; you are running a higher-creative-lift retention game. Both can work, but stop comparing the numbers.
what is a good first-box-to-second-box conversion rate for a subscription box business?
Depends on vertical. Replenishment (pet, supplements, coffee) good is 92-95%, great is 95%+. Skincare good is 70-75%, great is 80%+. Beauty curation good is 65-75%, great is 80%+. Below those bands the leak is usually onboarding (the unboxing experience does not match the promise) or offer (the first-box discount is too steep for the price-anchor).
how do i benchmark my trial-to-paid number when shopify, recharge, and ga4 all report different conversion rates?
Pick one source-of-truth definition. We default to: trial start = card captured plus first product shipped. Trial converted = second billing succeeds (subscription renews into the second cycle). Take that off Recharge (or your subscription platform) cohort retention reports, not GA4. GA4 only sees the storefront conversion, not the billing renewal. Shopify will show the front-end checkout. Use Recharge or your billing platform for the renewal number, then check it against monthly active subscribers month over month.
should i compare my dtc subscription trial conversion to mobile app trial benchmarks (35 percent health and fitness, 25 percent average)?
No. The Adapty 25.6% and the 35% health and fitness number come from apps like Calm, MyFitnessPal, and Strava. Those are pure-digital subscriptions with a free trial mechanic. The trial-structure delta (opt-in vs opt-out 3.5x gap) transfers to ecommerce. The absolute numbers do not. Use the in-app data to argue for card-required trials internally, not as your conversion target.
is the one dollar first box discounted intro offer killing my retention or helping conversion?
It helps conversion (about 43% vs 31% on a card-required free trial). It hurts retention if the discount is deep (70%+ off) because you anchor the buyer to that price. The middle path most CFOs land on: a $1 trial or 30-50% off first box (not 70-90%) plus a card-required commitment, which keeps your 43% conversion lift and your month-3 retention. The brands that get killed by the discount-anchor are the ones who run free-or-near-free first boxes and try to renew at full price.
when do most subscription cancellations actually happen, month 1, month 3, or month 6?
Month 1. Across Recurly and Rivo 2026 data, 40-60% of cancellations happen in the first 90 days, and nearly half are made after the first delivery. Month-1 cohort churn typically runs 2-4x your steady-state monthly churn. If you report a single blended number, you are hiding the leak. Split by cohort, then attack the cohort with the highest churn.