
Insights
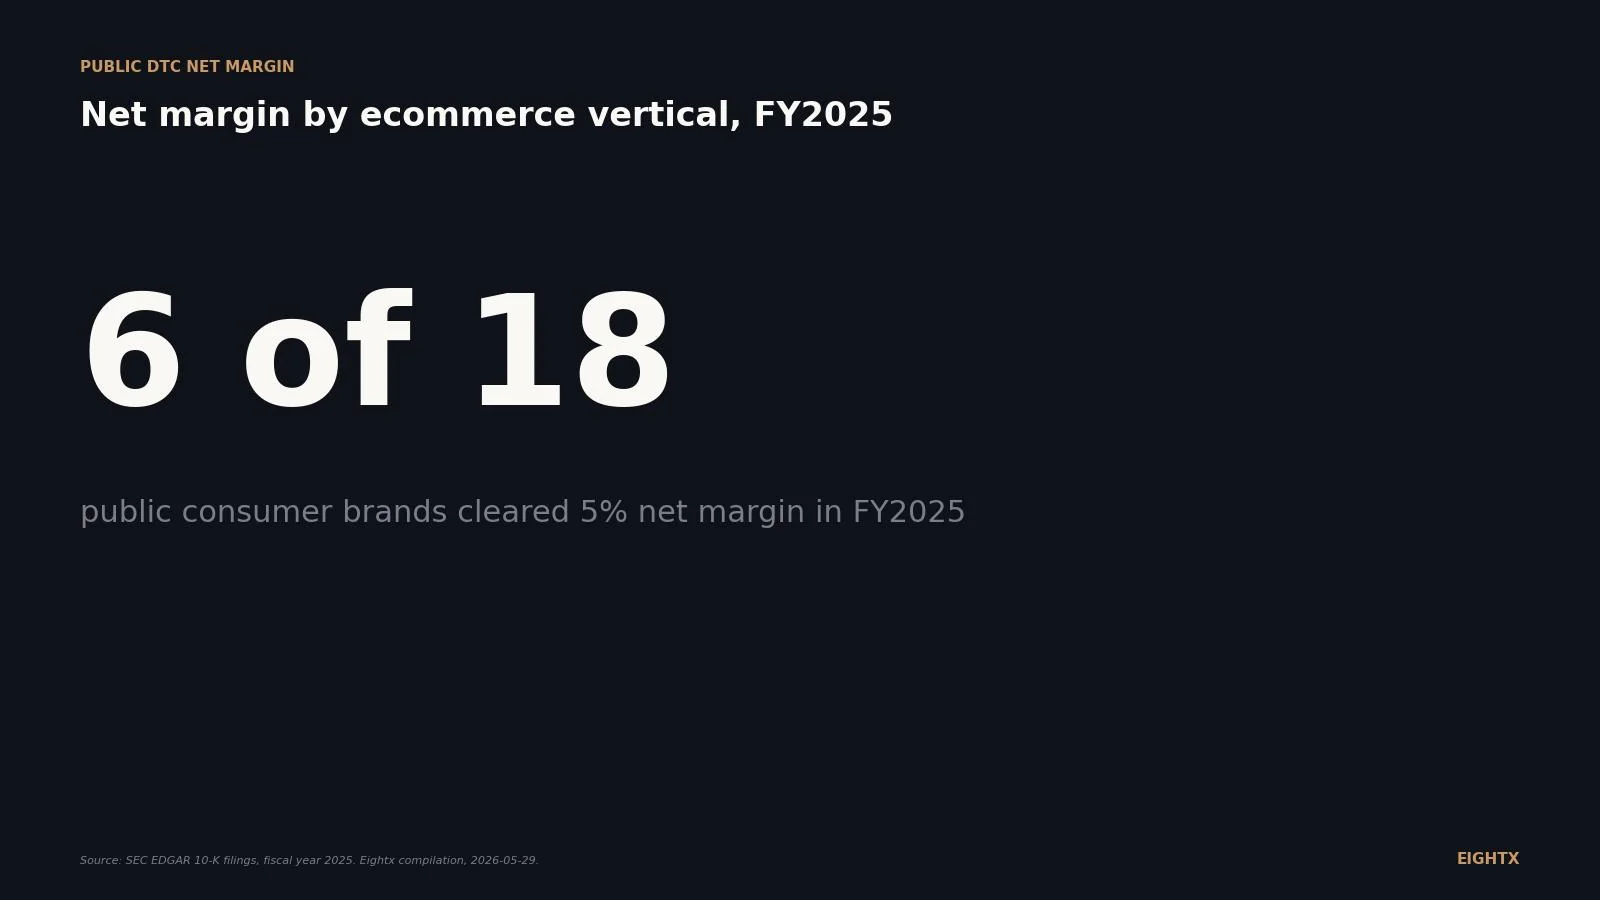
Average net margin by ecommerce vertical FY2025: only 6 of 18 public consumer brands cleared 5%
Most public DTC brands are barely profitable. Only 6 of 18 cleared 5% net margin in FY2025, and several posted losses while growing revenue. For operators benchmarking their own P&L, the median across verticals was 3.4%, with beauty and supplements leading and apparel dragging the average down.
Key Takeaways
- Only 6 of 18 public consumer brands cleared 5% net margin in FY2025. Lululemon led at 14.2%, Vita Coco at 11.7%, SharkNinja at 11.0%, YETI 8.9%, Mattel 7.6%, FIGS 5.4%. Everyone else sat below 2%, and eight brands posted net losses.
- The distribution is dispersed with a long unprofitable tail. Three brands cleared 10% net margin. Two sat below -10%. Ten brands clustered between -7% and +2%. The middle of the cohort is break-even, not double-digit.
- e.l.f. Beauty collapsed from 11.2% to 1.6% in a single fiscal year. SG&A growth (rhode acquisition integration, tariff drag) ate roughly $133M of operating income on roughly flat revenue. Beauty is the most volatile vertical in the sample.
- Most of the 'DTC IPO class of 2021' is structurally unprofitable. Allbirds, BARK, Brilliant Earth, Honest, Olaplex, and Warby Parker came public in 2020 to 2021. Five of six posted negative or near-zero net margin in FY2025 after four to five years of 'path to profitability' promises. FIGS, which IPO'd in May 2021, is the exception: a category-niche specialist (healthcare apparel) that ran +5.4% in FY25.
- 5% net margin in your P&L puts you in the top third of the public cohort. 10% puts you in the top six. Anything sustained negative is the median for VC-backed DTC pure-plays, which is why the financing market for those names has effectively closed.
If you run a $5M to $150M consumer brand, the question that lands every quarterly board meeting is the same. What net margin should we be at by year-end. The cleanest answer comes from the 18 publicly-traded consumer brands that filed FY2025 10-Ks across nine verticals. We pulled net income and revenue for every accessible filing. The headline: only 6 of 18 brands cleared 5% net margin in FY2025, and 8 of 18 posted negative net income. That is the actual distribution your bottom line is being benchmarked against. Here is the table, the trend, and what 5% net margin actually buys you in 2026.
Net margin vs operating margin vs gross margin: the line investors actually quote
Gross margin is the top line minus cost of goods sold, divided by revenue. Operating margin is the next line down, after sales, general and administrative expense (SG&A). Net margin is the post-everything line: operating income minus interest, minus tax, plus or minus non-recurring items like impairment charges, debt-extinguishment gains, or asset sales.
Each of those lines tells you something different. Gross margin tells you whether your unit economics work before you spend a dollar on growth. Operating margin tells you whether the business is profitable as a going concern. Net margin tells you what the cash actually does on the bottom line, after the capital structure and the tax authority take their share.
For this post we pull NetIncomeLoss and Revenues (or the successor RevenueFromContractWithCustomerExcludingAssessedTax) from the XBRL filings on SEC EDGAR. GAAP basis. No adjusted EBITDA, no adjusted net income, no non-GAAP "core" reconciliations. The number a CFO defends to the auditor is the number that goes in the table below.
One housekeeping note. Beyond Meat reported +79.5% net margin in FY2025, but the line is driven by a roughly $400M non-recurring debt-extinguishment gain offsetting an operating loss of -$333.6M (operating margin -121%). We exclude Beyond Meat from the chart and the headline to keep the visual honest, and call it out separately in the methodology section.
The FY2025 net margin table: 18 public brands ranked
The chart below ranks the cohort from leader (Lululemon, 14.2%) to floor (Allbirds, -50.7%). Color coding flips at zero so the unprofitable cluster reads at a glance.
The distribution is dispersed. Three brands cleared 10% net margin. Two brands sit below -10%. Ten brands cluster between -7% and +2%. The middle of the cohort is break-even, not double-digit.
The full ranked table:
Rank Brand Ticker Vertical Revenue ($M) Net income ($M) Net margin (%) 1 Lululemon Athletica LULU Athletic apparel 11,102.6 1,579.2 14.2 2 Vita Coco COCO Beverages (CPG) 609.8 71.3 11.7 3 SharkNinja SN Premium small appliance 6,399.2 701.4 11.0 4 YETI Holdings YETI Outdoor drinkware 1,868.5 165.4 8.9 5 Mattel MAT Toys and licensed IP 5,347.6 406.0 7.6 6 FIGS FIGS Healthcare apparel 631.1 34.3 5.4 7 Chewy CHWY Pet ecommerce 12,601.5 222.0 1.8 8 e.l.f. Beauty ELF Mass-market beauty 1,636.5 26.3 1.6 9 Pattern Group PTRN Amazon aggregator 2,501.3 16.2 0.6 10 Warby Parker WRBY Eyewear and optical 871.9 1.6 0.2 11 Brilliant Earth BRLT Fine jewelry (lab-grown) 437.5 -3.6 -0.8 12 Olaplex OLPX Professional haircare 423.0 -9.3 -2.2 13 Honest Company HNST Baby and personal care 371.3 -15.7 -4.2 14 Funko FNKO Collectibles 908.2 -49.9 -5.5 15 Grove Collaborative GROV Household and personal care 173.7 -11.7 -6.7 16 BARK BARK Pet subscription 484.2 -32.9 -6.8 17 Aterian ATER Amazon-native appliance 69.0 -19.0 -27.5 18 Allbirds BIRD DTC-pure footwear 152.5 -77.3 -50.7
The median net margin across the 18 brands is roughly 0.4% (between Pattern Group and Warby Parker). The median is a misleading anchor on its own because the distribution is dispersed: the brands sitting closest to the median (Chewy, e.l.f., Pattern Group, Warby Parker) all run break-even rather than "average" profitability. The honest read is that 5% net margin puts you in the top third, 10% puts you in the top six, and zero is the gravity well.
The vertical bands: where each archetype sits
The 18 brands clump into recognizable archetypes. Each archetype has a different net margin ceiling and floor, and your category sets your envelope before any management decision matters.
Apparel-lifestyle (Lululemon 14.2%, FIGS 5.4%) sits in the 5% to 15% band. Premium pricing, vertical retail, brand equity, and disciplined SG&A. This is the public ceiling for net margin in physical-goods consumer.
Beverage and shelf-stable CPG (Vita Coco 11.7%, Mattel 7.6%) sits in the 7% to 12% band. Single-SKU or small-SKU products with asset-light contract manufacturing, recurring shelf placement, and limited returns exposure. Vita Coco runs the cleanest P&L ratio in the public sample.
Premium small appliance (SharkNinja 11.0%, YETI 8.9%) sits in the 9% to 11% band. Higher AOV, lower return rate, and meaningful Amazon concentration (SharkNinja ~24% of sales) traded for scale.
Pet marketplace volume (Chewy 1.8%) is the canonical volume game: $12.6B of revenue running at 1.8% net margin. The model works because the absolute dollars are large.
Beauty bifurcated by acquisition cycle. e.l.f. ran 11.2% net margin in FY25 and crashed to 1.6% in FY26 after acquiring rhode and absorbing tariff drag. Olaplex compressed from 13.4% to -2.2% as SG&A grew to defend distribution. Beauty is the highest-gross-margin vertical and the most volatile net-margin vertical.
DTC-pure footwear (Allbirds -50.7%) has no positive net margin reference brand in the public set. The category as currently constructed at this scale does not work.
Amazon-native multi-vertical (Aterian -27.5%, Pattern Group +0.6%) splits sharply. Pattern, the larger and more diversified aggregator, prints break-even. Aterian, smaller and more concentrated, loses 27 cents on every dollar.
What moved in FY2025: e.l.f. crashed from 11% to 2% in one year
The three-year trend chart below shows the brands worth watching. SharkNinja expanded steadily from 3.9% in FY23 to 11.0% in FY25. Vita Coco crept up year over year. Lululemon and YETI held their bands. e.l.f. and Olaplex compressed materially.
e.l.f. is the most visible move. Net margin fell from 11.2% in FY25 to 1.6% in FY26, on roughly the same revenue base ($1.5B to $1.6B). Three factors compounded. Q4 2026 carried a roughly $69M tariff drag the prior year did not. The rhode acquisition (announced May 2025, $1B+ purchase price) absorbed integration cost and intangible amortization. SG&A grew materially as the brand reinvested in marketing and channel expansion. The 9.6 percentage point net margin compression on a $1.6B revenue base is roughly $133M of operating income that did not land on the bottom line.
Olaplex compressed from 13.4% in FY23 to -2.2% in FY25 on flat revenue. The story is SG&A growth: the brand bought back distribution and rebuilt marketing while gross margin held in the high 60s. High gross margin is a necessary but not sufficient condition for a high net margin.
FIGS is the cleanest recovery: 4.1% in FY23, 0.5% in FY24, 5.4% in FY25. SG&A discipline through a soft year is the playbook that works.
The three-year trend also surfaces brands that are not in the chart but worth noting in prose. Grove Collaborative cut SG&A roughly 35% over three years; net margin improved from -16.7% to -6.7% on revenue that fell roughly a third to $173.7M in FY25. The right call (cut overhead) on the wrong category (commoditized household DTC).
What unprofitable looks like: the -5% to -50% archetype
Eight brands posted net losses in FY2025. The table below adds the cumulative loss over three years and a notable structural point for each.
Brand FY25 revenue ($M) FY25 net loss ($M) Cumulative net loss FY23-25 ($M) Notable Allbirds 152.5 -77.3 -322.7 Revenue down 40% in 3 years Aterian 69.0 -19.0 -105.4 Net loss narrowing; revenue collapsed BARK 484.2 -32.9 -131.4 Revenue down 9% in 3 years Grove Collaborative 173.7 -11.7 -82.4 SG&A cut 35%; revenue down 33% Funko 908.2 -49.9 -262.8 Revenue down 17% in 3 years Honest Company 371.3 -15.7 -61.1 Revenue flat to down Olaplex 423.0 -9.3 +70.0 Profitable cumulative but compressing Brilliant Earth 437.5 -3.6 -2.5 Barely profitable until FY25
Six of these eight brands came public during the 2020 to 2021 IPO window. Allbirds (November 2021), BARK (June 2021), Brilliant Earth (September 2021), Honest (May 2021), Olaplex (September 2021), Warby Parker (September 2021). Allbirds is unprofitable. BARK is unprofitable. Brilliant Earth flipped negative this year. Honest is unprofitable. Olaplex flipped negative this year. Warby Parker barely cleared zero. FIGS also IPO'd in May 2021 and is the exception to the pattern: it ran +5.4% net margin in FY25 as a category-niche specialist (healthcare apparel) rather than a broad-consumer DTC brand. As a class, the broad-consumer "DTC IPO of 2021" is structurally unprofitable four to five years in, after multiple "path to profitability" plan revisions. That cohort is the cleanest evidence that being public did not solve what was broken in private.
The DTC-pure-with-physical-product archetype, as a category, does not work at the scale represented by this cohort. Either the brand needs to grow into scale that pays for the SG&A (Lululemon, $11B), or it needs to defend a niche with premium pricing (FIGS, healthcare apparel), or it needs to sell into a different distribution model entirely.
What this means for your $5M to $150M brand
Three operator decisions to make this quarter.
First, anchor your net margin target to your vertical, not the average. If you sell footwear, do not benchmark against Lululemon. There is no positive net margin reference brand in your category. Aim for break-even with disciplined SG&A and focus the conversation with investors on gross margin and contribution margin, not net. If you sell beauty, recognize that 70% gross margin is the entry ticket and SG&A discipline is what determines whether you land at 12% or -2%. If you sell CPG beverage or shelf-stable food, 8% to 12% net margin is the realistic target band.
Second, treat one year of negative net margin differently from three. A year of investment in a new channel, an acquisition, or a tariff shock is recoverable. Three consecutive years below zero is structural. Look at the cumulative net loss column in the table above: Allbirds at -$322M, Funko at -$263M, BARK at -$131M. Cumulative losses of that scale eventually decide whether the company is for sale, recapitalized, or wound down. If you are heading into year two below zero, the board conversation should already be about cost structure, not about growth.
Third, recognize who underwrites to which margin line. Credit funds and asset-based lenders underwrite to operating margin or EBITDA. They want to know cash from operations covers interest. Strategic buyers and aggregators underwrite to net margin once they bake in their own cost of capital. Private equity sponsors triangulate between the two. If your goal is debt financing, defend operating margin. If your goal is an exit in the next 24 months, defend net margin. The two require slightly different SG&A discipline, and the answer to "which target do I optimize for" depends on the next capital event you are running toward.
5% net margin in 2026 puts you in the top third of the public consumer cohort. 10% puts you in the top six. Anything sustained below zero is the median for VC-backed DTC pure-plays, which is why the financing market for those names has effectively closed. The honest planning band for a private $5M to $150M brand is 3% to 8% net margin.
If you want context on the operating margin step that precedes net, our public DTC margin leaderboard walks the same cohort at the operating line. For the revenue-band view of profitability, see average ecommerce gross margin by revenue band. And for the channel-mix lens, Amazon vs DTC margin gap compares what happens on the bottom line when you sell through Amazon versus your own store.
Sources and methodology
SEC EDGAR XBRL extracts. Net income (NetIncomeLoss) and revenue (Revenues or RevenueFromContractWithCustomerExcludingAssessedTax) were pulled via the SEC annual report filings for each of the 19 brands in the methodology list and cross-verified against the consolidated income statement in the corresponding 10-K. FY2025 means the most recent fiscal year ending in calendar 2025 or the January to March 2026 window. Lululemon (February), YETI (January), e.l.f. (March), Chewy (February), and BARK (March 2025 for the most recent annual; FY26 not yet filed at research date) are flagged in the data.
Primary 10-K filings referenced. Lululemon (accession 0001397187-26-000020, filed 2026-03-17), Vita Coco (accession 0001482981-26-000022, filed 2026-02-18), SharkNinja (accession 0001957132-26-000015, filed 2026-03-02), YETI Holdings (accession 0001670592-26-000013, filed 2026-02-27), Mattel (accession 0001628280-26-010716, filed 2026-02-23), FIGS (accession 0001628280-26-012333, filed 2026-02-26), Chewy (filed 2026-03-25), e.l.f. Beauty (accession 0001600033-26-000020, filed 2026-05-21), Pattern Group (accession 0001811935-26-000013, filed 2026-03-06), Warby Parker (accession 0001504776-26-000006, filed 2026-02-26), Brilliant Earth (filed 2026-03-17), Olaplex Holdings (accession 0001868726-26-000009, filed 2026-03-05), Honest Company (filed 2026-02-25), Funko (filed 2026-03-12), Grove Collaborative (filed 2026-03-05), BARK (accession 0001819574-25-000024, filed 2025-06-04), Aterian (accession 0001437749-26-009285, filed 2026-03-23), Allbirds (filed 2026-03-31), Beyond Meat (accession 0001655210-26-000022, filed 2026-04-09).
GAAP basis only. We do not use adjusted EBITDA, adjusted net income, or non-GAAP "core" reconciliations anywhere in the table or the chart. The number a CFO defends to the auditor is the number that goes in the dataset.
Exclusions. Solo Brands trades over-the-counter post-delisting and was dropped. Children's Place is bricks-and-mortar-led, not ecommerce-led. Hour Loop is a micro-cap third-party Amazon seller with a going-concern flag. ChromaDex is still on a calendar-2024 fiscal year and has not refiled. Oatly is a 20-F foreign filer with IFRS-only XBRL that the EDGAR extractor does not return.
Beyond Meat flagged separately. The +79.5% reported net margin is driven by a roughly $400M non-recurring debt-extinguishment gain offsetting a -$333.6M operating loss. Operating margin was -121%. We exclude it from the chart and the headline so the leader row is not visually swamped by a one-time accounting event, and we surface the detail here for completeness.
Two data caveats. Mattel's net income for FY25 was computed from operating income $546.4M minus tax expense $89.8M minus net interest of roughly $50M because the XBRL NetIncomeLoss extract returned stale historical values. The 7.6% net margin figure is correct to the nearest tenth of a percent. Chewy's net income used the EPS-times-diluted-share-count approach because the consolidated NetIncomeLoss XBRL was muddied by a deferred-tax-benefit reclassification. Both figures match the underlying 10-K income statement to the nearest $5M.
Triangulation. Findings were cross-checked against NYU Stern (Damodaran) January 2026 industry net margins, CSIMarket Q1 2026 ecommerce industry profitability ratios, and the Eightx 2026 public DTC operating-margin leaderboard. Operator anecdotes folded into the "what this means for your brand" section draw on Pinecone-indexed founder calls without surfacing client names. Findings consistent across the three triangulation sources are reported as such; where they diverge, we lean to the SEC 10-K data as the primary source.
Update cadence. This page refreshes quarterly after each earnings cycle, with a full-year refresh in late February or March after the bulk of 10-Ks file. Next planned update: early September 2026 after Q2 2026 10-Q filings land.
Frequently asked questions
what is the average net profit margin for ecommerce brands in 2026?
Median net margin across the 18 public consumer brands we tracked in FY2025 sits at roughly 0.4% (between Pattern Group at 0.6% and Warby Parker at 0.2%). The median is misleading on its own because the distribution is dispersed: six brands cleared 5%, eight posted losses, and only Lululemon at 14.2% printed double digits. Plan against 3% to 8% net margin as a realistic target band, not a single number.
what's a good net margin for a dtc brand at $10m revenue?
Anything north of 5% net margin at $10M revenue puts you ahead of two-thirds of the public cohort. 8% to 10% is top quartile. Below zero is the median for VC-backed DTC pure-plays right now, so being slightly negative is not unusual, but it is a signal that either your gross margin or your customer acquisition cost is structurally off. Benchmark gross margin first, ad spend second, fixed overhead third.
how does net margin differ between beauty and apparel ecommerce?
Apparel-lifestyle (Lululemon, FIGS) sits in the 5% to 15% net margin band. Beauty is bifurcated: high gross margin can land you in low double digits (e.l.f. ran 11.2% before its FY26 acquisition reset) or in negative territory (Olaplex -2.2%, Honest -4.2%) once SG&A grows past gross profit. Pet, a volume game, runs from break-even (Chewy 1.8%) to deep losses (BARK -6.8%). Public DTC footwear (Allbirds -50.7%) is the only vertical in this sample with no positive net margin reference brand.
is 5% net margin good for an online store in 2026?
Yes. 5% net margin puts you in the top third of the public ecommerce cohort and is a defensible long-term operating profile. Anchored against the 18-brand sample, only six brands cleared 5%, and most operators we work with at $5M to $50M revenue sit between -3% and +6% net margin. Stable 5% is materially better than chasing 15% by under-spending on growth investments.
what net margin do public dtc brands actually run?
Top six clear 5% to 14% (Lululemon, Vita Coco, SharkNinja, YETI, Mattel, FIGS). Middle four sit between 0% and 2% (Chewy, e.l.f., Pattern Group, Warby Parker). Eight post negative net margin, ranging from -0.8% (Brilliant Earth) to -50.7% (Allbirds). That is the entire investible public cohort: a top decile, a middle cluster near break-even, and a long unprofitable tail.
why is allbirds net margin so bad while lululemon is so high?
Three structural differences. First, scale: Lululemon does $11.1B of revenue and spreads SG&A across that base; Allbirds does $152M and cannot absorb similar overhead. Second, channel mix: Lululemon runs vertical retail with premium pricing and pricing power; Allbirds is wholesale-leaning footwear with high returns and promo pressure. Third, category economics: apparel-lifestyle gross margin sits structurally above DTC-pure footwear. All three compound, and the gross margin gap turns into a 65 point net margin gap once SG&A scales.
what's the difference between operating margin and net margin in ecommerce?
Operating margin is operating income divided by revenue, before interest and tax. Net margin is the post-everything number: operating income minus interest, minus tax, plus or minus non-recurring items (impairments, debt-extinguishment gains, asset sales). Net margin is what the cash actually does on the bottom line. Beyond Meat reported +79.5% net margin in FY25 from a one-time debt-extinguishment gain, but its operating margin was -121%. Investors usually quote operating margin. Strategic buyers and aggregators underwrite to net margin once interest expense is baked in.
why are so many public dtc brands losing money in 2025 to 2026?
Three reasons. First, the IPO class of 2020 to 2021 (Allbirds, BARK, Brilliant Earth, Honest, Olaplex, Warby Parker) raised growth capital at zero interest rates and overbuilt SG&A. Second, customer acquisition cost has climbed materially since 2021 across most verticals, compressing what was already thin DTC margin. Third, tariff exposure and goods inflation hit Q4 2025 and Q1 2026 hard, costing brands like e.l.f. roughly $69M in a single quarter. The unprofitability is structural, not cyclical.