
eCommerce
EU Ecommerce KPI Benchmarks 2026 by Country
EU ecommerce benchmarks are local, not regional. Average conversion runs about 2.1% in Germany and 1.2% in France, cart abandonment sits near 71.7%, online returns reach 25% in apparel against 11% in electronics, and EMEA carries the highest order value of any region at roughly $213.
Key Takeaways
- Germany converts at about 2.1% and France at about 1.2%, so a US 2.5%+ average makes a normal French store look broken when it is not.
- Cart abandonment sits near 71.7% (Baymard, 2025), the highest in its tracked series. Roughly 7 in 10 EU baskets never check out.
- Online returns run about 25% in apparel and 11% in electronics, and German fashion specifically runs 40 to 50% of orders. Returns are the EU's hidden margin tax.
- EMEA carries the highest average order value of any region, about $213 (Dynamic Yield). Many EU operators under-price a market that tolerates larger baskets.
- Clear a gross-margin floor before scaling paid spend. The DTC pooled median is 56.6%, and revenue-band averages cluster in a 43.7 to 48.2% range.
Most EU operators we talk to are quietly benchmarking their store against a number that was never meant for them. They read a US report that says "good" ecommerce conversion is 2.5% or higher, look at their German storefront sitting at 2.1% or their French one at 1.2%, and conclude something is broken. Nothing is broken. They are measuring a European store against a US scorecard, and the gap between "below the US average" and "above your country's average" is exactly the gap between cutting spend and scaling it. This is a benchmark scorecard rebuilt on European numbers, country by country, so you can stop comparing apples to a different orchard.
Why a US benchmark lies to a European store
Start with conversion, because it is the metric operators anchor on hardest and the one US reports distort most. In Germany, the largest EU market, average online conversion is about 2.1% as of Q1 2026 (Statista), up slightly from 2.0% a year earlier. In France it is roughly half that, around 1.2%. Italy lands lowest among the major markets at about 1.0%, and the Netherlands sits in between near 1.8%.
A US "average" of 2.5% or higher is not wrong for the US. It is just irrelevant to a French storefront. When you drop a 2.5% benchmark on a French store converting at 1.2%, the store looks like it is leaving half its revenue on the table, and the natural reaction is to slash ad spend or rip apart a funnel that is actually performing at market. When we talk to founders running EU stores at this size, the pattern we see again and again is a panic cut driven by a benchmark that was never built for their country.
The thesis for the rest of this post is simple: in Europe, benchmarks have to be local. The differences between markets are structural, not fixable. They come from payment habits, return-policy norms, and shopping culture, and no amount of conversion-rate optimization closes a one-point gap that exists because France is France and Germany is Germany.
Conversion rate by country: the EU scorecard
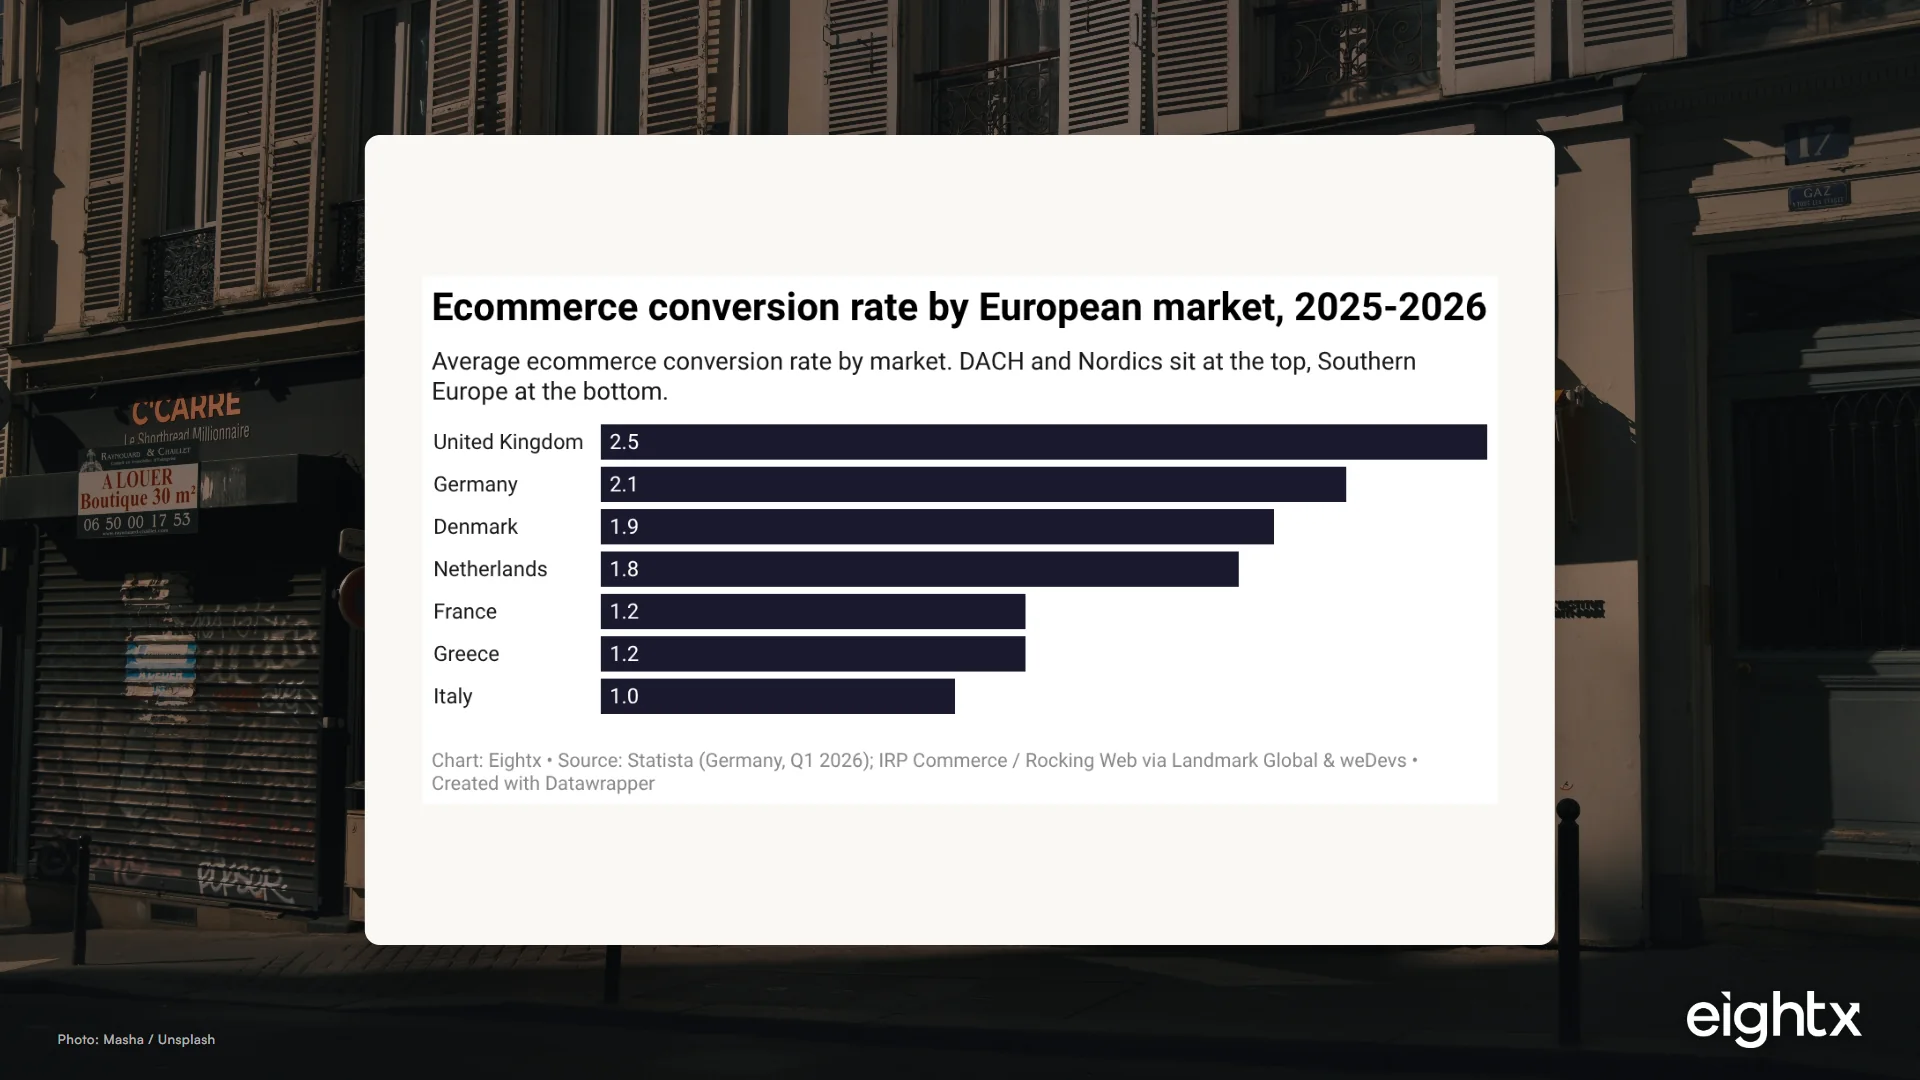
Here is the country scorecard, charted across seven markets so you can see the shape of the spread rather than a single misleading average.
The pattern is consistent: DACH (Germany, Austria, Switzerland) and the Nordics sit at the top, the UK is high on an order-level basis, and Southern Europe trails. One footnote matters before you quote the UK number. The UK order-level rate lands around 2.5%, but some Monetate and Statista UK series report 4.5 to 4.7% on a session basis. Those are not comparable. A session-level rate counts more "basket adds" and inflates the figure, so if you benchmark your order-level conversion against a session-level UK number you will feel broken for no reason.
| Country | Avg conversion rate | Notes |
|---|---|---|
| Germany | 2.1% | Q1 2026 (Statista); largest EU market |
| United Kingdom | 2.5% | order-level; session-level series run higher (4.5%+) |
| Denmark | 1.9% | Nordics, upper band |
| Netherlands | 1.8% | mature market, high return rates |
| France | 1.2% | roughly half of Germany |
| Greece | 1.2% | Southern Europe, lower band |
| Italy | 1.0% | lowest of the major EU markets |
The operator takeaway: if you sell into more than one EU country, keep one conversion benchmark per market. A blended European average will quietly flatter your weak markets and punish your strong ones, which is the opposite of what a benchmark is supposed to do.
Returns are the EU's hidden margin tax
Conversion gets the attention, but returns are where EU margin actually leaks, and the category spread is brutal.
Apparel runs about 25% of orders returned, home and furniture about 19%, footwear about 17%, beauty about 12%, and electronics about 11% (2026 estimates). Then there is the German fashion exception. In Germany specifically, online fashion returns run 40 to 50% of orders, roughly double the cross-EU apparel average, because free and easy returns are a baked-in consumer expectation and bracketing (ordering three sizes, keeping one) is the norm.
| Category | Online return rate | Margin flag |
|---|---|---|
| Apparel & Clothing | 25% | High. Germany runs 40 to 50% |
| Furniture & Home Decor | 19% | High. Reverse-logistics cost heavy |
| Footwear / Shoes | 17% | Medium-high. Bracketing common |
| Beauty | 12% | Medium. Hygiene rules limit returns |
| Electronics & Gadgets | 11% | Lower. High ticket, low size and fit risk |
Why this matters for your business: a return is not a neutral event. Every returned order carries reverse-logistics cost, inspection and restocking labor, and very often a markdown because the item cannot go back to full-price inventory. When we have struggled with this ourselves, what worked was modeling returns directly into contribution margin per order rather than treating them as a line item to clean up later. Picture a German fashion brand showing a healthy gross margin on gross orders. Run 45% returns through it, and the real contribution per net order can be less than half of what the dashboard implied. That is the difference between a channel you scale and one that quietly bleeds you while the top-line looks fine.
AOV, abandonment and the rest of the funnel
Two more funnel benchmarks round out the scorecard, and both cut against US instincts.
First, average order value. EMEA carries the highest average order value of any region, about $213 (Dynamic Yield), which is on the order of €185 at the current EUR/USD rate near 1.15, though the figure is a USD-reported EMEA blend spanning euro and non-euro markets, so read it as directional rather than a euro basket. EU shoppers tolerate larger baskets than a lot of operators assume, so importing a US instinct to discount hard or strip down bundles can leave revenue per visitor on the floor. High-ticket categories like furniture and electronics sit well above that average; consumables sit below it.
Second, cart abandonment. The average EU cart-abandonment rate is about 71.7% (Baymard, 2025), the highest in Baymard's tracked series and stable in the 68 to 72% band for a decade. Roughly 7 in 10 baskets never check out. That is the brutal denominator your conversion rate is being measured against, so an EU conversion figure that looks low next to a US number is partly just a high-abandonment market.
Stop reading conversion as a verdict on your store. In a market where 7 in 10 baskets are abandoned and a normal country rate is 1.2%, your conversion number is mostly a fact about your geography. Returns and gross margin are the metrics that actually decide whether you can afford to scale, and those are the ones to benchmark hard.
The abandonment lever is not a magic number, it is friction. Guest checkout, local payment methods (a German shopper expects different options than a French one), and showing shipping and return costs up front do more than any headline-rate target. Mobile abandons more than desktop, so fix mobile checkout before anything else.
The margin floor: what you must clear before scaling spend
Conversion and returns tell you how the funnel behaves. Gross margin tells you whether you can afford to pay for traffic at all. The DTC pooled median gross margin rebuilt to 56.6% in 2025, with a public-brand range running roughly 25 to 75%. Across revenue bands, four-band averages cluster tightly in a 43.7 to 48.2% range, so most operators are working from a similar starting point regardless of size.
Treat that as a floor, not a trophy. Until your gross margin, after returns and shipping, clears the band your category needs, every paid order is buying you a loss. When we talk to founders this size, the ones who scale cleanly are the ones who set the floor first and refuse to turn paid spend up until contribution margin per order clears it. The returns-heavy categories above, apparel and home especially, need the upper end of that range to survive their own return rates.
The macro backdrop finally helps here. The ECB cut its main refinancing rate to 2.15% in June 2025, down from 4.25% a year earlier, while EU inflation cooled from 9.2% in 2022 to 2.6% in 2024 and an estimated 2.5% in 2025.
Cheaper capital and stabilizing prices change the math on holding inventory and funding customer acquisition. It does not raise your margin floor for you, but it lowers the cost of the working capital you deploy to reach it. For the deeper read on where margins land by size, our work on average ecommerce gross margin by revenue band and how DTC gross margins held up through 2022 to 2026 carry the full series.
How to use this scorecard
Pull it together into an operator playbook. First, benchmark per country, not per region. Hold each storefront to its own market average for conversion and returns, and never let a blended European or US number set the bar. Second, model returns into contribution margin per order before you trust any profitability read, especially in apparel and especially in Germany. Third, set your gross-margin floor before you scale paid acquisition, using the 56.6% median and the 43.7 to 48.2% band as reference points and pushing toward the high end in returns-heavy categories. Fourth, treat the EMEA $213 AOV as permission to price and bundle for a market that tolerates larger baskets rather than importing a US discount reflex.
If you want help mapping these benchmarks onto your own numbers, country by country, that is exactly the work a fractional CFO does. We will tie conversion, returns, and gross margin back to your real contribution margin per order so you know which markets to scale and which to fix. Start with our interim CFO services.
Sources and methodology
This benchmark is a stitched scorecard, not a single unified survey, because no public dataset reports harmonized EU conversion, AOV, and returns by country and category for 2026. Each metric is sourced individually, and we present it that way deliberately so you can see the granularity behind every number.
Country conversion rates come from Statista (Germany at 2.1% in Q1 2026, the most-cited and best-dated EU anchor) plus IRP Commerce and Rocking Web country tables surfaced via Landmark Global and weDevs for France, Italy, the Netherlands, Denmark, Greece, and the UK. The UK figure is flagged as order-level to avoid an apples-to-oranges spike against session-level series. Cart abandonment is from the Baymard Institute, reported at 71.72% for 2025, drawn from a meta-analysis of dozens of studies and stable for a decade.
Return rates by category are 2026 estimates synthesized by Branvas, supported by Perplexity-cited industry and trade-press ranges. We label these as estimates on purpose: Eurostat does not publish ecommerce return rates, so no official pan-EU statistic exists, and the German fashion 40 to 50% range comes from DACH trade-press and association surveys rather than a government series. Average order value (EMEA at about $213) is from Dynamic Yield's benchmarks.
The macro backdrop was pulled live this cycle. ECB main refinancing-rate steps (4.25% in June 2024 down to 2.15% in June 2025) and the EUR/USD rate near 1.15 come from the ECB Statistical Data Warehouse; EU HICP inflation (9.2% in 2022 cooling to a confirmed 2.6% in 2024, with 2025 running at an estimated 2.5% since Eurostat has not yet published the realized 2025 annual figure) comes from Eurostat's prc_hicp_aind dataflow. DTC gross-margin reference points (the 56.6% pooled median and the 43.7 to 48.2% revenue-band cluster) come from our own published sibling analyses, which carry their own primary sourcing.
A market-size note for context, not benchmarking: Storeleads store counts put Germany at roughly 121,000 Shopify stores and 242,000 across all platforms, with about 8% running Klaviyo as a marketing-maturity signal. We use that only to size the market, not to estimate AOV, because the underlying revenue fields were too sparse to benchmark reliably. Where any single figure could mislead, we have footnoted the caveat in the body rather than smoothing it away.
Frequently asked questions
what is the average conversion rate for ecommerce stores in europe in 2026?
There is no single EU average that means much, because the spread between markets is wide. Germany runs about 2.1% (Statista, Q1 2026), the Netherlands about 1.8%, France about 1.2%, and Italy about 1.0%. DACH and the Nordics sit at the top, Southern Europe at the bottom. Benchmark against your country, not a regional or US blended number.
why is my french store's conversion rate so much lower than my german store?
Because that is normal. France converts at roughly half the German rate, around 1.2% against 2.1%. It reflects payment preferences, return policy norms, and shopping behavior, not a broken funnel. If your French store is near the French average and your German store near the German average, both are healthy even though the numbers look very different.
how do eu ecommerce return rates compare across fashion, beauty and electronics?
Apparel leads at about 25% of orders returned, footwear about 17%, home and furniture about 19%, beauty about 12%, and electronics about 11% (2026 estimates). The gap matters because every returned order carries reverse-logistics cost and often a markdown, so a high-return category needs a much higher gross margin to survive the same ad spend.
why are return rates so high for online fashion in germany?
German shoppers treat free, easy returns as a default expectation, so bracketing (ordering several sizes and sending most back) is common. German online fashion returns run 40 to 50% of orders, roughly double the cross-EU apparel average. If you sell fashion into Germany, you have to model returns into contribution margin per order or the channel looks profitable on paper and is not.
what gross margin should a european ecommerce brand target in 2026?
Use the DTC pooled median of 56.6% as a reference and the revenue-band cluster of 43.7 to 48.2% as a realistic working range for most brands. The point is to set a floor: until your gross margin after returns and shipping clears that floor, paid acquisition is buying you unprofitable orders. Returns-heavy categories need the higher end.
how does eu ecommerce aov differ by product category and market?
EMEA carries the highest average order value of any region, about $213 (Dynamic Yield), though high-ticket categories like furniture and electronics sit well above consumables. The practical read is that EU shoppers tolerate larger baskets than many operators assume, so under-pricing or under-bundling against a US instinct can leave revenue per visitor on the table.
what is a good cart abandonment rate for an eu ecommerce store?
Average abandonment is about 71.7% (Baymard, 2025), so anything in the high 60s to low 70s is normal, not a crisis. The lever is not chasing a magic number but removing friction: guest checkout, local payment methods, and clear shipping and return costs up front. Mobile abandons more than desktop, so fix mobile checkout first.
do i need a different benchmark for each eu country i sell into?
Yes for the metrics that move with consumer behavior, conversion and returns especially. A single EU number will flatter your weak markets and unfairly punish your strong ones. Keep one country scorecard per market you sell into, and judge each storefront against its own market rather than a blended European or US average.
Related Eightx benchmarks: EU cross-border ecommerce benchmark 2026: 28% of EU shoppers buy from another member state, and a 13% EUR rally re-priced every USD corridor and EU ecommerce penetration by country, 2026: where 78% of internet users shop online (and the 38-point gap behind the average). For hands-on help with your numbers, talk to our fractional CFO team.