
Insights
EU cross-border ecommerce benchmark 2026: 28% of EU shoppers buy from another member state, and a 13% EUR rally re-priced every USD corridor
28% of EU individuals ordered online from sellers in another member state in 2023 (Eurostat isoc_ec_ibuy), and total European B2C ecommerce turnover rose 7% to EUR 842 billion in 2024. EUR/USD ran from 1.04 to 1.17 in 16 months, repricing every USD-denominated SKU by roughly 13% without a single price-tag change. If you ship to the US from the EU, FX is the margin story, not logistics.
Key Takeaways
- 28% of EU individuals ordered online from sellers in another EU country in 2023 (Eurostat isoc_ec_ibuy). 23% ordered from rest-of-world sellers. Cross-border is no longer a niche behavior inside the EU.
- Total European B2C ecommerce turnover rose 7% to €842B in 2024 (EuroCommerce European E-commerce Report 2025), up from €784B in 2023. Caveat: that's Europe (EU+UK+CH+NO), not strictly EU-27.
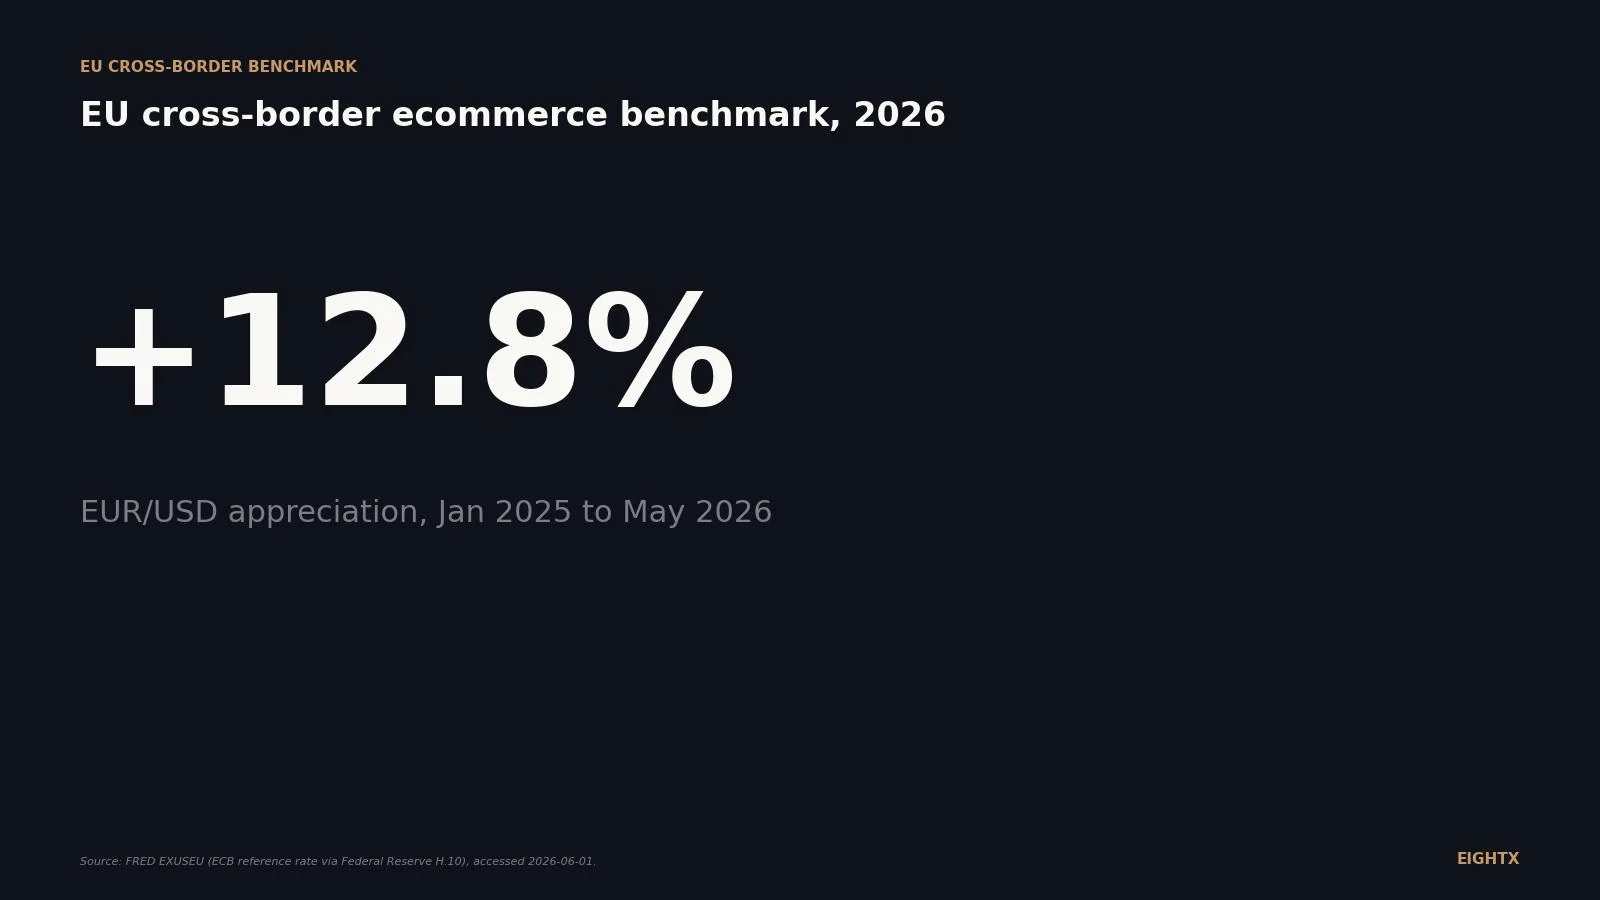
- EUR/USD ran from 1.0356 in January 2025 to 1.1681 in May 2026: +12.8% in 16 months (FRED EXUSEU). Every EU brand selling into the US gave back roughly 13% of margin on USD-denominated SKUs unless they re-priced.
- UK-EU corridor FX risk is materially smaller. EUR/GBP moved only 3 to 4% over the same window. If you ship between the UK and the EU, FX is not your story. If you ship to the US from the EU, it is.
- EU enterprises generated 19.49% of total turnover from e-sales in 2024 (Eurostat isoc_ec_eseln2). The other-EU destination share inside that number is the official cross-border supply measure, and it has to be pulled per country.
If you sell into the EU, or out of it, you are running two ecommerce businesses at the same time in 2026. One is a demand business where 28% of EU individuals now routinely order online from sellers in another member state, and the total European B2C market just printed EUR 842 billion. The other is a foreign-exchange business, because EUR/USD ran from 1.04 to 1.17 in 16 months and re-priced every USD-denominated SKU in your catalog without you touching a price tag. This is the benchmark read for EU and UK-EU operators who treat "cross-border" as a marketing toggle when it is, in practice, a margin instrument.
The 28% number: what intra-EU cross-border actually looks like in 2026
The headline demand figure comes from Eurostat table isoc_ec_ibuy. In 2023 (latest official release), 28% of EU individuals aged 16-74 ordered goods or services online from sellers in another EU country in the last 12 months. Another 23% ordered from rest-of-world sellers. That is the official, harmonized, EU-27-aggregate number for cross-border online buying behavior.
A few things to know before you cite it. First, it is a shopper-count, not a GMV figure. It tells you what share of EU individuals reached across a border, not what share of EU ecommerce euros did. Second, the country dispersion is large. Luxembourg, Malta, Ireland, and Austria typically sit at the top of the cross-border share in recent Eurostat releases because their domestic ecommerce supply is shallow, so locals naturally reach into Germany, France, or the Netherlands. Germany, France, Italy, and Spain typically sit toward the bottom because their domestic catalogs are deep enough that the median shopper does not need to cross a border.
Third, the trend is structural. The 28% figure has risen meaningfully since the mid-2010s, when the EU Digital Single Market was first being wired together. That rise is the combined effect of Pan-European Amazon FBA, harmonized VAT (the IOSS / OSS rollout in 2021), faster intra-EU parcel networks, and a generation of EU shoppers who grew up with Marketplace.
For the supply side, Eurostat table isoc_ec_eseln2 reports that EU enterprises generated 19.49% of total turnover from e-sales (web + EDI) in 2024. The "other EU" destination share inside that number is the official cross-border supply measure. It has to be pulled per country, but the aggregate tells you ecommerce is now a fifth of EU enterprise turnover, and a non-trivial share of it crosses an internal border.
The €842B map: who's selling, who's buying, where the corridors run
Total European B2C ecommerce turnover hit EUR 842 billion in 2024, up 7% from EUR 784 billion in 2023, according to the EuroCommerce European E-commerce Report 2025 (light edition). The honest caveat: "Europe" in that figure includes the UK, Switzerland, and Norway alongside EU-27. Stripping UK, CH, and NO from the total gets you closer to a EUR 700 billion EU-27 working estimate (a rough subtraction by us, not an official Eurostat or EuroCommerce EU-27 figure), which lines up with Statista's separate forecast of US$701.73 billion for the European ecommerce market in 2026 (paywalled, used for triangulation only; a mixed EU plus non-EU Europe figure).
The corridor story is qualitative in the public data. Cross-Border Commerce Europe's TOP 500 report has the ranked GMV table behind a paywall, but the dominant corridors are consistent across every public commentary we have seen:
Corridor Direction Why it works Germany to Austria Outbound Shared language, low FX risk, dense parcel logistics, Amazon.de cross-listed Germany to Netherlands Outbound Pan-EU FBA destination, short transit, NL as logistics hub for further reach Germany to France Outbound Largest intra-EU corridor in absolute GMV by qualitative read France to Belgium Outbound Shared French-language Wallonia overlap, same Carrefour / FNAC retail brands France to Luxembourg Outbound Small market but very high cross-border intensity per capita Netherlands to Germany Outbound NL logistics-hub effect, bol.com to DE marketplaces Belgium to France Outbound Language overlap, Walloon e-commerce concentration
The category mix on those corridors is also consistent: fashion and apparel lead, followed by consumer electronics and media, home and garden, cosmetics and personal care, and sporting goods. That mirrors what Eurostat reports for category-level online purchase incidence among individuals.
The FX swing your CFO missed: EUR up 13% vs USD, 3-4% vs GBP
This is the part of the cross-border story most operators are mis-reading in 2026. EUR/USD ran from 1.0356 in January 2025 to 1.1681 in May 2026, a 12.8% EUR appreciation in 16 months. For an EU seller pricing in USD into the United States, every USD of revenue now converts to roughly 13% fewer euros. If the USD price list did not move, the EUR-denominated revenue translation took the full 13% hit. The actual margin hit is smaller to the extent your USD-denominated costs (US 3PL, US ad spend, US-sourced inventory) also fell in EUR terms, so the headline 13% is the revenue-translation number, not a clean margin number for every operator.
The full monthly path is in the chart above and the table below.
Pair Jan 2025 May 2026 Change Implication for the EU seller EUR/USD 1.0356 1.1681 +12.8% USD prices buy ~13% less in EUR. Margin compression on US-bound SKUs unless re-priced. GBP/USD 1.2354 1.3498 +9.3% GBP appreciated less than EUR. UK-priced exporters to the US gave back less. EUR/GBP (implied) ~0.838 ~0.866 +3.3% UK to EU and EU to UK corridor barely moved on FX.
The two-exposure picture matters because EU operators often run a single "international" line in their P&L and miss that the US slice moved 4x more than the UK slice. The chart below makes that gap visible.
Three things to do this quarter if you have material USD revenue. First, re-price your USD list against a target gross margin set in EUR, not USD. If your USD product page still reads $49.99 against a EUR-base cost, your real margin has fallen by roughly the full 13%. Second, look at your fulfillment routing. If you can shift a portion of US demand to a US 3PL on USD-denominated COGS (or US-domiciled inventory you bought before the EUR run), you offset the FX hit. Third, if USD revenue is more than 20% of total and over EUR 500K per quarter, run the math on a 60 to 90 day EUR/USD forward layer covering 50 to 70% of expected receipts. Below that scale, the bank fees usually outweigh the protection. The 20%, EUR 500K, and 50 to 70% thresholds are Eightx operator rules of thumb from our finance practice, not a published industry benchmark, so your treasury policy should set its own bands.
Reading Eurostat properly: isoc_ec_ibuy vs isoc_ec_eseln2
The two Eurostat tables that matter for cross-border ecommerce measure different things, and operators routinely confuse them.
isoc_ec_ibuy measures individuals. It is a household survey of people aged 16-74 reporting whether they bought online from sellers in their own country, other EU countries, or rest of world in the last 12 months. It gives you the 28% headline. It tells you nothing about euros spent or basket size.
isoc_ec_eseln2 measures enterprises. It is a survey of EU companies reporting e-sales (web sales plus EDI) as a percentage of total turnover, split by destination. The 19.49% aggregate for 2024 is here. The cross-border destination share (other EU + rest of world) sits inside that figure and has to be pulled per member state, because the EU-aggregate publication does not break it out as a single headline number.
For an EU operator, the supply-side table is the more practical reference, because it tells you how much of your country's enterprise online turnover is already routed abroad, and against what destination mix. Use the databrowser to pull the latest country line, not the EU-27 average, when you are sizing a corridor opportunity.
What this means for your 2026 plan
Three operator decisions land out of the 2026 numbers.
Pick your next corridor on FX tailwind, not just market size. Germany to France is the biggest absolute opportunity in the data, but the marginal corridor is the one where your home-country pricing translates to a tailwind, not a headwind. For EU exporters, that is currently the US (you have FX in your favor if you set USD prices to match the new rate). For EU-to-EU, that's a wash on FX and the decision is about catalog gap, parcel cost, and VAT routing under OSS.
Re-price your USD list quarterly, not annually. The 16-month EUR/USD move ran in 13 separate monthly segments, not one continuous jump. By qualitative read of the monthly path, a brand that re-priced once per quarter caught the FX drift in steps and held onto a meaningful majority of the 13-point translation; a brand that re-priced once a year took most of the hit before adjusting. Quarterly is the floor for any seller with USD revenue above 10% of total.
Run Pan-EU FBA against a UK-DE ground-freight pair only when your SKU mass and turn justify it. Pan-European FBA looks cheap on a per-corridor basis but charges intra-EU placement and storage fees that eat into margin on slow-moving SKUs. By Eightx operator experience (not a published benchmark), the break-even sits somewhere in the mid-single-digit turns-per-year range for typical DTC SKU economics. Run your own math on storage plus placement fees against your actual turn. If you can't justify it, a UK-DE or DE-FR ground-freight relay on your own inventory is usually cheaper.
The 28% Eurostat number says cross-border is no longer optional inside the EU. The 13% EUR/USD move says your CFO is now the second product manager on every USD price tag in your catalog. The brands that re-price every quarter and route fulfillment against the FX tailwind hold the margin. The ones that update the USD price tag once a year give it all back.
Living index update log
This is a Group A living-index post. Refreshed quarterly. Last refresh: June 2026.
Q1 2026 baseline: EUR/USD 1.1557 (March 2026 monthly average); EU-27 individual cross-border share 28% (Eurostat 2023 release, latest); European B2C ecommerce GMV EUR 842 billion (EuroCommerce 2024).
Next refresh target: September 2026. We will extend the FX chart through Q3 2026, pull the next Eurostat isoc_ec_ibuy release if it lands (typically Q4 each year for prior-year data), and check whether EuroCommerce has updated the European E-commerce Report.
Sources and methodology
Eurostat E-commerce statistics, individuals (isoc_ec_ibuy). Headline used: percentage of individuals aged 16 to 74 who ordered goods or services online from sellers in other EU countries in the last 12 months. Latest data point referenced in the Eurostat Statistics Explained article and databrowser is 2023. Pulled directly from the Eurostat databrowser at ec.europa.eu/eurostat/databrowser/view/isoc_ec_ibuy. The 28% figure is the EU-27 aggregate; country-level rows are downloadable from the same table. Limitation: shopper-count measure, not GMV.
Eurostat E-commerce statistics, enterprises (isoc_ec_eseln2). Headline used: 19.49% of EU enterprise turnover from e-sales (web plus EDI) in 2024. Pulled from Eurostat databrowser. The "other EU" destination share inside this table is the official cross-border supply measure. Limitation: survey methodology mixes B2B and B2C; the cross-border destination split is not published as a single EU-27 headline indicator and must be aggregated per country.
EuroCommerce / Ecommerce Europe European E-commerce Report 2025 (light edition). Used for total European B2C ecommerce turnover (EUR 842B in 2024, up 7% from EUR 784B in 2023). Light edition does not disclose corridor-level GMV or country-by-country cross-border shares; those sit in the paid full report. "Europe" in the EuroCommerce figure is EU+UK+CH+NO, not EU-27 only.
FRED EXUSEU and DEXUSUK (Federal Reserve H.10 release, ECB reference rate). Monthly average U.S. dollars per euro (EXUSEU) and U.S. dollars per UK pound (DEXUSUK), January 2022 through May 2026. Data pulled from fred.stlouisfed.org. EUR/GBP cross rate computed from monthly EXUSEU divided by DEXUSUK. Limitation: monthly averages of daily rates; intra-month volatility is not captured. The European Central Bank publishes the underlying daily reference rate at ecb.europa.eu.
Statista European ecommerce forecast. Cross-referenced for triangulation only (Statista's US$701.73 billion 2026 projection is mixed EU plus non-EU Europe). Not cited as primary source; figures are paywalled.
Limitations and open questions. Exact ranked corridor GMV is in the Cross-Border Commerce Europe TOP 500 report, which is paywalled. For the v1 release we use the qualitative DE/FR/NL/BE corridor list from EuroCommerce public commentary and Eightx editorial read. Per-country Eurostat isoc_ec_eseln2 other-EU destination shares are not yet aggregated in this post; planned for the September 2026 refresh.
Update cadence. Quarterly. Next refresh target: September 2026, scheduled against the next FRED EUR/USD month-close and the typical Q4 Eurostat E-commerce statistics annual update.
For related operator reads, see the DTC layoff and hiring tracker for public-company workforce signals, and the interim CFO services overview if you need help wiring quarterly re-pricing into your finance cadence.
Frequently asked questions
how much of eu ecommerce is actually cross-border in 2026?
On the demand side, 28% of EU individuals (aged 16-74) ordered online from sellers in another EU country in 2023, the latest Eurostat figure. Another 23% ordered from rest-of-world sellers. On the supply side, EU enterprises generated 19.49% of total turnover from e-sales in 2024, with a meaningful slice destined for other EU customers.
what's the eu cross-border ecommerce market size in euros?
Total European B2C ecommerce turnover hit EUR 842 billion in 2024, up 7% from EUR 784 billion in 2023, per the EuroCommerce European E-commerce Report 2025. That figure covers Europe (EU+UK+CH+NO), not strictly EU-27. Stripping UK, Switzerland, and Norway brings EU-27 closer to roughly EUR 700 billion as a working estimate.
which eu country buys the most cross-border online?
Luxembourg, Malta, Ireland, and Austria typically top the share of individuals buying from sellers in another EU country, because their domestic ecommerce supply is shallow. Germany, France, Italy, and Spain typically sit toward the bottom of that share because their domestic ecommerce supply is deep. Pull the country breakdown from Eurostat isoc_ec_ibuy directly.
how did the eur/usd rally affect eu ecommerce sellers in 2025 and 2026?
EUR/USD ran from 1.0356 in January 2025 to 1.1681 in May 2026, a 12.8% EUR appreciation. For an EU seller pricing in USD into the United States, every USD of revenue now converts to roughly 13% fewer euros. If the price list did not move, margin compressed by the full FX delta. The fix is a quarterly re-price plus a hedging conversation, not a one-off.
what's the fx exposure for an eu brand selling into the uk?
Materially smaller. GBP/USD ran from 1.2354 to 1.3498 over the same window, +9.3%, but because EUR moved 12.8%, the cross rate EUR/GBP only appreciated about 3.3%. If your USD list stayed flat you lost 13% in margin; if your GBP list stayed flat you lost about 3%. The UK-EU corridor is not the FX story.
should we hedge eur/usd if we're an eu ecommerce brand?
If your USD revenue is more than roughly 20% of total and the absolute size is more than EUR 500K per quarter, the math usually works for a 60-90 day forward layer on 50-70% of expected receipts. Below that, the bank fees and operational overhead chew up the protection. The bigger lever for most EU operators is the price list, not the hedge.
how do i find my country's cross-border ecommerce share on eurostat?
Go to the Eurostat databrowser table isoc_ec_ibuy. Filter on the indicator 'individuals who bought online in the last 12 months from sellers in other EU countries' and pick your country and year. For the supply side, table isoc_ec_eseln2 has enterprise e-sales by destination (domestic, other EU, rest of world).
is intra-eu cross-border growing or is total ecommerce just growing?
Both, but cross-border is growing faster. The 28% share of individuals buying from other EU sellers is a structural rise versus 2015-2020 baselines. Total European B2C turnover grew 7% in 2024. The cross-border slice of that growth is outpacing domestic in most member states, driven by Pan-European fulfillment, Single Market parcel deals, and category gaps in smaller economies.