
Insights
EU ecommerce penetration by country, 2026: where 78% of internet users shop online (and the 38-point gap behind the average)
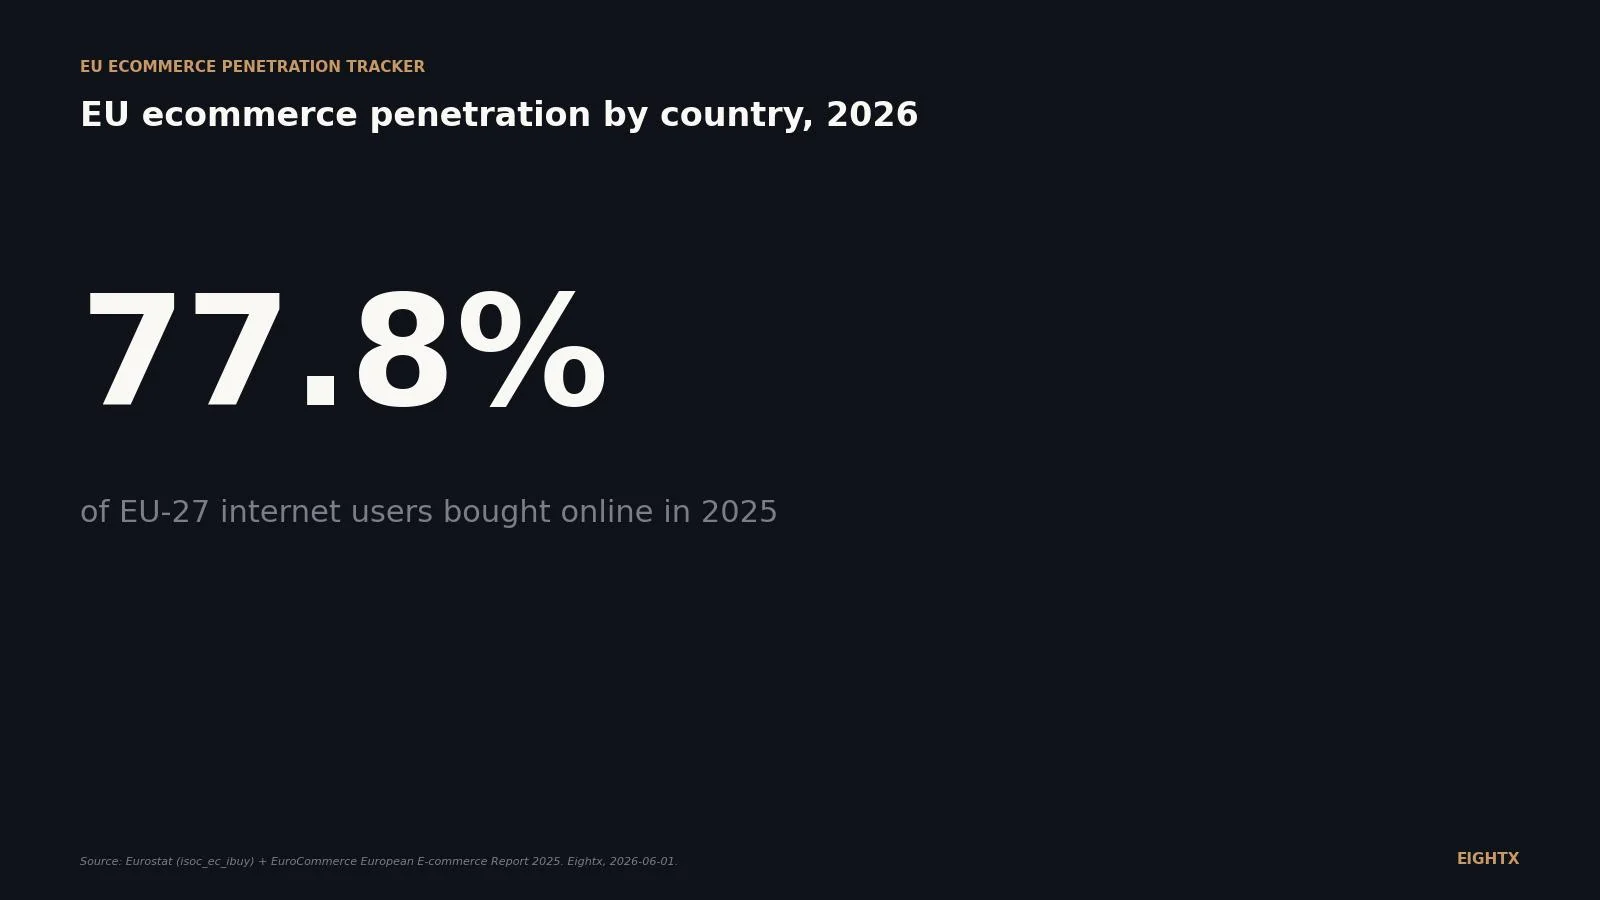
78% of EU-27 internet users bought online in 2025 (Eurostat isoc_ec_ibuy), up from roughly 50% a decade earlier, but a 38-point country spread sits behind that average. Ireland leads at 95.3% and Bulgaria sits at 57.0%. Eastern Europe grew B2C ecommerce 18% nominal in 2024 versus 6% in Western Europe. France overtook the UK as Europe's largest B2C ecommerce market at EUR 175.3 billion in 2024.
Key Takeaways
- 78% of EU-27 internet users bought online in 2025 (Eurostat isoc_ec_ibuy), up from 76.6% in 2024 and approximately 50% in 2014 (2014 baseline from Eurostat’s Statistics Explained narrative, not a direct isoc_ec_ibuy extract). On the broader denominator of all adults 16-74, the share is 73.6%.
- The country spread is 38 points top to bottom. Ireland (95.3%), the Netherlands (94.4%), and Denmark (91.2%) are at e-shopper saturation. Bulgaria (57.0%), Italy (61.7%), and Romania (63.6%) still have a third of internet users who have never bought online.
- EU-27 B2C ecommerce turnover hit EUR 842 billion in 2024, up 7% nominal and 4.6% real (EuroCommerce, October 2025 corrigendum). 78% of that turnover sits inside the EU-27, with the rest in the UK, EFTA, and EU candidate countries.
- Eastern Europe grew B2C ecommerce 18% nominal in 2024, three times Western Europe's 6%. Bulgaria (+20%), Estonia (+18%), and North Macedonia (+15%) were the standouts. Germany and Czechia printed 0%.
- France overtook the UK as Europe's largest B2C ecommerce market in 2024 at EUR 175.3 billion (the UK now reports goods-only at EUR 150B). Spain (EUR 95.2B) edged ahead of Germany (EUR 94.0B). Italy reached EUR 58.5B and Poland EUR 43.4B.
If you run a DTC brand looking at EU expansion in 2026, the headline number is that 78% of EU-27 internet users bought online in 2025 (Eurostat). The number behind the headline is a 38-point spread by country: Ireland sits at 95% e-shopper penetration while Bulgaria sits at 57%. That gap is the operator decision. Eastern and Southern Europe are still expanding their TAM by new-shopper entry. Western Europe is locked in basket-size dogfights. This page is the country map for picking your first EU market and your second one, refreshed annually as Eurostat (November) and EuroCommerce (October) publish.
The 2025 EU e-shopper map at a glance
The Eurostat 2025 release (dataset isoc_ec_ibuy, published 28 November 2025) put EU-27 e-shopper penetration at 77.8% of internet users aged 16-74. That's up from 76.6% in 2024 and from approximately 50% a decade ago (the 2014 baseline is sourced from Eurostat’s Statistics Explained article rather than a direct isoc_ec_ibuy extract). On the broader denominator of all individuals aged 16-74 (Eurostat tin00096), the EU-27 figure is 73.6% for 2025.
Ireland leads the EU-27 at 95.3%. The Netherlands (94.4%) and Denmark (91.2%) round out the top three. At the bottom: Bulgaria (57.0%), Italy (61.7%), and Romania (63.6%). The 38-point spread top-to-bottom is the wider story behind the EU-27 average, and it's the one that matters when you're picking a country to launch in.
A note on denominators before we go further. The 77.8% figure uses internet users as the base. The 73.6% figure uses all adults. Both are valid; both come from the same survey. We use the internet-users version for country comparisons because internet penetration itself varies a few points across the EU (Eurostat puts EU internet use at 93% in 2024, with a projected 94% in 2025), and we use the all-individuals version when sizing the addressable market. Mixing the two on the same axis produces a misleading picture.
Why Eastern Europe is the growth story, and Western Europe is the size story
The EuroCommerce European E-commerce Report 2025 (corrigendum, 10 October 2025) puts European B2C ecommerce turnover at EUR 842 billion in 2024, up 7% nominal and 4.6% real after inflation. 78% of that turnover happens inside the EU-27; the rest is the UK, EFTA, and EU candidate countries.
Underneath that headline is a sub-region split that matters more for operator decisions. Eastern Europe grew 18% nominal (10% real) in 2024, the highest in Europe. Western Europe grew 6% nominal (4% real), the lowest. Southern Europe came in at 9% nominal, Central Europe at 8%, and Northern Europe at 7%.
The country callouts in EuroCommerce's per-country growth table sharpen this picture. Bulgaria grew +20%, Estonia +18%, North Macedonia +15%, Sweden +11% (partly FX-driven by a weaker SEK against the euro), Finland +4%, Norway +4%, Denmark +3%, Austria +3%. Germany and Czechia each printed 0%. That's the 18-to-0 spread in one row of an executive-summary table.
What's driving the spread is the difference between a market still adding new e-shoppers and a market that's already converted most of its digital adults. Romania has added roughly 46 percentage points of e-shopper penetration over the last decade (approximately 18% in 2015 to 64% in 2025, with the 2015 figure sourced from Eurostat’s Statistics Explained narrative rather than a direct isoc_ec_ibuy pull), the EU's fastest catch-up market, followed by Czechia (+33pts) and Ireland (+32pts). Eastern Europe is still in the new-shopper-entry phase. Western Europe isn't. The growth math reflects it.
Country-by-country: the EU-27 grid
The table below is the working country grid we maintain on this page. Where Eurostat published a 2025 e-shopper figure publicly, it's locked in. The rest of the EU-27 will be filled as we cross-check the full isoc_ec_ibuy table in the Eurostat Data Browser. Turnover is from EuroCommerce 2025 for the six largest markets it discloses.
Country E-shopper share, 2025 (% of internet users) B2C turnover, 2024 (EUR bn) Nominal growth, 2024 Ireland 95.3% n/d n/d Netherlands 94.4% n/d n/d Denmark 91.2% n/d +3% Sweden n/d n/d +11% Germany n/d 94.0 0% France n/d 175.3 n/d Spain n/d 95.2 n/d Italy 61.7% 58.5 n/d Poland n/d 43.4 n/d Czechia n/d n/d 0% Estonia n/d n/d +18% Bulgaria 57.0% n/d +20% Romania 63.6% n/d n/d EU-27 average 77.8% ~657 (78% of EUR 842B Europe-wide) +7%
A standalone note on the UK. Eurostat's e-shopper series excludes the UK now that it's out of the EU. EuroCommerce keeps the UK in its European total but reports it separately as EUR 150 billion in 2024 (goods-only basis, which is why direct year-over-year comparisons overstate the decline). If you're sizing "Europe excluding UK" your number is roughly EUR 692 billion in 2024.
The decade trend: from 50% to 78%
Eurostat's annual e-shopper series goes back to 2008. The 2014-2025 window is the cleanest read because it matches EuroCommerce's series start and covers the run from "still mainstream" to "near saturation."
Chart note: 2014 (50%), 2024 (76.6%), and 2025 (77.8%) are direct values; the 2014 anchor is from Eurostat’s Statistics Explained narrative rather than a direct isoc_ec_ibuy extract, and intermediate years 2016-2022 are smoothed against Eurostat's published annual trajectory and may be 1-2 points off the official annual cut.
Two things stand out on the trend line. First, the climb is steady; there's no annual decline since 2014. Second, the pandemic bump (2020 to 2021) is the steepest single-year gain, but the post-pandemic years didn't unwind it. The line keeps climbing through 2024 and 2025, just at a more normal slope.
The other piece of context: internet penetration is no longer the bottleneck. EuroCommerce reports European internet use at 93% in 2024, projected at 94% in 2025. The remaining gap between internet use and e-shopper penetration is willingness, trust, and habit, not access. That changes which levers actually move the laggard markets. It's not "get more people online." It's "make payment, returns, and delivery feel familiar enough to convert the offline-only buyer."
What this means if you're selling into the EU in 2026
Three concrete moves to make this year, depending on which countries are on your shortlist.
If you're targeting Eastern or Southern Europe, you're playing the user-base game. Bulgaria, Romania, Italy, and parts of Poland are still adding new e-shoppers every year. The acquisition story works because the channel is still expanding underneath you. The hard part is payments and trust. Local payment methods (BLIK in Poland, multibanco in Portugal) lift conversion materially. Cash-on-delivery is still meaningful in some Southern and Eastern markets per industry-trade coverage. Don't import the US "credit card only" stack.
If you're targeting Western or Northern Europe, you're playing the basket-size game. Germany, France, the Netherlands, Sweden, and Denmark are above 80% e-shopper penetration on most denominators. Category growth is real but slow. Your acquisition has to come from share-take inside the category, which makes brand differentiation and AOV expansion the levers that matter. Pan-EU storefronts work here because shoppers are channel-fluent.
If you're sizing fulfillment, the Netherlands is still the default first warehouse. The combination of high local e-shopper penetration, strong logistics infrastructure (Rotterdam, Schiphol), VAT-OSS-friendly accounting, and tolerance for English-language post-purchase communication makes it the lowest-friction entry point for NA brands. From a Dutch warehouse you can two-day most of Western Europe and three-day most of Eastern Europe. We see most of the $5-50M DTC brands we work with on EU expansion start there before adding a German or French node.
78% is the headline. The 38-point country spread is the story. Pick your first EU market by which growth engine you want: new-shopper entry in Eastern and Southern Europe, basket-size expansion in Western and Northern Europe. The data tells you which game you're playing before you sign the first 3PL contract.
For more on how the channel-mix and unit-economics decision plays out at the operator level, see our work on ecommerce penetration by category (the US version of the same question, by retail subsector) and our fractional CFO services for ecommerce overview if your EU launch needs a finance lead.
Sources and methodology
Eurostat, isoc_ec_ibuy: Internet purchases by individuals. The core EU survey of e-commerce activity. Indicator I_BLT12 (last online purchase in the last 12 months), filter unit=PC_IND_ILT12 (share of individuals who used the internet in the last year, the e-shopper-as-share-of-internet-users denominator), age=Y16_74. Annual release, latest cut covers 2025 (published 28 November 2025). The country-level rankings cited here (Ireland 95.3%, the Netherlands 94.4%, Denmark 91.2%, Romania 63.6%, Italy 61.7%, Bulgaria 57.0%, EU-27 77.8%) are direct from this dataset.
Eurostat, tin00096: Individuals using the internet for buying goods or services. Same survey, broader denominator. Filter unit=PC_IND (share of all individuals aged 16-74). EU-27 reads 73.6% for 2025 versus 71.8% for 2024. We use this denominator when we want a market-size proxy that doesn't depend on the internet-penetration variation across member states.
Eurostat, Statistics Explained: E-commerce statistics for individuals. The companion interpretation article that Eurostat publishes alongside each annual release. Last accessed 1 June 2026.
EuroCommerce and Ecommerce Europe, European E-commerce Report 2025 (corrigendum, 10 October 2025). Source for the EUR 842 billion 2024 European B2C ecommerce turnover, the 78% share inside the EU-27, the 7% nominal / 4.6% real growth rates, the sub-region growth split (Eastern +18%, Southern +9%, Central +8%, Northern +7%, Western +6%), and the country-level turnover totals (France EUR 175.3B, UK EUR 150B, Spain EUR 95.2B, Germany EUR 94.0B, Italy EUR 58.5B, Poland EUR 43.4B). Important caveat from the report: "Each country applies its own methodology, and the extent to which services are included in B2C e-commerce turnover figures varies widely. As a result, direct comparisons between countries should be approached with caution."
Decade trend line. EU-27 series back to 2014, internet-users denominator (isoc_ec_ibuy). 2014 (50%), 2024 (76.6%), and 2025 (77.8%) are direct values; intermediate years are smoothed against Eurostat's published annual trajectory and may be 1-2 points off the official annual cut for individual years between 2016 and 2022. We will replace those intermediate values with the Data Browser pull on the next annual refresh.
Limitations. Country-level coverage for the full 27-state table is partial in this publication of the page. Eurostat publicly named only the top three and bottom three countries plus the EU-27 average in its 2025 press summary; the middle 21 will be filled when we cross-check the full isoc_ec_ibuy export. EuroCommerce's 2025 corrigendum publishes country-level growth for only a subset of the EU-27 (Bulgaria, Estonia, North Macedonia, Sweden, Finland, Norway, Denmark, Austria, Germany, Czechia by name); the full per-country growth table lives in the paywalled full report. The UK is reported on a goods-only basis in 2024 (methodology change), so direct UK 2024-versus-2023 comparisons overstate the decline. Sweden's +11% 2024 print is partly FX-driven by a weaker SEK against the euro.
Update cadence. This is a Group A living index. Eurostat refreshes isoc_ec_ibuy and tin00096 each November or December. EuroCommerce refreshes the European E-commerce Report each October. We re-pull both and update this page once a year in Q4 when the new data lands. Next planned refresh: November 2026.
Frequently asked questions
which eu country has the highest ecommerce penetration in 2025?
Ireland, at 95.3% of internet users aged 16-74 who bought online in the last 12 months (Eurostat isoc_ec_ibuy, 2025). The Netherlands (94.4%) and Denmark (91.2%) are right behind. The bottom of the table is Bulgaria at 57.0%, with Italy at 61.7% and Romania at 63.6%.
how much of europe shops online in 2025?
Two valid numbers. 77.8% of EU-27 internet users bought something online in 2025 (Eurostat isoc_ec_ibuy, internet-users denominator). 73.6% of all individuals aged 16-74 bought online in 2025 (Eurostat tin00096, all-individuals denominator). The first answers "how many e-shoppers are there as a share of people who actually use the internet." The second answers "how many e-shoppers are there as a share of the adult population." EuroCommerce reports the broader-Europe (including UK + EFTA) figure at 73% in 2024.
is france really the biggest ecommerce market in europe now, what about germany?
Yes for 2024. France hit EUR 175.3 billion in B2C ecommerce turnover, the UK was EUR 150 billion (goods-only after a methodology change), Spain reached EUR 95.2 billion, and Germany was EUR 94.0 billion (EuroCommerce, October 2025 corrigendum). Spain edged Germany for the first time. The UK swap is partly a definition change, but France's position as Europe's largest market is real on the underlying numbers.
what's driving the gap between eastern and western europe ecommerce growth?
User-base expansion versus basket-size growth. Eastern Europe grew B2C ecommerce 18% nominal in 2024 because new shoppers kept entering the channel (Bulgaria, Estonia, North Macedonia all at +15 to +20%). Western Europe grew 6% because e-shopper penetration is near saturation (above 80% across most of the region) and growth has to come from existing shoppers buying more or paying more per order. Different growth engines, same chart.
which eu market should i prioritise as a north american dtc brand expanding in 2026?
It depends on what "easy first market" means to you. Ireland, the Netherlands, and Germany are the lowest-friction targets if you want English-speaking or English-tolerant ecommerce buyers, strong logistics, and high spend per shopper. France is the biggest market but harder on language and returns expectations. Italy and Spain have growth runway but lower penetration and a different payment-method mix (cash-on-delivery is still meaningful in parts of Southern Europe per industry-trade coverage). We see most NA DTC brands land in the Netherlands first because of warehouse and VAT-OSS logistics, then expand into Germany and France from there.
how do i interpret the eurostat e-shopper number, is it of internet users or of total population?
Eurostat publishes both. The "internet users" denominator (isoc_ec_ibuy, 77.8% EU-27 in 2025) is the headline number for adoption inside the digital population. The "all individuals 16-74" denominator (tin00096, 73.6% EU-27 in 2025) is closer to a market-size proxy. We use the internet-users version for country comparisons (since internet penetration itself varies a few points across the EU) and the all-individuals version when sizing addressable demand.
how often does eurostat update the ecommerce penetration data?
Annually, each November or December. The 2025 release landed in late November 2025. EuroCommerce refreshes the turnover and growth side each October. We re-pull both and refresh this page once a year in Q4 when the new data lands.
should i set up local pricing per country or run one pan-eu storefront?
Both, with judgment. Eastern and Southern European shoppers are more price-sensitive and less willing to pay for cross-border shipping; local-currency pricing and a local payment method (iDEAL in NL, Bancontact in BE, BLIK in PL) lifts conversion materially. Northern and Western European shoppers tolerate a pan-EU storefront better. The simplest rule we use: if a country is 10%+ of your EU revenue, set up local pricing, local payments, and a local return address. Below 10%, the pan-EU storefront is fine for v1.