
Insights
Inflation pass-through gap 2026: CPI vs PPI by DTC category
When input costs rise faster than the prices you can charge, margin compresses. The gap between PPI and CPI varies by category, and in 2026 several DTC verticals are still absorbing cost increases consumers will not accept. This post maps the pass-through gap by category so you know how exposed your pricing is.
Key Takeaways
- Apparel pricing power is finally back. Apparel CPI is running +4.17% YoY in April 2026 against apparel manufacturing PPI at +2.89%. The lines crossed in early 2026 for the first time since the 2022 squeeze. The 2022 peak gap was +8.67 points against brands; today it is -1.28 points toward brands. A 9.95-point swing in 44 months.
- Food-at-home is the inverse case. Grocery retailers are eating the spread. Food at home CPI is +7.60% while food manufacturing PPI is +3.92%. That 3.68-point spread has run continuously since mid-2023. For DTC-only food brands, it is consumer willingness to pay. For wholesale-to-grocery brands, retailers are pocketing it.
- Household furnishings has flipped from deflation to a +4% retail rebound. CPI for household furnishings was negative through most of 2024. Now it is +4.12% with manufacturing PPI at +1.89%. Full margin recovery is on the table for brands that held the line on price through the 2023 to 2024 inventory cycle.
- Beauty and personal care has a quiet 2-point compression. Personal care CPI is +1.89% YoY while toilet preparation PPI is +3.92%. Input costs (ingredients, packaging, influencer media) did not fall when shelf inflation cooled. Strong brands absorb it via mix and pack architecture. Weaker brands give back gross margin.
- No category has recovered the cumulative 2022 to 2024 margin damage. Cumulative PPI lead (sum of monthly YoY gaps January 2022 through April 2026, 51 observations) sits at +133 points for apparel, +128 points for furnishings, and +28 points for beauty. Even where the YoY gap has closed, four years of compounded compression has not been priced back.
For four years, ecom operators have lived inside a margin trap created by the gap between Producer Price Index (PPI, what brands pay upstream) and Consumer Price Index (CPI, what brands can charge at retail). When PPI runs hot but CPI stays cool, you eat the difference at gross margin. When CPI catches up, you get pricing power back. The April 2026 BLS release shows that gap is finally closing in apparel and household furnishings, still wide in personal care, and inverted in food (retailers are keeping the spread). Why this matters now: where you sit in the chart below determines whether your 2026 gross margin recovers or stays trapped. What to watch next: the May and August BLS CPI releases. We refresh this index quarterly.
The pass-through gap, defined in one paragraph
The pass-through gap is the difference between category PPI year over year and the same category's CPI year over year. We express it as PPI minus CPI in percentage points. Positive numbers (PPI hotter than CPI) mean wholesale costs are rising faster than retail prices, so brands eat the spread at gross margin. Negative numbers (CPI hotter than PPI) mean retail prices are catching up to or running ahead of wholesale, so brands have pricing power restored. The sign convention is what every operator question collapses to: which side of zero is my category on this month, and where has it been for the last six.
Four-year story in one chart
Apparel has flipped. Food has run inverted the entire window. Beauty has a quiet, persistent compression. Furnishings has rebounded from deflation. All four are on one axis below.
Two patterns jump off the chart. First, apparel (the blue line) traces the classic squeeze-and-recovery shape: an +8.67 point peak in August 2022 against brands, a long slow grind back through 2023 and 2024, and a clean cross into negative territory in early 2026. As of April 2026 it sits at -1.28 points (CPI above PPI, brand-side tailwind). Second, food at home (the line that lives below zero the whole time) has been the inverse case the entire four-year window: CPI has consistently run above PPI by 2 to 9 points, meaning grocery retailers (not food manufacturers) have captured the gap. Beauty and household furnishings sit in the middle: beauty has held a roughly +2 to +5 point compression since mid-2023, and furnishings has flipped from deflation to a +2 to +3 point retail-side tailwind in 2025 and 2026.
The April 2026 snapshot, in one table:
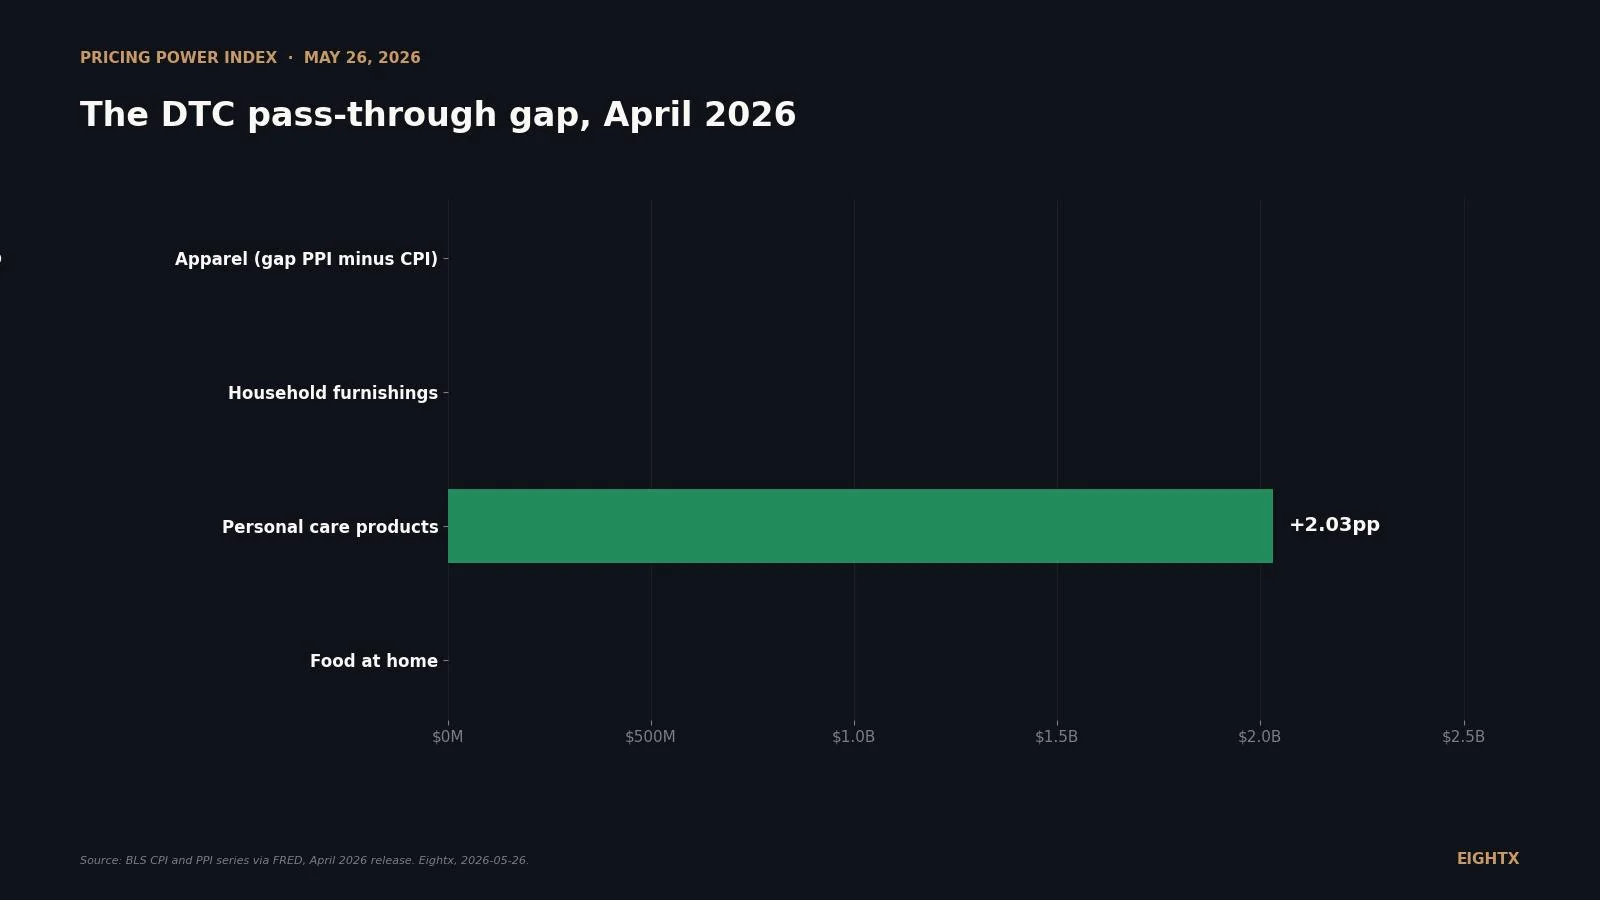
Category CPI YoY PPI YoY Gap (PPI - CPI) Operator read Apparel +4.17% +2.89% -1.28pp Pricing power restored. Take 2-3% on hero SKUs. Food at home +7.60% +3.92% -3.68pp Retail margin expansion. DTC-only food has runway. Personal care products +1.89% +3.92% +2.03pp Mild compression. Defend margin via mix. Household furnishings +4.12% +1.89% -2.23pp CPI catching up after deflation. Raise prices.
Apparel: the pricing-power case study
Apparel is the cleanest "pricing power restored" story in the dataset. From peak compression in August 2022 (PPI +13.54%, CPI +4.87%, a gap of 8.67 points against brands) to April 2026 (CPI +4.17%, PPI +2.89%, a gap of 1.28 points toward brands), apparel brands have closed almost ten points of pass-through deficit in 44 months.
The mechanism: the 2022 spike was an import-cost shock (cotton, freight, tariff-sensitive lines) that hit PPI before consumers were ready to absorb retail increases. Apparel CPI peaked at just +6.7% in 2022 while PPI hit +13.5%. Brands ate the gap. Then 2023 and 2024 inverted the squeeze. PPI cooled fast as freight normalized and inventory cleared, but apparel CPI went negative every month from April through November 2025 (bottoming at -0.94% in May 2025) because brands and retailers were liquidating the over-bought inventory of 2022 to 2023. By early 2026, the inventory unwind ran out, and apparel CPI rebounded sharply from -0.78% in April 2025 to +4.17% in April 2026.
One nuance on the series. PCU315315 (NAICS 315 apparel manufacturing) captures the wholesale market price of domestically-made apparel, which is a shrinking slice of what U.S. consumers buy. The BLS Import Price Index for apparel (series IM911) captures the landed cost of imported apparel, which is what most U.S. apparel brands actually pay, and it tells a complementary story: import-cost pressure has persisted longer than domestic PPI suggested. We will layer IM911 into the next refresh. The operator read is the same either way: 2026 H2 is the first window in four years where apparel brands have category-level permission to raise list prices.
The disciplined version of that permission comes from NIQ's 2026 consumer outlook: "the pricing playbook is over for now. Growth has to come from volume, mix, and innovation, not across-the-board price increases." Translation for operators: the +4.17% CPI flip is not a green light for a 5 to 7 percent list increase. It is permission to take 2 to 3 percent on hero SKUs while holding entry SKUs flat to defend traffic.
Food: where the spread sits with retailers, not brands
Food at home is the inverse case. Since mid-2023, food-at-home CPI has consistently run above food-manufacturing PPI by 3 to 6 points in most months, peaking at 9 points in mid-2024. As of April 2026, CPI is +7.60% YoY while PPI is +3.92%, a 3.68-point spread. That is not brand-side compression. It is retailer-side margin expansion.
Two implications, depending on which side of the channel you sit on. If you are a DTC-only food brand selling direct to consumers, the inverted gap is your tailwind. Consumers in your category are accepting +7.6% retail inflation. You are not paying through the nose at the manufacturer level (your PPI input is +3.9%, a normalized rate). The spread between what your consumers will accept and what your inputs cost is wider than at any point in the last four years. That is the runway to either lift margin or reinvest into customer acquisition.
If you are a CPG food brand selling through grocery, the same chart is a problem. Grocery retailers have been the channel pocketing the spread, and they have done it through three levers Circana has documented through 2025 and 2026: private label expansion (now positioned as "best value without compromise," not the cheap option), promo discipline, and tighter category-management economics on national brands. When you ask your major-retailer category manager for a list-price increase, the answer in 2026 is increasingly "absorb it" because they have the share-shift threat of private label and the margin cushion of the inverted gap to back it up.
One forward-looking caveat. The April 2026 BLS PPI release flagged renewed input-cost pressure in food: energy +7.8% MoM, industrial chemicals +4.4% MoM, both feeding into food packaging and processing. Purdue's agricultural-economics commentary on the same release called it "the food price pipeline opening" again. So PPI for food manufacturing is likely to drift higher into H2 2026, which would close some of the inverted gap. For DTC food brands, that means the runway is real but finite. Plan the price move in the next two quarters, not the next two years.
Beauty and household furnishings: the categories nobody's watching
Two smaller stories that operators in these categories should run their own math on.
Beauty and personal care is the slow-burn compression. Personal care products CPI is +1.89% YoY in April 2026 against toilet preparation manufacturing PPI at +3.92%, a 2-point compression that has held since mid-2025. This is well below the 6 to 9 percent PPI peaks of 2022, so the compression is the normalized state, not a crisis. The structural reason it does not show up as broken brands: beauty operates at 75 to 85 percent gross margin, so a 2-point input squeeze is absorbable through mix, pack architecture, and trade-spend discipline. Strong brands push consumers into higher-margin premium SKUs (serums, treatments, discovery sets at $80+ per ounce) and absorb the headline compression without flinching. Weaker brands give back gross margin. The Circana data through 2025 confirms private-label beauty is gaining ground precisely where indie and national-brand pricing has gotten ahead of the consumer.
Household furnishings has rebounded violently from deflation. CPI for household furnishings was negative for nine months in 2024 (the post-COVID demand hangover and over-bought inventory cycle). Both CPI and PPI for furnishings flipped positive in late 2024, and as of April 2026 CPI sits at +4.12% while PPI is +1.89%. Net: a 2.23-point retail-side tailwind. Brands that held the line on price through the 2023 to 2024 cycle are now harvesting the rebound. Brands that discounted aggressively to clear inventory are starting from a lower price floor and have a longer climb back. Differentiated and design-led pieces are absorbing list-price increases. Commodity furniture is a tougher fight, especially against value-tier private-label players.
The category is telling you the answer. Apparel is telling you to take price on hero SKUs. Furnishings is telling you the inventory cycle has cleared and the floor has lifted. Personal care is telling you to defend margin through mix, not headline pricing. Food is telling you that if you sell DTC, the consumer is more elastic than your category-management instinct assumes. The mistake is reading the headline CPI and skipping the gap.
What to do this quarter
Three moves, in order.
Re-rank your portfolio by current gap direction. If you operate across categories (a beauty brand with a wellness sub-line, or an apparel brand with a home-textiles SKU), each category sits in a different cell of this matrix right now. Treat them independently. The pricing window for your apparel SKUs is open. The pricing window for your personal care SKUs is closed and the right move there is mix and pack architecture.
Test a 2 to 3 percent price increase in any category with a negative gap. Apparel, food (DTC only), and household furnishings all sit in negative-gap territory in April 2026. The disciplined play is a hero-SKU pilot for 4 weeks, measuring conversion rate and AOV against the prior 4-week baseline. If conversion holds within 5 percent of baseline, the increase rolls to the catalog with the same hero-tier discipline NIQ flagged. If conversion drops more than 5 percent, the test costs you almost nothing because the experiment was 4 weeks long.
Renegotiate input contracts in any category with a positive gap. Personal care is the obvious one in April 2026. If your toilet-preparation PPI is running +3.9% YoY and your contract was set against the 2024 floor (when PPI was at -1.66% in some months), you are paying a premium versus current spot. Your contract manufacturer or chemical supplier knows the same data and will be defending the rate, but the negotiation is at least open. Same logic applies if you import private-label or contract-manufactured beauty inputs that show up in chemical PPIs upstream (WPU067504 for hair preparations, WPU067514 for creams and lotions): the H2 2026 cost picture is worse than the headline retail-PPI suggests, so lock in 2027 rates now.
One framing the founder calls have repeatedly surfaced: track dollars, not just margin percentage. A category that has closed the YoY gap has not necessarily recovered the dollar margin compounded since 2022. Summing monthly YoY gaps across the 51 monthly observations from January 2022 through April 2026 (October 2025 omitted as a BLS data gap), apparel's cumulative PPI lead sits at +133 percentage-points and furnishings at +128. Food's cumulative CPI lead (retailer tailwind, brand-side tailwind for DTC-only) sits at -169 points. Beauty sits at +28. Even where the YoY math works in your favor today, the compounded four-year compression is not priced back. The dollar version is the one that pays the bills.
What we're watching next
The next BLS CPI and PPI releases land in mid-June 2026 (May data) and again in mid-July (June data). We refresh this index quarterly after the second CPI release of each quarter, so the next refresh is targeted for August 2026 after the July CPI print. Three signals that would change the operator read:
- A new tariff cycle on imported apparel. Would push the PPI Apparel Manufacturing line back above CPI within two quarters and re-open brand-side compression. The IM911 import-price-index series is the leading indicator. We will surface it in the next refresh if a tariff change lands.
- Food PPI re-acceleration. The April 2026 release already flagged energy, chemicals, and packaging running hot. If food-manufacturing PPI crosses food-at-home CPI on the way up (currently sits 3.7 points below), the DTC-food tailwind closes.
- Furnishings PPI cooling vs CPI holding. Would widen the retail-side tailwind further and make the price-restoration play easier through H2 2026.
For more on how unit-economics shocks land on the P&L of mid-cap DTC brands, see our DTC layoff and hiring tracker and our cost-of-goods index for DTC categories. If you want to model the pass-through gap on your own category and SKU mix, book a 30-minute call with an interim CFO.
Sources and methodology
Data window. Monthly observations from January 2022 through April 2026. That is 52 monthly data points per series, eight series total (four CPI plus four matched PPI).
Series pulled. From the U.S. Bureau of Labor Statistics via FRED:
- CPI Apparel: CPIAPPSL (seasonally adjusted, base 1982-84=100).
- PPI Apparel Manufacturing: PCU315315 (NAICS 315, NSA, base Dec 2003=100).
- CPI Food at Home: CUUR0000SAF11 (NSA).
- PPI Food Manufacturing: PCU311311 (NAICS 311, NSA).
- CPI Personal Care Products: CUUR0000SEGA (NSA).
- PPI Toilet Preparation Manufacturing: PCU325620325620 (NAICS 325620, NSA).
- CPI Household Furnishings and Operations: CUUR0000SAH3 (NSA).
- PPI Furniture and Related Product Manufacturing: PCU337337 (NAICS 337, NSA).
Transformation. All series were fetched with FRED's units=pc1 parameter (percent change from year ago) directly, which removes the level-rebasing confusion that comes from CPI and PPI using different base years. The "gap" series in chart 1 is computed as PPI YoY minus CPI YoY in percentage points. Positive gap means brand-side compression. Negative gap means brand-side pricing power (or retail-side margin expansion, depending on channel).
Limitations. First, the NAICS-level PPI is not an exact match to the matched CPI category. PPI Apparel Manufacturing covers domestic apparel producers (NAICS 315), which is a shrinking share of US apparel consumption. Most apparel sold here is imported. For an import-inclusive picture, the BLS Import Price Index for apparel (series IM911) is the better proxy, and the next refresh of this index will layer it in. Second, PPI series are NSA while CPI series are mostly NSA except for apparel CPI, which is SA. Same-period YoY comparisons cancel most seasonality, but month-to-month volatility looks larger than reality. Third, personal care PPI uses Toilet Preparation Manufacturing (PCU325620325620), which captures cosmetics, lotions, fragrance, and hair products. It does not capture upstream chemical PPIs (WPU067504 for hair preparations, WPU067514 for creams and lotions). For a beauty operator's real input picture, both layers matter. Fourth, October 2025 has a data gap in several BLS series and the 2025-10 row is left blank in the underlying CSVs.
Triangulation. Operator-level pricing patterns referenced in this post are pulled from a 5,400+ founder-call corpus (Pinecone retrieval, names anonymized per Eightx editorial SOP). External corroboration on the 2026 pricing playbook is drawn from NIQ's 2026 Consumer Outlook, Circana's 2026 consumer marketing trends, Simon-Kucher's CPG pricing guide, and Purdue agricultural-economics commentary on the April 2026 BLS release.
Accessed. All BLS data via FRED MCP integration on 2026-05-26.
Refresh cadence. Quarterly, triggered by the second BLS CPI release of each quarter (February, May, August, November). Next scheduled refresh: August 2026.
Frequently asked questions
what is the difference between cpi and ppi and why should a dtc operator care?
CPI is the consumer price index, what consumers pay at retail. PPI is the producer price index, what brands and manufacturers pay upstream. The gap between the two is the closest public-data proxy for whether your category lets you pass cost through to the customer or forces you to eat it at gross margin.
if ppi is higher than cpi does that mean i'm losing margin?
Usually yes, at the category level. If wholesale costs are rising faster than retail shelf prices, brands in that category are eating the spread until they either raise price, change pack size, or shift mix to higher-margin SKUs. Personal care is in that state right now: PPI +3.92% YoY versus CPI +1.89%.
why is food manufacturing ppi only +3.9% when food-at-home cpi is +7.6%? who's keeping the spread?
Grocery retailers, mostly. CPI captures shelf prices, PPI captures wholesale food manufacturing. When CPI runs above PPI for a sustained period (it has since mid-2023) the difference shows up in retailer gross margin. For DTC-only food brands selling direct, the same gap is consumer willingness to pay that you can capture yourself.
apparel cpi is finally above ppi. does that mean i can push price now?
Selectively, yes. NIQ called this out in their 2026 consumer outlook: the pricing playbook of broad list-price hikes is over. Take 2 to 3 percent on hero SKUs where brand strength and demand can absorb it. Hold or sharpen entry SKUs to defend traffic. A 5 to 7 percent across-the-board increase will cost you volume.
how do i actually use this data to plan a 2026 price increase?
Three steps. First, find your category's current gap above. Second, pull your own COGS trend for the last 12 months and compare it to the PPI line, not the CPI line. Third, model the increase on hero SKUs only and run a 4-week pilot before rolling it across the catalog. If your own cost trend has outpaced PPI, you have more room than the index suggests.
should i be looking at category-level cpi or my own cogs trend?
Both, but your own COGS is the deciding number. Category CPI tells you what consumers are absorbing in your category overall. Your COGS tells you what you actually need to pass through. If your COGS is running well above your category PPI, you have a sourcing or scale problem to fix before you raise price.
what's the typical lag between a ppi move and when retail prices catch up?
Six to twelve months for most consumer categories, longer for apparel because of seasonal calendars. The 2022 apparel PPI peak hit in August 2022 at +13.5 percent. Apparel CPI did not even cross +5 percent and then drifted negative through most of 2025. We are only seeing the lagged catch-up now, in 2026.
household furnishings cpi just flipped from negative to +4%. am i too late to raise prices?
No. The flip is recent (late 2024) and PPI for furnishings is still running well below CPI at +1.89 percent. The category gave you permission to take price about two quarters ago. If you have not yet, the window is still open, especially on differentiated and design-led pieces. Commodity furniture is a tougher fight.