
Financial Strategy
Jewelry Brand Financial Benchmarks 2026
Public jewelry comps show gross margin spanning 39.5% to 57.5%, but operating margin stays under 6% because SG&A and marketing eat the spread. Inventory ties up 75 to 186 days of cash. DTC fine jewelry runs $500+ AOV, $120 to $180 CAC, and needs LTV:CAC of at least 3:1 on margin.
Key Takeaways
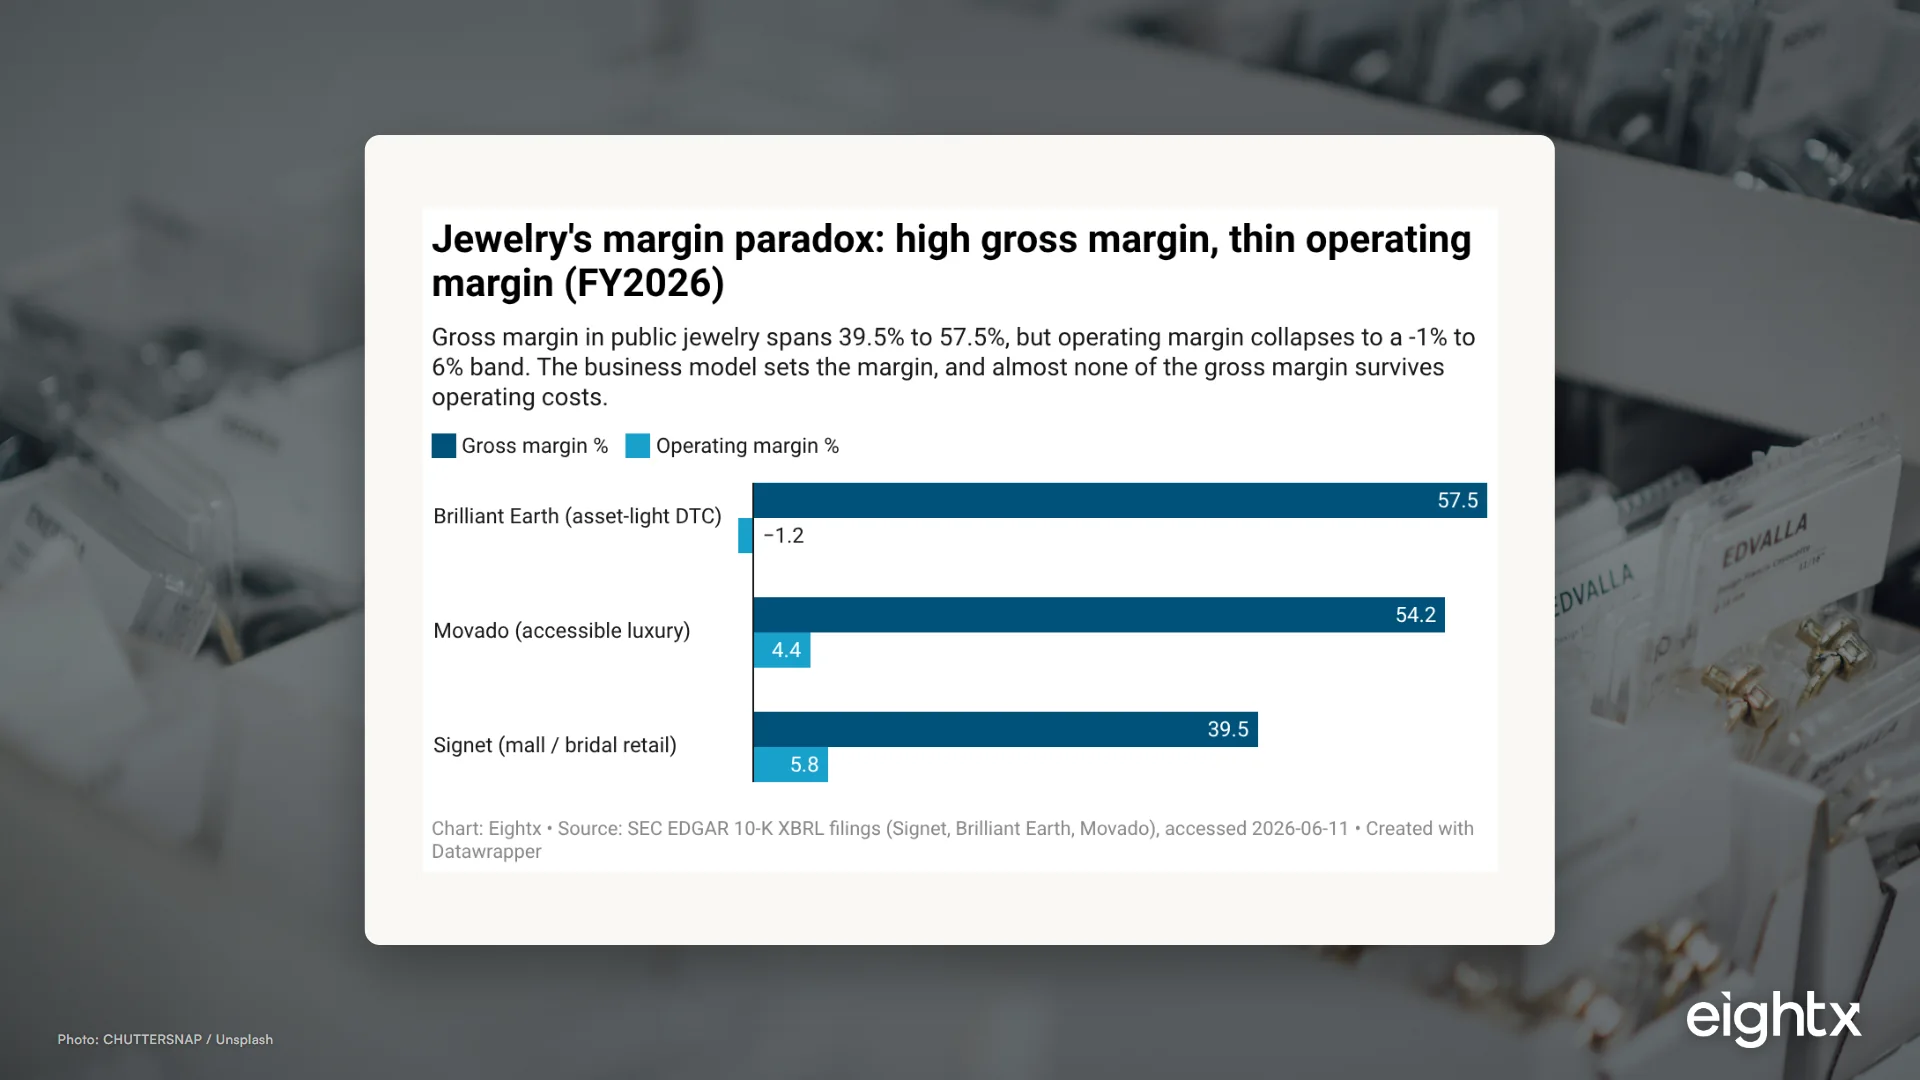
- Gross margin in public jewelry spans 39.5% to 57.5%, set by business model, not category. Signet (mall/bridal) posts 39.5%, Movado (accessible luxury) 54.2%, and asset-light Brilliant Earth 57.5%. A DTC fine-jewelry brand running on a generic 60-70% assumption is benchmarking against the wrong number.
- High gross margin does not survive to the bottom line. Operating margin across the public comps sits in a -1.2% to +5.8% band. SG&A and marketing load (Signet's SG&A is 31.9% of revenue, Brilliant Earth's opex is 58.7%) eats most of the spread.
- Inventory is the category's hidden cash trap: 75 to 186 days of stock. Movado holds ~186 days (1.96x turns), Signet ~172 days (2.13x), and made-to-order Brilliant Earth just ~75 days (4.86x). The production model, not size, sets how long your cash sits in a vault.
- Fine-jewelry AOV easily clears $500 while fashion jewelry runs $40 to $85. If you sell fine jewelry but your AOV is under $400, you are carrying fine-jewelry cost structure on fashion-jewelry economics.
- Jewelry CAC runs ~$120 to $180 with the lowest conversion (0.8-1.5%) of any ecommerce category. LTV:CAC of 3:1 on margin dollars is the survival line; 4-5:1 is where you actually want to be.
Most jewelry founders benchmark themselves against generic "DTC" numbers that simply do not apply to their category. Jewelry is a high-margin, high-AOV (average order value), low-frequency, slow-turning corner of ecommerce, and the metrics that work for a $35 supplement or a $60 tee will quietly mislead you. This report anchors the real numbers to the three public jewelry comps whose 10-Ks just landed (Signet, Brilliant Earth, Movado) and layers in 2026 web benchmarks for the DTC metrics public filings never disclose: AOV, CAC, conversion, return rate, and LTV:CAC. If you run a jewelry brand between roughly $2M and $100M, this is the page to read your own P&L against.
What the public jewelry comps actually earn
There are only a handful of pure-play public jewelers left, which is itself a useful fact: when you confirm the peer set on SIC 5944 (Retail-Jewelry Stores), most historical names (Zale, Samuels, Whitehall, Friedmans) are acquired or defunct. That leaves three live, verifiable jewelry P&Ls, and they happen to cover three different business models.
Signet Jewelers (mall and bridal retail) posted a 39.5% gross margin on $6.81B of revenue in FY2026. Brilliant Earth (asset-light, made-to-order DTC) posted 57.5% on $437.5M. Movado (accessible luxury, watches and accessories) landed in between at 54.2% on $671.3M. That is an 18-point gross-margin spread inside a single category, and it tracks almost perfectly to business model: the more stock-heavy and retail-footprint-heavy the model, the lower the gross margin; the more asset-light and made-to-order, the higher.
The first takeaway for an operator is to stop quoting "the jewelry margin" as if it were one number. The closest analog to most DTC founders here is Brilliant Earth, not Signet, because it is online-first and made-to-order. So when you benchmark, weight toward the asset-light comp and treat Signet as the scaled, mall-retail reference point rather than your mirror.
When I talk to founders running a fine-jewelry brand this size, the thing they keep saying is that they assumed 65% gross margin was normal because that is what the generic DTC playbooks quote. The public comps say the honest fine-jewelry band tops out around the high 50s unless you are made-to-order, and even then you have to actually realize that margin after discounting and markdown.
| Company | Ticker | Fiscal year end | Revenue ($M) | Gross margin % | Operating margin % | Inventory ($M) | Inventory turns | Days of inventory |
|---|---|---|---|---|---|---|---|---|
| Signet Jewelers | SIG | 2026-01-31 | 6,813.6 | 39.5 | 5.8 | 1,937.3 | 2.13 | 172 |
| Movado Group | MOV | 2026-01-31 | 671.3 | 54.2 | 4.4 | 156.7 | 1.96 | 186 |
| Brilliant Earth | BRLT | 2025-12-31 | 437.5 | 57.5 | -1.2 | 38.3 | 4.86 | 75 |
Why high gross margin doesn't reach the bottom line
Here is the number that surprises people: operating margin across all three comps sits in a tight, thin band of -1.2% to +5.8%. Signet, the lowest gross margin of the three, actually posts the highest operating margin at 5.77% ($393.1M of operating income). Brilliant Earth, the highest gross margin, posts an operating loss of -1.23% (-$5.4M). The gross-margin ranking and the operating-margin ranking are nearly inverted.
The reason is operating load. Signet's SG&A runs 31.9% of revenue. Brilliant Earth's total operating expense runs 58.7% of revenue, which is almost the entire gross margin. So a brand can win the gross-margin contest and still lose the profit contest, because the cost of acquiring a jewelry customer (low conversion, high CAC, heavy creative spend) and the cost of serving them (showrooms, try-at-home, sizing, returns) is brutal.
This is the pattern we see again and again: a founder celebrates a 60%+ gross margin and then cannot understand why there is no cash at the end of the month. The gross margin was never the problem. The problem is that jewelry's customer-acquisition and fulfillment costs are structurally high, and they sit below the gross line where the celebratory number stops looking at them. Why this matters for your business: if you are pricing to a target gross margin, you are pricing to the wrong line. Price and plan to a target operating margin, then work backward to the gross margin you need.
Inventory: the cash trap nobody benchmarks
Inventory is where jewelry brands quietly drown, and it is the single metric most operators never benchmark. Movado holds roughly 186 days of inventory (1.96x annual turns). Signet holds ~172 days (2.13x). Brilliant Earth, because it is made-to-order, holds just ~75 days (4.86x). The made-to-order model turns inventory about 2.5x faster than the stock-heavy model, which means it ties up roughly 2.5x less cash in product to do the same job.
Put that in cash terms. If you run a stock-heavy model at ~2x turns and your COGS is $5M a year, you are carrying around $2.5M of cash sitting in a vault as unsold inventory at any given moment. That is cash that is not in marketing, not in product development, and not in your bank account as runway. When we have struggled with this, what worked was treating inventory days as a hard operating constraint, not a buying preference: a brand sitting on 180+ days of stock was reorganized around tighter assortment and a made-to-order tier for its highest-ticket SKUs, and the freed-up cash was the difference between needing a line of credit and not.
The operator lesson is that your production model is a financial decision, not just a merchandising one. Made-to-order, just-in-time replenishment, and ruthless assortment discipline are the levers that move inventory days, and inventory days are the lever that moves cash. If you only fix one thing after reading this report, fix this one.
AOV, conversion, CAC and returns: the numbers public filings hide
The 10-Ks give you margin and inventory, but they do not give you AOV, conversion, CAC, return rate, or LTV:CAC. For those, you have to triangulate 2026 web benchmarks, and you should treat them as industry-reported ranges, not audited figures. Here is the band every DTC fine-jewelry operator should plan against.
Fine-jewelry AOV easily exceeds $500, and bridal often runs $2,000+. Fashion jewelry, by contrast, sits at $40 to $85. If you sell fine jewelry but your AOV is under $400, you are running fashion-jewelry economics on a fine-jewelry cost structure, and the math will not close. On conversion, jewelry has the lowest rate of any major ecommerce category (0.8% to 1.5%) and the highest cart abandonment (~81%). Fine jewelry above $500 AOV converts at a standard 0.8% to 1.0%. You pay for a lot of traffic that mostly leaves, which is exactly why CAC is unforgiving.
CAC is reported at roughly $120 to $180 per customer in early 2026, well above adjacent DTC categories (fashion $66 to $72, beauty $61 to $68), driven by that low conversion. Return rate runs 16.9% to 20% overall, with fine jewelry typically better (10% to 12% is strong) because purchases are more considered and ring sizing is the dominant return driver. The thing that saves the model is lifetime value: fine jewelry delivers dramatically better LTV and repeat rates than fashion jewelry, which is why an LTV:CAC of at least 3:1 on margin dollars is the survival line and 4:1 to 5:1 is the real target.
When I talk to founders at this stage, the CAC-versus-AOV mismatch is the most common silent killer. They cut CAC from $160 to $110 and feel great, but if AOV is sitting at $380 on a fine-jewelry cost base, the unit economics still do not work. The fix is almost always AOV and retention, not just cheaper traffic.
| Metric | 2026 benchmark for DTC fine jewelry | Basis |
|---|---|---|
| Gross margin | 55-75% (CM1) | SEC comps 39.5-57.5%; web DTC 50-70%+ |
| AOV | $500+ (bridal often $2,000+) | Branvas; fashion jewelry $40-85 |
| Conversion rate | 0.8-1.0% (1.2%+ strong) | Branvas, Optimonk, Convertibles |
| Return rate | 10-20% (10-12% strong) | Branvas (jewelry 16.9-20% overall) |
| Paid CAC | $70-180 per new customer | UserMaven ~$120-180; adjacent DTC $60-72 |
| LTV:CAC | 3:1 on margin (4-5:1 ideal) | Yotpo 2026 |
| Inventory turns | 1-3x per year | SEC comps 1.96-4.86x; made-to-order higher |
How to read your own jewelry P&L against these benchmarks
Pull your own numbers and run them against five guardrails. First, if your gross margin is under 55% and you are positioned as fine jewelry, you are likely underpricing, over-discounting, or carrying an inefficient supply chain relative to the asset-light comps. Second, if your AOV is under $400 while you carry fine-jewelry CAC, you have an economics mismatch and need either higher AOV (bundling, higher-ticket SKUs, financing) or much stronger retention to compensate.
Third, if your inventory turns are under 1x per year, you are over-assorted: too many SKUs, too much speculative buying, and too much cash frozen in product. Fourth, if your return rate is above 20%, treat it as a fit-and-expectations problem (sizing tools, better photography, packaging) before you treat it as a product problem. Fifth, if your LTV:CAC is under 3:1 on margin dollars, your acquisition is outrunning your retention, and the answer is repeat-purchase behavior (email and SMS, drops, VIP, repairs, add-on services), not just cheaper ads.
For context on where jewelry sits relative to neighboring verticals, compare these numbers with our apparel financial benchmark and our beauty financial benchmark. The high-AOV, slow-turn profile of jewelry is closest to beauty on margin and closest to apparel on inventory risk, which is exactly why generic DTC benchmarks lead jewelry founders astray.
The headline trap in jewelry is the gross margin. It looks healthy, so founders price to it and plan to it, then wonder where the cash went. The cash went into 180 days of inventory and a CAC that is double the adjacent category. Benchmark the operating margin and the inventory days, not the gross margin, and the real picture shows up.
Sources and methodology
SEC EDGAR (primary). We pulled annual 10-K XBRL financial statements for three live public jewelry comps. Signet Jewelers (CIK 0000832988), FY2026 ended 2026-01-31: revenue $6,813.6M, COGS $4,119.0M, gross profit $2,694.6M, operating income $393.1M, SG&A $2,173.2M, ending inventory $1,937.3M. Movado Group (CIK 0000072573), FY2026 ended 2026-01-31: revenue $671.3M, COGS $307.7M, gross profit $363.6M, operating income $29.8M, SG&A $333.8M, ending inventory $156.7M. Brilliant Earth Group (CIK 0001866757), FY2025 ended 2025-12-31: revenue $437.5M, COGS $186.0M, gross profit $251.5M, operating income -$5.4M, total opex $256.9M.
Ratios. Gross margin = gross profit / revenue. Operating margin = operating income / revenue. Inventory turns = COGS / ending inventory. Days of inventory = 365 / turns. Brilliant Earth's FY2025 ending inventory was not separately tagged in XBRL, so its 4.86x / 75-day figure uses FY2024 ending inventory ($38.3M) as the base and should be read as an approximation.
Comp-set limitation. Industry-peer confirmation on SIC 5944 (Retail-Jewelry Stores) shows most historical pure-play jewelers are acquired or defunct, leaving Signet as the dominant scaled public jeweler. Signet is roughly 10x Movado's revenue and 15x Brilliant Earth's, and is mall/bridal retail rather than DTC, so we treat Brilliant Earth as the operator-relevant comp and Signet as the scaled reference. Secondary sources cite Signet's seasonal Q4 gross margin near 42.0% versus our 39.5% full-year figure; we use the full-year SEC pull as the headline.
Storeleads (category scale). Jewelry brands sit under the Apparel / Clothing Accessories taxonomy, which holds 190,477 Shopify stores. Store-level data is reliable (gorjana global rank #469, Mejuri #532, Brilliant Earth #7,261), but category-level sales aggregates did not return through the current plan and are not reported here rather than estimated.
Triangulated web benchmarks. AOV, conversion, CAC, return-rate and LTV:CAC ranges come from Branvas, Triple Whale, UserMaven, Yotpo, and Optimonk (2026), cross-checked against Parallel.ai deep research (run trun_6bebc15578ef4c38ab059fdba351ee2e). These are industry-reported ranges, not audited figures, and are kept clearly distinct from the SEC primary numbers throughout.
What this is not. This report benchmarks public filings and industry ranges. It is not a substitute for modeling your own P&L. If you want the line-by-line read on your brand, our interim CFO services team does exactly this for jewelry operators.
Frequently asked questions
what is the typical profit margin on jewelry?
At the gross level, public jewelry comps run 39.5% to 57.5% depending on business model, and DTC fine jewelry is industry-reported (not audited) at 55% to 75%. But operating margin is the number that matters, and across the public comps that sits between -1.2% and +5.8%. High gross margin in jewelry does not mean high profit.
what is a fair markup for jewelry?
Fine jewelry usually carries a keystone-or-better markup (roughly 2x to 3x cost), which lands you in the 50% to 70% gross-margin band. The trap is assuming that markup is your profit. SG&A and marketing eat most of it, so plan your markup to leave room for a real operating margin, not just a healthy gross one.
what is the average order value for jewelry ecommerce?
Fine jewelry AOV easily clears $500, and bridal often runs $2,000+. Fashion jewelry sits at $40 to $85, and blended jewelry/luxury ecommerce averages roughly $150 to $313. Where you land tells you which cost structure you should be running.
is the jewelry industry declining?
No. The category is enormous and crowded, not declining. Storeleads tags 190,000+ Shopify stores in jewelry and clothing accessories, and the leading DTC fine-jewelry brands rank near the top of all Shopify. The pressure is competition and CAC, not shrinking demand.
what is a good ltv to cac ratio for a jewelry brand?
At least 3:1 on margin dollars (not revenue) is the survival line, and 4:1 to 5:1 is where efficient brands aim because jewelry CAC is volatile. Fine jewelry tends to beat fashion jewelry here thanks to higher repeat and gifting behavior, so retention is your biggest lever.
why is my jewelry brand's operating margin so thin when gross margin looks great?
Because SG&A and marketing absorb most of the gross spread. Signet's SG&A is 31.9% of revenue and Brilliant Earth's total opex is 58.7% of revenue, which is why Brilliant Earth posts a 57.5% gross margin but an operating loss. A great gross margin is the starting line, not the finish.
how many times a year should a jewelry brand turn its inventory?
The public comps turn 1.96x to 4.86x per year. Stock-heavy retail sits near 2x (170 to 186 days), and made-to-order DTC hits nearly 5x (75 days). For most DTC fine-jewelry brands, 1x to 3x is the realistic band. Below 1x usually means over-assortment.
what's a normal customer acquisition cost for a fine jewelry brand in 2026?
Roughly $120 to $180 per new customer in early 2026, higher than adjacent DTC (fashion $66 to $72, beauty $61 to $68) because jewelry converts at only 0.8% to 1.5%. Under $70 CAC at fine-jewelry AOVs is elite; over $200 only works if your LTV or margin is at the top of the band.
how much cash should i expect to have tied up in inventory as a jewelry brand?
If you run a stock-heavy model at ~2x turns, expect roughly half a year of COGS sitting in inventory at any moment. On a brand doing $5M in COGS that is around $2.5M of cash in product. Made-to-order cuts that dramatically, which is the single biggest cash lever in the category.
Related Eightx benchmarks: Apparel Brand Exit Multiples and Acquirers 2026 and Amazon vs DTC margin gap.