
eCommerce
UK Ecommerce CAC Benchmark 2026
In 2026 a UK DTC brand pays roughly $25 to $40 paid CAC for apparel and $30 to $60 for beauty, with blended CAC around $68 to $84 overall, up about 40% in two years. A healthy brand recovers that CAC inside 3 to 6 months and holds LTV:CAC at 3:1 or better.
Key Takeaways
- Blended ecommerce CAC runs roughly $68 to $84 in 2026, up about 40% in two years. UK levels sit in the same band or slightly higher. The gap between UK and US is driven by channel mix, not geography.
- UK retail demand is at a series high. The ONS Retail Sales Index hit 103.8 in January 2026, above the pre-COVID base of 100 and well above the April 2020 trough of 80. Appetite is not the constraint. Acquisition cost is.
- Online retail is stuck near 28% of all UK sales (28.1% in April 2026, value up 6.6% year-over-year). The every-year-climbs tailwind that bailed out a loose CAC in 2020 is gone, so growth has to be bought.
- Target a 3:1 LTV:CAC floor and 3 to 6 month CAC payback for apparel and beauty (1 to 3 months for food). The cross-industry median LTV:CAC is 3.4:1, top quartile 5.6:1. Below 3:1, growth is structurally unsustainable.
- Stop chasing one 'good CAC' number. Apparel paid CAC runs $25 to $40, beauty $30 to $60, supplements $40 to $80. Benchmark against your vertical, your margin, and a payback clock, not a headline average.
If you run a UK DTC (direct-to-consumer) brand, "what should it cost me to acquire a customer" is the question that decides whether you scale or stall. The honest answer is that there is no single good number. CAC (customer acquisition cost) depends on your vertical, your margin, and how fast you get the money back. This is the UK answer, built on the UK's own national statistics rather than US figures with the labels swapped: the ONS retail spine underneath, the Storeleads GB merchant cut for scale, and the 2026 DTC benchmark datasets for the CAC ranges.
The short version: UK demand is strong, online's share of spend has stopped climbing, and paid acquisition got materially more expensive. So the brands that win in 2026 are not the ones with the lowest CAC. They are the ones who benchmark CAC against their vertical and hold a payback clock.
What CAC actually means for a UK brand (and how to calculate it)
There are two CAC numbers, and most founders quote the wrong one. Paid CAC is your total paid media spend, plus the acquisition costs around it (agency fees, creative, tooling), divided by the customers your ad platforms claim. Blended CAC is that same spend divided by every new customer in the period, including the organic, referral, and word-of-mouth buyers your ads helped create. Blended CAC is the one that pays the bills, because it reflects what you actually spent to grow your customer base, not just the click-attributed slice.
The formula is simple. Blended CAC = (ad spend + other acquisition cost) divided by total new customers. The judgment is in what you do with it. A £30 blended CAC means nothing on its own. Read it next to contribution per first order: AOV times gross margin. If your average order is £80 at 55% margin, you bank £44 of contribution and a £30 CAC pays back on order one. If your average order is £35 at 40% margin, you bank £14 and that same £30 CAC is underwater until the customer buys again.
When I talk to founders running a brand this size, the pattern is almost always the same: they can quote their Meta ROAS to two decimal places but cannot tell me their blended CAC or their first-order payback. That is the gap that quietly kills margin. The platform number flatters the spend; the blended number tells the truth.
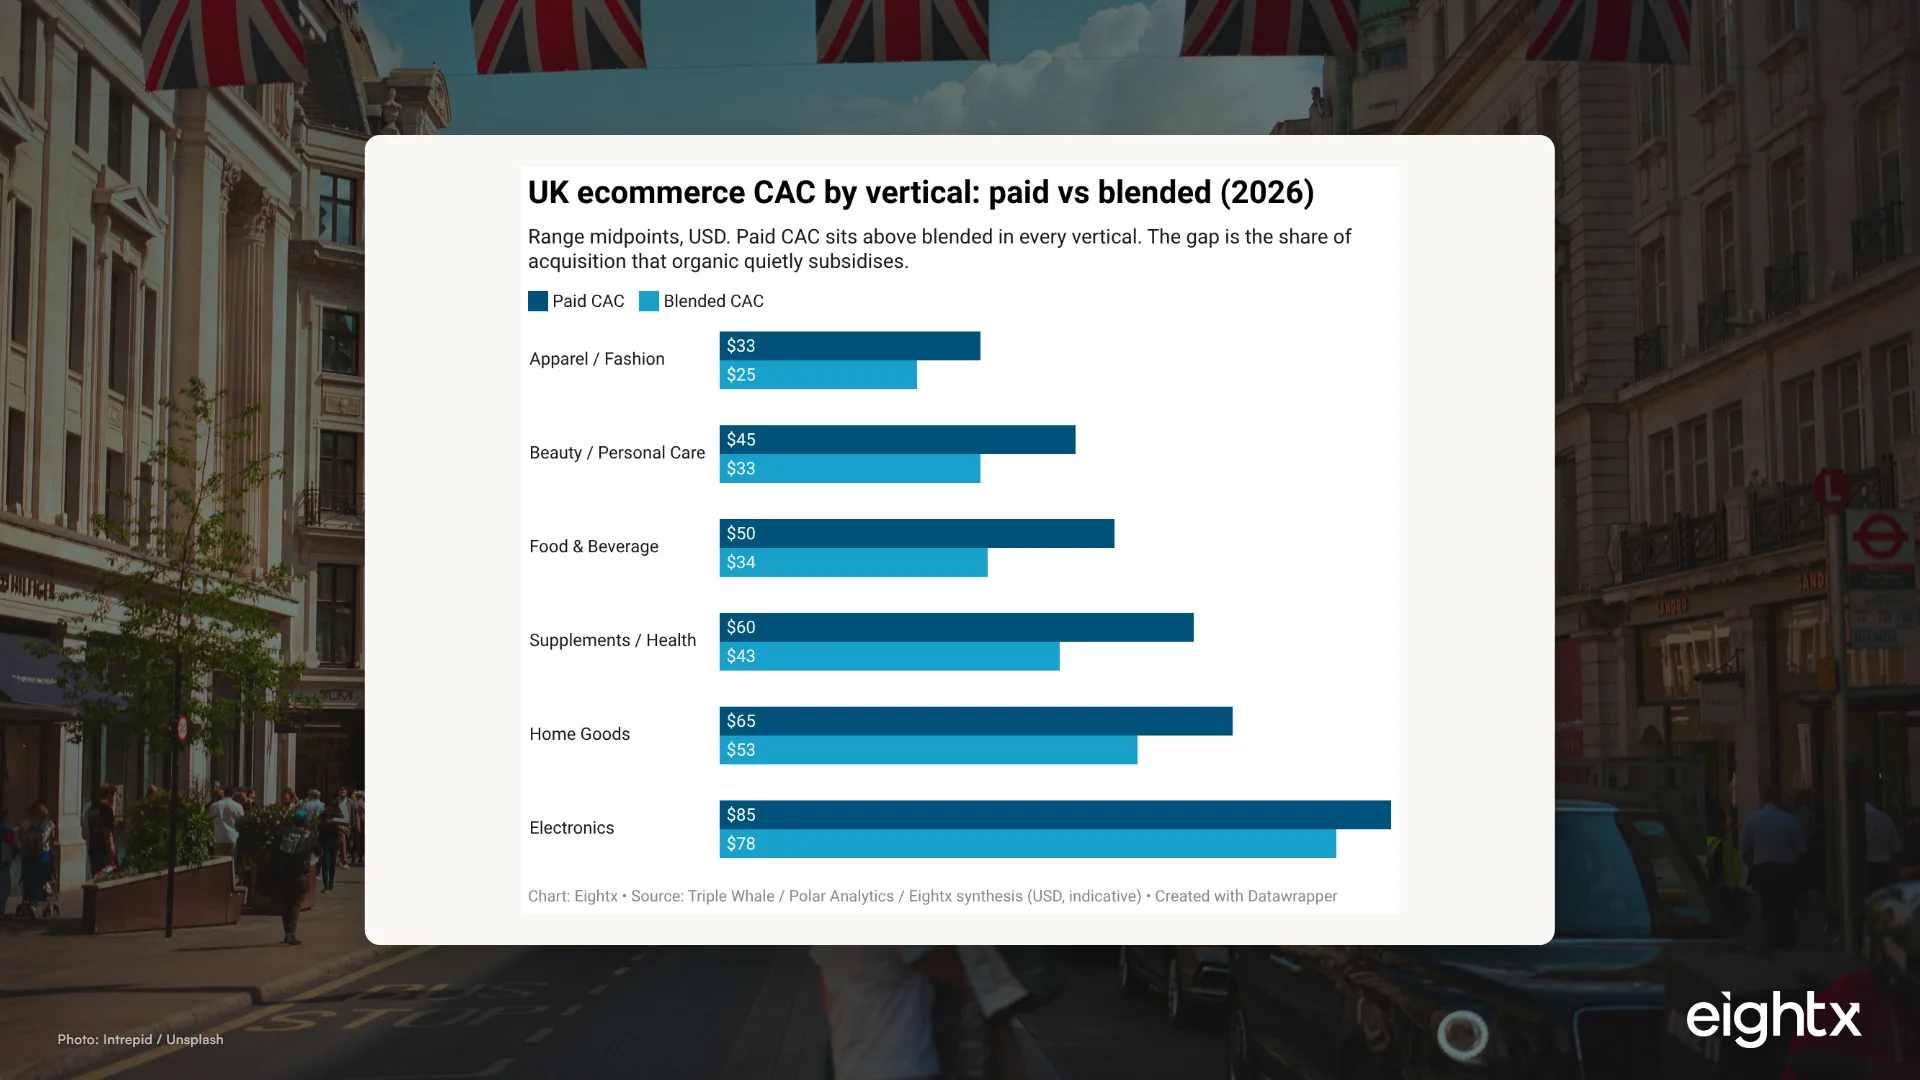
Across the 2026 benchmark sets, blended CAC runs roughly 55% to 90% of paid CAC depending on vertical. The more your category leans on subscription and repeat (food, supplements), the bigger the gap, because organic carries more of the load. The more considered the purchase (electronics, home), the smaller the gap, because almost every sale is bought.
The UK CAC benchmark by vertical, 2026
Here is the headline. Blended ecommerce CAC sits around $68 to $84 in 2026 across categories, up roughly 40% in two years. UK levels land in the same band or slightly higher, because UK CPMs are competitive. There is no public UK-only CAC-by-vertical dataset, so the table below uses the global and US-weighted DTC numbers as the working UK proxy. That is a real caveat, not a hedge: the UK delta is driven by channel mix, not geography, so the relationships between verticals hold even where the absolute figure shifts a few dollars.
| Vertical | Paid CAC (USD) | Blended CAC (USD) | Typical LTV:CAC | CAC payback |
|---|---|---|---|---|
| Apparel / Fashion | $25 to $40 | $18 to $32 | 2.0 to 3.0x | 3 to 6 months |
| Beauty / Personal Care | $30 to $60 | $20 to $45 | 3.0 to 4.0x | 2 to 4 months |
| Supplements / Health | $40 to $80 | $26 to $60 | 3.0 to 4.0x | 3 to 6 months |
| Food & Beverage | $30 to $70 | $18 to $50 | 3.0 to 4.5x | 1 to 3 months |
| Home Goods | $40 to $90 | $30 to $75 | 2.0 to 3.0x | 3 to 6 months |
| Electronics | $50 to $120 | $45 to $110 | 1.8 to 2.5x | 6 to 12+ months |
The chart below plots the paid-versus-blended gap at range midpoints. The space between the two bars in each vertical is the organic subsidy: the cheaper your blended number sits below your paid number, the more your brand, email, and referral engine is carrying the spend.
Read the table the right way and apparel looks cheap to acquire ($25 to $40 paid) but carries the weakest LTV:CAC, while supplements cost more to buy but support a better ratio. That is the whole point of benchmarking by vertical instead of by vibe: a $45 CAC is a problem for an apparel brand and a win for a supplements brand. The number only means something next to the margin and repeat behaviour behind it.
Why UK CAC is the number it is: the ONS backdrop
To understand why acquisition got expensive, look at the demand side first. UK retail demand is not weak. The ONS Retail Sales Index (all retailing including fuel, chained volume, seasonally adjusted) hit 103.8 in January 2026, above the pre-COVID base of 100 and miles above the April 2020 lockdown trough of 80.0. People are spending. Appetite is not your constraint.
The constraint is where that spending goes. Online retail has been stuck near 28% of all UK sales for years: 28.1% in April 2026, with online sales value up 6.6% year-over-year. Over a quarter of the market is online, but the every-year-climbs tailwind that bailed out a loose CAC in 2020 is gone. When online share was racing from 20% to 30%, you could ride the wave. Now growth in your online share has to be bought, customer by customer, in an auction against everyone else trying to buy the same thing.
Then there is the squeeze on real terms. UK CPI hit 142.1 in April 2026 (2015 = 100), up from 133.9 two years earlier, roughly 6% cumulative inflation. Average weekly total pay reached £749 in March 2026, up from about £688 two years earlier, around 8.9%. Pay is just outrunning prices, so the discretionary headroom for online spend exists, but it is thin. A flat nominal CAC is a rising real cost, and a flat AOV is a shrinking real margin.
| Metric | Latest value | Period | ONS series |
|---|---|---|---|
| Retail sales index (volume SA) | 103.8 | Jan 2026 | Retail Sales Index |
| Online share of retail sales | 28.1% | Apr 2026 | Internet sales |
| CPI (2015 = 100) | 142.1 | Apr 2026 | D7BT |
| Average weekly total pay | £749 | Mar 2026 | KAB9 |
It is a big, real market to compete in. The Storeleads GB cut (pulled 11 June 2026) shows 252,110 Shopify stores and 181,735 WooCommerce stores in Great Britain, of which 6,230 are Shopify Plus and 58,195 are Shopify apparel stores. That is a quarter of a million UK Shopify merchants bidding in broadly the same auctions you are. Demand is healthy, the online slice is flat, and the queue of brands trying to buy a share of it is long. That is why CAC is the number it is.
Payback and LTV:CAC: the two ratios that decide if your CAC is fine
A CAC number in isolation cannot tell you whether you are winning. Two ratios can. The first is LTV:CAC: lifetime gross-margin value divided by blended CAC. Treat 3:1 as the floor, 3.5:1 to 4.5:1 as healthy, and above roughly 5:1 as a sign you are under-investing and could profitably spend more. The cross-industry median is 3.4:1 and the top quartile is 5.6:1. Below 3:1, the growth math does not close and you are funding acquisition out of capital rather than contribution.
The second is CAC payback: how many months of gross margin it takes to earn the CAC back. For apparel and beauty, aim to recover inside 3 to 6 months. Food and subscription brands should be faster, often 1 to 3 months. Past 12 months only works with very strong retention and patient capital. In 2026's tighter funding climate, most funded brands target under 4 months so they are not floating payback on borrowed money.
When we've struggled with this with operators, the fix is almost never "cut CAC." It is the denominator. One brand we worked through this with was staring at a blended CAC near £48 and panicking about ad costs, when the real issue was a 90-day repeat rate in the low teens. Lift repeat and AOV, and the same £48 CAC that looked fatal at 2.2:1 LTV:CAC becomes healthy at 3.4:1. The CAC did not move. The economics around it did.
So stop asking "is my CAC too high" and start asking "does my CAC pay back inside my vertical's window, and does it hold a 3:1 ratio." Those are the two questions a CFO asks before signing off on more spend, and the two most founders skip.
What changed since 2021, and what to do about it
The cheap-acquisition era did not pause; it ended. Meta CPMs now sit around $8 to $14 (roughly £6 to £11) and have climbed 8% to 12% a year. The iOS privacy changes from 2021 broke attribution and pushed Meta CAC up 30% to 50% for many DTC brands, and Google Shopping CAC rose 15% to 25% as auction competition intensified. The net effect: mid-market DTC brands now pay 40% to 60% more per new customer than they did in 2020 to 2021. That is not a blip you wait out. It is the new baseline.
The pattern we see again and again is that the brands handling this well did three things. They tightened the payback clock, refusing to scale any channel that could not recover CAC inside their vertical's window. They leaned hard on organic and retention to pull blended CAC below paid, treating email, SMS, and repeat purchase as acquisition infrastructure. And they benchmarked by vertical, so a rising paid CAC triggered a margin check, not a panic.
What to do this week: pull your blended CAC for the last 90 days and put it next to your vertical's range above. Calculate first-order payback (contribution per order divided by blended CAC) and LTV:CAC on gross margin. If payback is outside your window or your ratio is under 3:1, the fix is usually in AOV, repeat rate, or channel mix, not in slashing spend and starving growth.
How to benchmark your own brand
Run the four-step check. One, calculate both CAC numbers: paid (spend divided by paid-attributed customers) and blended (spend divided by all new customers). Two, place your blended number inside your vertical's range above. Three, compute first-order payback and LTV:CAC on gross margin, and test them against the 3 to 6 month window and the 3:1 floor. Four, if either ratio fails, diagnose the denominator (margin, AOV, repeat) before you touch the spend.
For the macro context underneath these numbers, our UK ecommerce KPI benchmark 2026 covers the full operating picture, and the Australia ecommerce CAC benchmark runs the same analysis for the AU market if you sell across both. If you would rather have someone stress-test your CAC, payback, and LTV:CAC against your actuals, that is what our interim CFO services do.
UK demand is at a series high, online's share of spend has stopped climbing, and paid acquisition costs 40 to 60 percent more than it did in 2021. The brands that win in 2026 are not the ones with the lowest CAC. They are the ones who benchmark CAC against their vertical, hold a 3 to 6 month payback clock, and fix the denominator (AOV, margin, repeat) before they touch the spend.
Sources and methodology
The macro spine comes from the Office for National Statistics, pulled via the ONS MCP on 11 June 2026. Retail demand uses the Retail Sales Index for Great Britain (all retailing including automotive fuel, chained volume measure, seasonally adjusted), latest reading 103.8 in January 2026, with the April 2020 trough of 80.0 used as the COVID reference point. Inflation uses CPI all-items, series D7BT (source MM23, 2015 = 100), ranging from 133.9 in May 2024 to 142.1 in April 2026. Pay uses Average Weekly Earnings, whole-economy total pay, series KAB9, seasonally adjusted, from about £688 in early 2024 to £749 in March 2026.
The online-share figure (28.1% in April 2026, value up 6.6% year-over-year) is carried from the sibling UK KPI benchmark, which cites the ONS internet sales series. The named ONS MCP endpoints did not directly expose an internet-sales dataset on this run, so a publisher should confirm and link the exact ONS internet sales time series (typically the "Retail sales, Great Britain" release) before this figure is treated as primary rather than carried.
Market scale comes from the Storeleads GB cut, pulled 11 June 2026: 252,110 Shopify stores, 181,735 WooCommerce stores, 6,230 Shopify Plus, and 58,195 Shopify apparel stores in Great Britain. This account tier did not return store-level revenue or traffic estimates (those fields came back null), so Storeleads is used here for merchant-mix and market-size context only, not for revenue or CAC estimates.
The CAC, payback, and LTV:CAC figures are synthesised from 2026 DTC benchmark datasets: Triple Whale and Polar Analytics aggregate Shopify data, plus Eightx aggregate client data covering $5M to $50M brands, triangulated through Perplexity and Parallel.ai. All CAC figures are USD, drawn from global and US-weighted DTC datasets, because no UK-only public CAC-by-vertical dataset exists. We present them in USD with an approximate sterling note rather than converting at a fixed rate, to avoid false precision. The UK delta is driven by channel mix and slightly higher CPMs, not by geography, so the vertical relationships hold even where the absolute number shifts.
Key external references: the blended-versus-paid CAC gap and LTV:CAC-by-vertical analysis (Eightx), the $68 to $84 blended band (Swell), and the Meta CPM and payback figures (Hycos, Yotpo). Figures are anonymised throughout.
Frequently asked questions
what is a good cac for a uk ecommerce brand?
There is no single number. A good CAC is one your margin and payback clock can carry: it should land inside your vertical's range (apparel paid CAC $25 to $40, beauty $30 to $60), recover inside 3 to 6 months, and keep your LTV:CAC at 3:1 or better. A £30 blended CAC on a £40 first order with 55% margin is tight; the same £30 on an £80 first order is comfortable.
how do i calculate customer acquisition cost for my online store?
Paid CAC is total paid media spend plus acquisition costs (agency, creative, tooling) divided by new customers attributed to paid. Blended CAC is the same numerator divided by all new customers in the period, including organic and referral. Blended is the number that actually pays the bills because it counts every customer your spend helped create, not just the click-attributed ones.
what is the average cac payback period for uk dtc brands?
For apparel and beauty, target recovering CAC inside 3 to 6 months on a gross-margin basis. Food and beverage and subscription brands should be quicker, often 1 to 3 months. Anything past 12 months only works if you have very strong retention and patient capital. Tighter capital conditions in 2026 mean most funded brands now aim for under 4 months.
how does uk ecommerce cac compare to us benchmarks?
They sit in roughly the same band. UK CAC is in the same range or slightly higher than US figures because UK CPMs are competitive, but the difference is driven by channel mix (how much you lean on Meta versus Google versus organic) far more than by geography. There is no public UK-only CAC-by-vertical dataset, so the global and US-weighted DTC numbers are the working proxy.
what cac to ltv ratio should i be targeting?
Treat 3:1 as the floor and 3.5:1 to 4.5:1 as the healthy zone. The cross-industry median is 3.4:1 and the top quartile is 5.6:1. Below 3:1, growth is structurally unsustainable. Above roughly 5:1 you are often under-investing in growth and could profitably spend more. Measure LTV in gross-margin terms, not revenue.
what is the difference between blended cac and paid cac?
Paid CAC only counts customers your ad platforms claim. Blended CAC divides all acquisition spend by all new customers, so it captures the organic, referral, and brand-driven customers that paid spend helped create. Blended typically runs 55% to 90% of paid CAC. The gap is the share of acquisition that organic quietly subsidises, and it is bigger in food and supplements than in electronics.
why has my cac gone up so much since 2021?
Two structural reasons. Meta CPMs sit around $8 to $14 and have risen 8% to 12% a year, and the iOS privacy changes from 2021 broke attribution and pushed Meta CAC up 30% to 50% for many DTC brands. Mid-market brands now pay 40% to 60% more per new customer than in 2020 to 2021 across Meta and Google. The cheap-acquisition era ended; it did not pause.
is a £30 cac good for a uk shopify store?
It depends entirely on your AOV, margin, and repeat rate. £30 against an £80 first order at 55% margin pays back on order one, which is excellent. The same £30 against a £35 first order at 40% margin does not even cover the first order, so you are betting the whole model on repeat purchases. Always read CAC next to contribution per order, never on its own.
Related Eightx benchmarks: UK ecommerce KPI benchmark 2026: AOV, conversion, CAC and returns by vertical and Average UK ecommerce margin by vertical FY25: Moonpig 27.6% to Ocado Retail 1.9%, with ASOS still posting a £281m loss. For hands-on help with your numbers, talk to our fractional CFO team.