
Insights
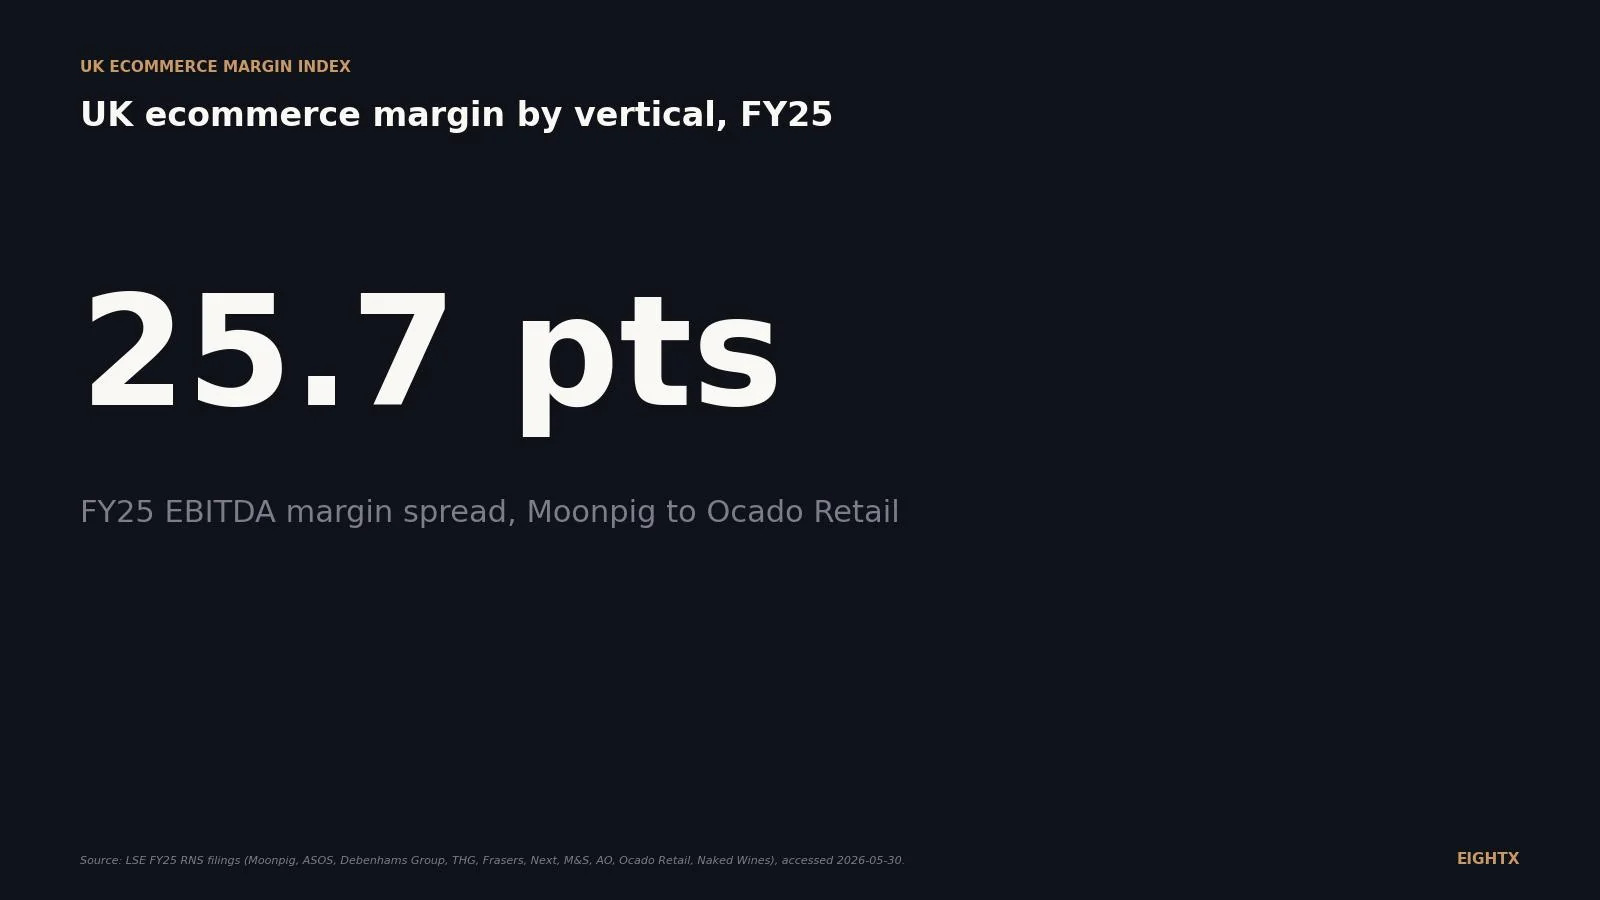
Average UK ecommerce margin by vertical FY25: Moonpig 27.6% to Ocado Retail 1.9%, with ASOS still posting a £281m loss
Ten LSE-listed UK online retailers in FY25 span from Moonpig at 27.6 percent adjusted EBITDA on 350.1 million pounds of revenue down to Ocado Retail at 1.9 percent. ASOS posted 5.3 percent adjusted EBITDA on 2.5 billion pounds of turnover but still reported a 281.6 million pound statutory pre-tax loss. Vertical beats scale: gifting (Moonpig), fashion-specialist (Next online), and premium beauty clear 15 percent or above, while multi-brand apparel marketplaces do not.
Key Takeaways
- The UK ecommerce margin spread is wider than the US comparison set. Moonpig prints 27.6% adjusted EBITDA on £350.1m of revenue. ASOS prints a £281.6m statutory loss before tax on £2,477.8m. Same fiscal year, same country, different verticals, 25+ point gap.
- Pure-play UK apparel is the worst-margin vertical in the cohort. ASOS 5.3% adjusted EBITDA. Debenhams Group (the relisted boohoo) 5.3% adjusted EBITDA on revenue down 12% year on year. Neither cleared statutory operating profit. Returns rate, marketplace fees and parcel inflation absorbed the gross margin both companies still earn.
- Gifting and multi-channel beat pure-play on margin every time. Moonpig 27.6%, Next plc Online segment 15.1% operating margin FY26 (up 120 bps), Frasers Group 11.4% operating margin, M&S Clothing & Home division 11.2%. None of these companies are pure-play DTC. All of them clear double-digit margin where pure-play apparel struggles to clear 6%.
- M&S confirmed the channel-margin gap in its own FY25 numbers. Clothing & Home store operating margin 13.1%, online operating margin 7.5%. Same brand, same fiscal year, 560 bps lower margin on the online channel. Very few UK retailers disclose this split. The ones that do tell you pure-online margin trails store margin on the same brand.
- The macro overlay is the wrong direction. Bank Rate 3.75% (April 2026 MPC held 8 to 1), CPI 3.3% (March 2026), employer NICs up 1.2 points from April 2025. ONS internet sales share has plateaued at 28.1% (April 2026) and never recovered the early 2021 peak around 36%. Topline relief is not arriving from market growth. Margin defence is the 2026 operator job.
We pulled the most recent FY25 results for every UK ecommerce-relevant retailer with usable disclosure plus a representative Companies House private filer. The headline takeaway: in 2026, UK ecommerce margin is governed by vertical more than by scale. Pure-play gifting (Moonpig) prints a 27.6% adjusted EBITDA margin on £350m of revenue. Apparel pure-play (ASOS) is still a £281.6m statutory loss before tax on £2.48bn of revenue at a 47.1% adjusted gross margin. Online grocery (Ocado Retail) lands at 33.7% gross margin and 1.9% EBITDA margin. The vertical band matters more than the brand name above the door. Here is the FY25 ladder, the methodology behind it, and a private-operator translation that should land within 100 to 300 basis points of your own management accounts.
The UK ecommerce margin ladder, FY25 ranked
Moonpig sits at the top of the FY25 margin ladder at 27.6% adjusted EBITDA, on revenue of £350.1m for the year to 30 April 2025. No other UK ecommerce-relevant LSE-listed company in our cohort cleared 15% on an adjusted EBITDA basis. Next plc reported a 15.1% Online segment operating margin for its FY26 (year to January 2026), up 120 bps year on year. We include Next in the ladder because its January year-end means the FY26 disclosure is the most recent fully reported comparable. Frasers Group reported 11.4% group operating margin on £4.9bn of revenue. M&S Clothing & Home division clocked in at 11.2% division operating margin. Then the cohort falls off a cliff. THG Beauty at 5.9% adjusted EBITDA. ASOS and Debenhams Group (the relisted boohoo) tied at 5.3% adjusted EBITDA. AO World approximately 4% on an adjusted PBT proxy. Naked Wines 2.7%. Ocado Retail at the bottom on 1.9% adjusted EBITDA on a 70-week reporting stub (the M&S JV transitioned to 53-week reporting in FY25).
The data table behind the chart shows the per-company detail, including the revenue base and the specific margin metric reported.
Company Ticker FY25 year end Revenue (£m) Reported margin (%) Margin metric Moonpig Group MOON.L 30 Apr 2025 350.1 27.6 Adjusted EBITDA Next plc (Online segment, FY26) NXT.L Jan 2026 not split 15.1 Segment operating Frasers Group FRAS.L 27 Apr 2025 4,900 11.4 Group operating M&S Clothing & Home (division only) MKS.L 29 Mar 2025 not split 11.2 Division operating THG Beauty (division) THG.L 31 Dec 2025 1,107.9 5.9 Adjusted EBITDA ASOS plc ASC.L 31 Aug 2025 2,477.8 5.3 Adjusted EBITDA Debenhams Group (boohoo) DEBS.L 28 Feb 2025 790.3 5.3 Adjusted EBITDA AO World AO.L 31 Mar 2025 1,108 ~4.1 Adjusted PBT (proxy) Naked Wines WINE.L 31 Mar 2025 250.2 2.7 Adjusted EBITDA Ocado Retail JV (70-week stub) OCDO.L (JV) 31 Aug 2025 2,830 1.9 Adjusted EBITDA
The metric inconsistency is real and we are not going to hide it. Adjusted EBITDA for the pure-plays. Group or segment operating margin for the multi-category retailers. Adjusted PBT as a proxy for AO. We chose the metric each company emphasises in its own FY25 commentary because that is the one operators and analysts are quoting at each other. Forcing every company onto a single definition would force estimates we cannot verify against the filed accounts.
Why ASOS and Debenhams both cleared £790m+ of turnover but neither cleared statutory profit
ASOS reported £2,477.8m of revenue for the 52 weeks to 31 August 2025 and £131.6m of adjusted EBITDA. That sounds like a profitable business until you read down to the statutory loss before tax of £281.6m. The gap between £131.6m adjusted EBITDA and the £281.6m statutory loss is depreciation and amortisation (capitalised technology and warehouse), restructuring charges, and impairment. The adjusted gross margin is healthy at 47.1%. The operating gearing to absorb the non-cash charges below the line is not.
Debenhams Group (the renamed boohoo group, ticker DEBS) is the same story on a smaller revenue base. £790.3m of turnover for the year to 28 February 2025, down 12% year on year. £41.6m of adjusted EBITDA, a 5.3% margin and up 80 bps year on year on a falling top line. The group has not yet cleared statutory operating profit on its post-rebrand revenue base; the gap between adjusted EBITDA and the statutory line is depreciation, restructuring and impairment, consistent with the prior-year disclosure pattern.
The structural drivers are common to both companies. Returns rate of 30%+ on UK apparel. Inbound and outbound parcel costs that have risen every year since 2022. Marketplace fees on third-party brand inventory that compress the blended gross margin. Free-shipping thresholds that consumers expect and competitors maintain. Promotional cadence that suppresses average selling price in any week that is not Christmas peak. The output of that stack is a sub-6% adjusted EBITDA margin even with the gross margin both companies still earn.
Where the margin actually lives: Moonpig, Next Online, Frasers, M&S
Moonpig at 27.6% adjusted EBITDA has the cleanest operating model in the cohort. Personalised cards and gifts are printed to order, so inventory risk and returns are near zero. The customer relationship is direct and recurring (birthdays and Mother's Day are calendar events that come around every year). The pricing power is real because the comparison is John Lewis or the corner shop, not another personalised-gifting marketplace. Moonpig is what a UK DTC apparel brand would look like if you removed returns, inventory risk, and marketplace fees from the P&L.
Next plc Online segment at 15.1% operating margin is the cleanest multi-channel case study on the LSE. Next does not separate its Online segment as a standalone P&L line in the way ASOS does, but it does report a segment operating margin and that margin moved up 120 bps year on year in the year to January 2026. The driver is operational gearing on the existing Next infrastructure (warehouse, IT, delivery network) and the fact that Next's customer file is largely shared between store and online. Online incremental customer acquisition cost is lower than a pure-play because the customer was already a Next customer.
Frasers Group at 11.4% group operating margin shows what happens when you stack categories. £4.9bn of revenue, £557m of operating profit. The Sports Direct, Flannels, Frasers and House of Fraser stable absorbs cost across categories that a pure-play apparel brand cannot. M&S Clothing & Home at 11.2% division operating margin tells the same story on a tighter range.
And M&S did something almost no other UK retailer does: it disclosed the channel split. Clothing & Home store operating margin 13.1%. Online operating margin 7.5%. Same brand, same fiscal year, 560 bps lower margin online. The drivers are the same as ASOS and Debenhams (returns handling, parcel cost, online marketing) but on a much larger and healthier base. The lesson for operators is that pure-online does not magically beat store on margin. When the same brand reports both, store usually wins.
The 2026 UK macro overlay: Bank Rate, NICs, parcel inflation, ONS plateau
The Bank of England held Bank Rate at 3.75% at the April 2026 MPC meeting, with an 8 to 1 vote to hold. CPI inflation was 3.3% in March 2026, up from 3.0% in February. Market commentary expects holds through the summer with the next move likely a hold or hike, not a cut. UK ecommerce operators should not budget for rate relief in 2026.
The April 2025 employer national insurance increase has now flowed through to the FY26 numbers for every company with a year end from April 2025 onward. Employer NICs went up 1.2 percentage points and the secondary threshold dropped from £9,100 to £5,000. For a £4m payroll, that is roughly £60k to £80k of additional annual cost. For an ASOS or Frasers, it is well into eight figures. Companies that absorbed it without a price increase gave back tens of basis points of EBITDA margin, depending on payroll-to-revenue ratio.
Inventory financing is the other Bank-Rate-sensitive line. At 3.75 percent, financing 90 days of stock at a 50 percent COGS-to-revenue ratio costs roughly 46 basis points of revenue per year (90/365 × 50 percent × 3.75 percent). The drag is higher in lower-gross-margin verticals (online grocery, electricals, where COGS sits 65 percent plus of revenue) and lower in beauty and gifting where COGS-to-revenue is below 40 percent. Either way, it is a real line in 2026 budgets that was free in 2020.
The ONS internet sales share (series MM23 in the monthly Retail Sales bulletin) tells a related story. Online retail was 28.1% of total retail in April 2026, down from 28.7% in March 2026, and has never recovered the early 2021 peak around 36%. The COVID-era step change reverted, the channel stabilised in a 25-29% band, and that is the band you should plan against. Topline market growth is not the lever in 2026. Margin defence is.
Brexit is mostly priced in at this point. VAT-deferment on imports, the £135 import-VAT threshold, and customs broker fees on EU-bound parcels were the 2021 to 2022 stories. The companies that survived the first 24 months adjusted their pricing or their EU 3PL footprint. The cost is permanent but it is no longer a surprise on the P&L.
How to benchmark a private UK ecom brand against this comp set
If you run a private UK ecom brand between £5m and £50m of turnover, do not benchmark against the listed comps directly. The listed companies carry G&A that a private operator does not (board fees, audit, listed-company finance team, investor relations, share-based payments) and they pay marketplace fees on third-party brand inventory in many cases. They also carry working capital differently than a private operator with founder oversight on every purchase order.
The realistic private-operator bands below are an Eightx estimate. We take the listed comps as the floor for each vertical and, in our consulting experience with private UK ecom operators, adjust upward at the EBITDA line to reflect the private cost-base advantage. The upward adjustment is not derived from a published dataset. Treat the bands as a sense-check, not a target.
Vertical Realistic FY25 gross margin band (%) Realistic FY25 adjusted EBITDA margin band (%) Closest public comp Gifting / cards 55-65 20-30 Moonpig Beauty (own brand, premium) 65-75 10-20 Charlotte Tilbury proxy Beauty (aggregator / marketplace) 35-45 4-8 THG Beauty Apparel multi-channel 50-60 8-15 Next Online / Frasers Apparel pure-play DTC 45-55 3-8 ASOS / Debenhams Group Online grocery 30-35 1-3 Ocado Retail Electricals / white goods 20-25 2-5 AO World DTC alcohol / wine 15-22 2-6 Naked Wines Multi-category bricks + clicks 40-45 10-13 Frasers / M&S C&H
Companies House private filings give us a partial cross-check. Charlotte Tilbury Beauty Ltd's 2024 accounts (filed late 2025, period to 31 December 2024) showed turnover of £487.3m, up from £448.5m the prior year, and pre-tax profit of £18.3m. That is a 3.8% PBT margin at the statutory line. Premium own-brand beauty at scale clears mid-single-digit statutory profitability on a privately-held P&L, which is broadly consistent with the THG Beauty division at 5.9% adjusted EBITDA. The premium-beauty thesis still works; it is the marketplace-beauty thesis that drags THG group margin down to single digits.
The single most useful number on this page is the M&S Clothing & Home channel split: store operating margin 13.1%, online operating margin 7.5%. The 560 basis point gap is the answer to every operator who asks why their pure-online brand cannot get to the gross-margin band of a multi-channel peer. The structural cost stack is different. Plan to it.
Sources and methodology
London Stock Exchange RNS filings. Primary source for every LSE-listed company in this post. RNS is the regulatory news service every UK-listed company files results through. The full company list with year-ends and the specific document used: ASOS plc FY25 Results RNS dated 20 November 2025 (and earlier preliminary update 30 September 2025); Debenhams Group plc (formerly boohoo) Final Results RNS dated 26 August 2025; Moonpig Group plc FY25 Full Year Results PDF; THG plc FY25 Preliminary Results (LSE article 17520504); Frasers Group plc FY25 Results; Next plc Year-end Results presentation dated January 2026; M&S plc FY25 Annual Report; AO World plc Annual Report 2025; Ocado Retail Ltd FY25 Annual Report; Naked Wines plc FY25 Final Results.
Companies House. Free public-filings register at find-and-update.company-information.service.gov.uk. Used for Charlotte Tilbury Beauty Ltd 2024 accounts (filed late 2025 for the period to 31 December 2024) and as a cross-check on the LSE-listed parent filings. Private filer accounts in the UK disclose less detail than US 10-Ks. Most reliable extractable metrics are turnover and pre-tax profit. Gross profit is often not separately disclosed in mid-size private accounts, which is why we have not built a private-operator companion chart from Companies House data alone.
Margin metric definitions. Adjusted EBITDA in this post means each company's own reported adjusted EBITDA, which strips out depreciation, amortisation, finance costs, taxation, restructuring charges, impairment, and share-based payment expense. The exact adjustments vary by company; ASOS adjusts more aggressively than Moonpig. Operating margin means the statutory operating profit divided by revenue. Adjusted PBT margin (used for AO World) means adjusted profit before tax divided by revenue. Where we use a divisional or segmental margin (Next Online, M&S Clothing & Home, THG Beauty), that is the company's own segment disclosure, not an analyst estimate.
Fiscal year-end fragmentation. No two companies in this comp set close their fiscal year on the same date. Year-ends range from 28 February 2025 (Debenhams Group) to 31 January 2026 (Next plc). This matters because the macro environment (Bank Rate, CPI, NICs increase, consumer demand) flowed through each P&L at a different point. Two specific caveats. First, Next plc reports on a January year-end, so its most recent full-year disclosure is FY26 (year to January 2026); we include it for comparability because it is the most recent fully reported set of comparable numbers. Second, Ocado Retail's FY25 covers a 70-week reporting stub to 31 August 2025 (the M&S JV transitioned to 53-week reporting), so the 1.9% adjusted EBITDA margin is computed on 70 weeks of revenue, not 52. Cross-year comparisons assume the macro overlay is broadly common. For any given month-by-month read, fiscal year-end is a confounder, not a clean comparison.
Bank of England Bank Rate. April 2026 MPC decision held at 3.75% with an 8 to 1 vote. Historical Bank Rate end-of-period series from the Bank of England official Bank Rate explainer page. ONS internet sales as a percentage of all retailing from monthly Retail Sales bulletin, series MM23. Latest data point used: April 2026, 28.1%.
Limitations. Margin metrics are not consistent across the cohort. EBITDA definitions are not consistent across companies. Private DTC filers disclose less than US public companies. M&S, Next and Frasers do not publish standalone online-only P&L lines (we use division-level proxies). THG segment gross margin is not disclosed at division level (only adjusted EBITDA by division). This is not a like-for-like analyst league table. It is an operator-grade read on the UK ecom margin distribution, which is what the comp set actually supports.
Update cadence. This index is refreshed quarterly as each company files. The next planned refresh lands in August 2026 after ASOS and Ocado Retail report their next set of full-year results. The dateModified will bump each time the underlying data is updated.
For related operator reads see our public DTC margin leaderboard FY2025, the average ecommerce gross margin Shopify vs Amazon, and our fractional CFO services for a working session on your own margin walk.
Frequently asked questions
is asos actually profitable yet?
Not at the statutory line. FY25 adjusted EBITDA was £131.6m on £2,477.8m of turnover, a 5.3 percent adjusted EBITDA margin. Statutory loss before tax was £281.6m for the 52 weeks to 31 August 2025. Adjusted EBITDA stripped out depreciation, restructuring and impairment charges. The cash gross margin is real but the operating gearing to clear those non-cash charges is not there yet.
what gross margin should a uk dtc beauty brand be hitting?
Premium own-brand UK beauty (Charlotte Tilbury proxy) clears 65 to 75 percent gross margin and 10 to 20 percent EBITDA at scale. Aggregator and marketplace beauty (THG Beauty proxy) runs 35 to 45 percent gross and 4 to 8 percent EBITDA. If you are sub-65 percent gross on an own-brand premium proposition, the issue is usually formulation cost, packaging or promotional cadence, not channel.
why is moonpig's margin so much higher than asos?
Three reasons. Returns rate near zero on a personalised card or gift versus 30 percent plus on apparel. Inventory risk near zero because the SKU is printed to order versus pre-bought stock that has to clear at full price. Marketplace fee drag near zero because Moonpig owns the customer relationship directly versus ASOS paying inbound fees to third-party brands on its marketplace inventory. Same channel, different unit economics.
how does the bank of england base rate affect uk ecommerce profitability?
Two channels. First, inventory financing. At Bank Rate 3.75 percent, financing 90 days of stock at a 50 percent COGS-to-revenue ratio costs roughly 46 basis points of revenue per year (90/365 × 50 percent × 3.75 percent) versus close to nil when the rate sat near the 2020 floor. Higher COGS-ratio verticals (grocery, electricals) carry more; lower COGS-ratio verticals (beauty, gifting) carry less. Second, consumer demand. Higher mortgage payments hit discretionary spend first, which is exactly where most DTC categories sit. The MPC held at 3.75 percent in April 2026 and market commentary expects a hold or higher through year end. Do not budget for rate relief.
did the april 2025 nics increase actually hit uk dtc margins yet?
Yes, and it is in the FY26 numbers (year ends from April 2025 onward). Employer national insurance went up 1.2 percentage points and the secondary threshold dropped from £9,100 to £5,000. For an apparel brand with a £4m payroll, that is roughly £60k to £80k of additional annual cost, straight off the operating line. Translating to EBITDA margin requires a payroll-to-revenue and EBITDA-to-revenue assumption we are not going to manufacture here; for most £5m-£50m DTC brands the absorbed cost runs in the tens of basis points of EBITDA margin.
which uk listed ecommerce company has the highest ebitda margin in fy25?
Moonpig at 27.6 percent adjusted EBITDA on £350.1m of revenue (year to 30 April 2025). No other UK ecommerce-relevant LSE-listed company in our cohort cleared 15 percent on an adjusted EBITDA basis. Next plc Online segment at 15.1 percent operating margin is the closest peer but Next reports at the operating line not EBITDA, so the metrics are not directly comparable.
how should i benchmark my £5m to £30m uk dtc brand against thg or boohoo?
Do not benchmark against the listed comps directly. Strip out their listed-company G&A (board fees, audit, investor relations, share-based payment) and their marketplace fee drag, then add back the working capital advantage you have as a private operator. Realistically, a well-run £5 to £30m private UK ecom brand should clear 100 to 300 bps more EBITDA than the closest listed peer. If you are at parity or below, look at G&A and returns rate first.
what does the ons internet sales share figure actually tell me about my market?
It tells you online retail penetration is plateauing, not growing. ONS series MM23 sat at 28.1 percent of total retail in April 2026, down from 28.7 percent in March 2026 and never recovered the early 2021 peak around 36 percent. Translation: market growth will not bail out a flat brand. If you want to grow in 2026 it has to be share gain, not channel growth.