
Insights
UK and EU DTC margin leaderboard 2026: where six LSE and Frankfurt-listed brands sit on the FY25 ladder
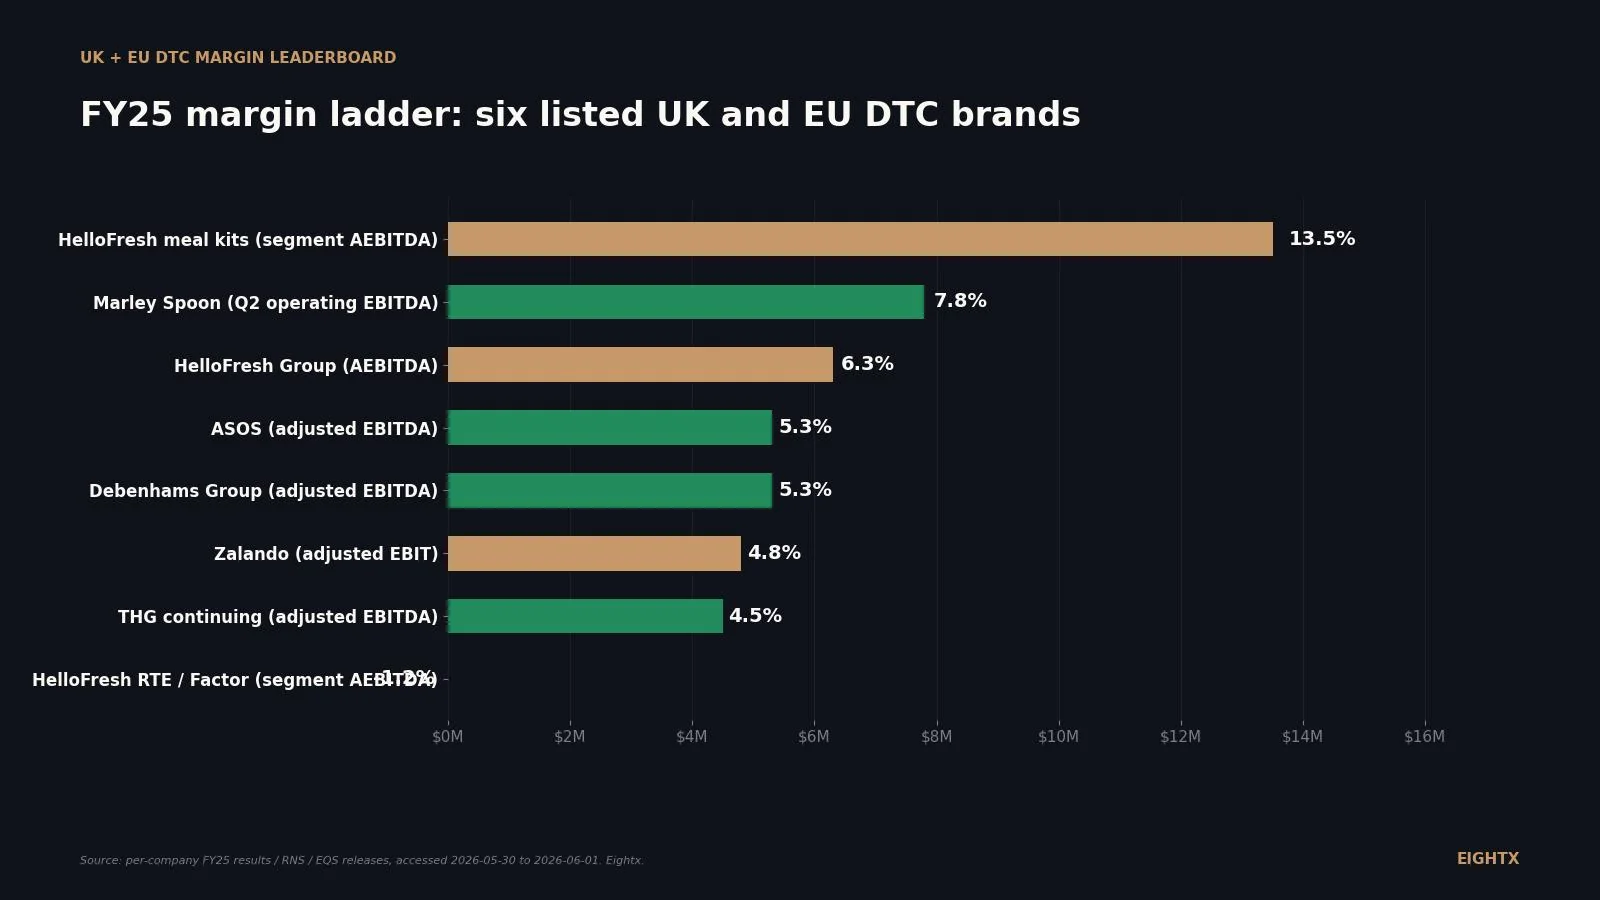
Zalando printed FY25 adjusted EBIT of EUR 590.7 million on EUR 12.3 billion revenue (4.8% margin) and HelloFresh printed 6.3% group AEBITDA on around EUR 6.8 billion. ASOS, THG continuing, and Debenhams Group cluster at 4.5 to 5.3% adjusted EBITDA but carry deep statutory losses from depreciation, impairment, and finance costs. Marley Spoon carries auditor going-concern doubt despite 7.8% quarterly operating EBITDA after a December 2025 debt restructuring that gave its lender conversion rights into up to 80% of equity.
Key Takeaways
- Zalando is the only listed EU pure-play profitable above EUR 10bn revenue; HelloFresh prints higher margin at EUR 6.8bn. Zalando FY25 revenue EUR 12,346.1m (+16.8%), adjusted EBIT EUR 590.7m (4.8% margin), 62.0m active customers. HelloFresh prints 6.3% group AEBITDA on EUR ~6.8bn. The 4.8% Zalando number is the public-market ceiling for apparel marketplace DTC at scale, not the floor.
- HelloFresh flipped meal kits from growth to margin. FY25 AEBITDA EUR 422.8m (6.3% group margin, up from 5.2%). Meal-kit segment AEBITDA hit 13.5% (vs 9.8% FY24). Ready-to-eat / Factor went the other way: -1.2% (vs +1.6%). Italy and Spain exits planned.
- ASOS, THG and Debenhams cluster at 4.5 to 5.3% adjusted EBITDA but cannot print statutory profit. ASOS posted GBP 131.6m adjusted EBITDA on GBP 2.48bn revenue and a GBP 281.6m statutory pre-tax loss. The gap is depreciation, restructuring, impairment and finance costs.
- Marley Spoon carries auditor going-concern doubt despite 7.8% Q2 operating EBITDA. December 2025 restructuring with Runway Growth Finance extended the loan to 2030, increased it to EUR 45.5m, and gave the lender conversion rights into up to 80% of MSSE equity. Capital reduced from EUR 73.6m to EUR 19.6m.
- Three of six in the comp set went through a structural transaction in 2025. THG demerged Ingenuity. Boohoo rebranded to Debenhams Group plc (ticker DEBS) and pivoted to marketplace. Marley Spoon restructured the German operating entity. Expect more spin-outs and capital-structure repairs in 2026-2027.
We track FY25 results for six listed UK and EU direct-to-consumer brands because they're the public-market read on a private operator's margin ambition. Zalando, HelloFresh, ASOS, THG, Debenhams Group (the rebranded Boohoo), and Marley Spoon all reported between September 2025 and May 2026. The margin spread top to bottom is wide. The pattern in why is more useful than the ranking itself: vertical, capital structure, and marketplace-versus-inventory mix explain the ladder. Scale doesn't.
This page is a living index. We refresh quarterly when results land. The June 2026 cut includes Zalando, HelloFresh and THG FY25 finals (March results season), ASOS FY25 (year-end 31 August 2025), Debenhams Group FY25 (year-end 28 February 2025), and Marley Spoon's Q2 2025 plus December restructuring (FY25 full-year accounts not yet finalised, going-concern doubt confirmed).
The FY25 UK and EU DTC margin leaderboard
The leaderboard mixes adjusted and segment metrics because that's how the comp set discloses. HelloFresh's meal-kit segment AEBITDA at 13.5% is the highest single number anyone in the group prints. The four turnaround names (ASOS, Debenhams Group, Zalando, THG continuing) cluster between 4.5% and 5.3% on group adjusted metrics. Three of those four turn deeply negative on statutory: ASOS at -11.4% statutory PBT margin, Debenhams Group at -33.0%, THG continuing at -69.4m PBT (negative low single digits as a margin). Only THG cleared statutory operating profit (GBP 8.1m) in FY25 after the Ingenuity demerger.
Company Exchange FY25 period end Revenue Gross margin Adjusted EBITDA/EBIT Adjusted margin Statutory operating profit (loss) Zalando SE FSE (ZAL.DE) 31 Dec 2025 EUR 12,346.1m n/d in summary EUR 590.7m 4.8% (adj EBIT) n/d in headline release HelloFresh SE FSE (HFG.DE) 31 Dec 2025 EUR ~6,800m n/d separately EUR 422.8m 6.3% (AEBITDA) n/d in summary ASOS plc LSE (ASC.L) 31 Aug 2025 GBP 2,477.8m 47.1% (adjusted) GBP 131.6m 5.3% (AEBITDA) (212.8) operating; (281.6) PBT THG plc (continuing) LSE (THG.L) 31 Dec 2025 GBP 1,716.0m 40.7% GBP 76.6m 4.5% (AEBITDA) 8.1 operating profit; (69.4) PBT Debenhams Group plc LSE (DEBS.L) 28 Feb 2025 GBP 790.3m 52.6% GBP 41.6m 5.3% (AEBITDA) (260.7) PBT Marley Spoon Group SE FSE (MS1.DE) Q2 2025 latest EUR 64.2m (Q) n/d separately EUR 5.0m (op EBITDA, Q) 7.8% (op EBITDA) EUR 1.6m EBIT (Q)
Four different fiscal year-ends across six companies. No two FY25 result sets overlap exactly. We caveat where the year-end matters (Debenhams Group's February cut runs furthest behind the others; ASOS's August cut sits in the middle). The leaderboard ranks numbers from up to ten months apart, not the same calendar year: Debenhams Group's FY25 closed 28 February 2025, before the 2025 tariff cycle that hit Zalando's and HelloFresh's 31 December 2025 cut. Read directional rather than precise.
Zalando and HelloFresh are the only two clearing scale with profit
Zalando printed FY25 revenue of EUR 12,346.1m, up 16.8% (the rise includes ABOUT YOU consolidation from 11 July 2025), with adjusted EBIT of EUR 590.7m at a 4.8% margin (flat YoY) and 62.0m active customers (up 19.7%, also helped by ABOUT YOU). GMV was EUR 17,560.2m. The company funds growth from operating cash. There is no near-term capital structure issue.
HelloFresh printed FY25 revenue of around EUR 6.8bn (down 9% constant currency from EUR 7.7bn in FY24) but AEBITDA of EUR 422.8m at 6.3% margin, up from 5.2% in FY24. The meal-kit segment specifically hit 13.5% AEBITDA margin versus 9.8% in FY24. Ready-to-eat / Factor went the other way: -1.2% AEBITDA versus +1.6% in FY24. Active customers ended Q4 2025 at 7.2m, down from 8.1m. FY26 AEBITDA guidance is EUR 375 to 425m, and the company has flagged Italy and Spain exits.
The two profitable scale operators share one trait: they fund growth from operating cash, not new equity rounds. Everything else in the comp set is some flavour of "still rebuilding the engine."
ASOS, THG and Debenhams: three turnaround stories at the same adjusted tier, three different statutory outcomes
ASOS FY25 (52 weeks to 31 August 2025) cleared GBP 131.6m adjusted EBITDA on GBP 2,477.8m revenue (5.3% margin), with adjusted gross margin of 47.1%. The statutory pre-tax loss was GBP 281.6m. The gap between 5.3% adjusted EBITDA and a GBP 281.6m statutory loss is the entire operator lesson on apparel pure-play DTC at scale: depreciation, impairment, inventory write-downs, and finance costs eat the adjusted-line cushion.
THG plc demerged Ingenuity during FY25 and reported continuing-operations FY25 revenue of GBP 1,716.0m (+2.3% constant currency on a restated basis), gross margin 40.7%, adjusted EBITDA GBP 76.6m (4.5% margin, ahead of the c.GBP 74m guidance), and statutory operating profit of GBP 8.1m. That's THG's first positive operating profit line in years (vs a GBP 147.9m restated operating loss in FY24). Statutory PBT was still negative at -GBP 69.4m. THG Beauty revenue was GBP 1.11bn; THG Nutrition revenue was GBP 609.1m with margin pressured by elevated whey costs.
Debenhams Group plc (rebranded from Boohoo, ticker DEBS.L) reported FY25 revenue of GBP 790.3m (-12% YoY) on the marketplace recognition shift (commission only, not full GMV) and adjusted EBITDA of GBP 41.6m at 5.3% margin (+80bps). Statutory loss before tax was GBP 260.7m. Group GMV pre-returns was GBP 1,606.8m. Debenhams brand GMV specifically hit GBP 654.0m (+34%) with GBP 25m adjusted EBITDA on that line. Youth Brands (Boohoo + boohooMAN + PrettyLittleThing) GMV was GBP 795.6m (-19%). Per the H1 FY26 interim, the Debenhams marketplace is tracking to ~20% EBITDA margin and GBP 1bn GMV / GBP 50m+ EBITDA within three years.
Three brands at the same adjusted tier, but the statutory picture diverges: THG is just inside operating profit, ASOS is GBP 213m in operating losses, Debenhams Group is GBP 260m in PBT losses. The variable is which write-downs, impairments and finance costs each carries. The lesson for a private operator is that adjusted EBITDA at 5% is not the same as a business that can fund itself.
Marley Spoon: the going-concern read-across for sub-scale listed DTC
Marley Spoon Group SE printed Q2 2025 net revenue of EUR 64.2m (-21.6% constant currency), a record-high contribution margin of 37.6% (+295bps), operating EBITDA of EUR 5.0m at 7.8% margin (+652bps), and EBIT of EUR 1.6m. Quarter-end cash was EUR 5.2m and operating cash flow was -EUR 2.6m. The revenue decline was deliberate (the company cut marketing spend by approximately 49% and divested Chefgood Australia).
The structural news landed 12 December 2025 and closed 24 April 2026. The Runway Growth Finance loan was extended to 31 December 2030 and increased to approximately EUR 45.5m at the April 2026 closing (non-subordinated portion EUR 15.0m, up from EUR 8.2m). The lender holds conversion rights into up to 80% of the German operating subsidiary's equity (subordinated portion) plus up to EUR 4.0m of non-subordinated conversion, with a 1% warrant at the Marley Spoon Group SE parent. Capital was reduced from EUR 73,559,137 to EUR 19,615,768 to absorb accumulated losses. A two-holding-company structure was put in place to secure US lender enforcement.
FY25 auditor going-concern doubt was confirmed in public reporting. The operating engine is improving on every contribution-line metric Marley Spoon discloses, but capital structure is now the binding constraint. The read-across for the rest of the listed sub-scale DTC universe is that equity-market patience has run out and lender patience is what's keeping these names afloat.
What the leaderboard tells a private DTC operator at GBP 5 to 50m revenue
Three things to do with this comp set if you're at GBP 5 to 50m revenue running a private DTC brand.
Set your adjusted EBITDA target 100 to 300 bps above the listed peer at your vertical. Eightx's read across 100+ private DTC engagements is that private operators clear structurally higher EBITDA than listed peers, often 100 to 300 bps; this is an operator heuristic, not a measured industry benchmark. A private apparel brand benchmarking against Zalando's 4.8% adjusted EBIT should target 6 to 8% on a comparable adjusted EBITDA basis. Listed brands carry public-company G&A burden (board fees, audit, investor relations, regulatory reporting) that you do not. Your structurally lower fixed cost base should translate into a structurally higher operating margin at any given revenue level.
Watch the gap between your adjusted EBITDA and your statutory operating result. The ASOS-THG-Debenhams pattern shows that 5% adjusted EBITDA does not mean a healthy business. If your depreciation, inventory write-downs, and finance costs eat the entire adjusted line, you're funding growth from new capital, not from operations. The public-market test is what private buyers and acquirers will apply too. Run a statutory-equivalent operating margin on your own P&L quarterly.
Pick your channel model deliberately, not by default. The Debenhams marketplace pivot reduces revenue but should lift margin over time. HelloFresh's meal-kit subscription model carries inventory but locks in repeat. ASOS's inventory model with a marketplace overlay sits in the middle and carries the worst statutory outcome of the three. The choice of inventory model, channel model, and marketplace exposure determines the margin ceiling more than any operational improvement you can stack on top.
Listed-market scale is no longer a margin advantage. Zalando's 4.8% adjusted EBIT on EUR 12.3bn is what the public market currently rewards, and it sets a ceiling, not a floor, for what private DTC should target. If you're at GBP 20m revenue and clearing 6 to 8% adjusted EBITDA, you are running ahead of the listed peer set on a like-for-like basis.
Active customer divergence: Zalando added 10m, HelloFresh lost 0.9m
Only two of the six brands disclose active-customer counts at group level. Zalando added 10.2m customers in FY25 (51.8m to 62.0m) including the ABOUT YOU consolidation. HelloFresh shed 0.9m customers (8.1m to 7.2m at Q4 2025) as it focused on higher-value tenured customers. The other four brands either don't disclose or disclose at brand level only, which is a transparency-gap signal as much as a comp-set comparison.
The HelloFresh trajectory matters more than the customer-count drop suggests. The 7.2m active customers in Q4 2025 produced higher per-customer revenue and a 13.5% meal-kit AEBITDA margin. The 8.1m active customers in Q4 2024 produced lower per-customer revenue and a 9.8% segment margin. Fewer customers, more profit per customer, higher margin. That's the meal-kit story for FY25 and the answer to why HelloFresh sits second on the leaderboard.
Sources and methodology
This leaderboard pulls from each company's most recent FY25 (or Q2 2025 for Marley Spoon) results release, RNS or EQS announcement, accessed via investor relations sites and the LSE / Frankfurt exchanges between 30 May 2026 and 1 June 2026. The primary sources are the Zalando FY 2025 press release at corporate.zalando.com, the HelloFresh Q4 / FY 2025 press release PDF on Contentful, the ASOS FY25 trading update PDF dated 30 September 2025, the THG plc Preliminary FY 2025 results RNS on the London Stock Exchange (article 17520504), the Debenhams Group FY25 results RNS PDF (26 August 2025), and the Marley Spoon Q2 2025 EQS release plus the 12 December 2025 ad-hoc and 24 April 2026 closing ad-hoc covering the restructuring.
We use the adjusted profitability metric each company reports as its headline operating measure. Zalando reports adjusted EBIT. HelloFresh, ASOS, THG and Debenhams Group report adjusted EBITDA (AEBITDA in HelloFresh's case). Marley Spoon reports operating EBITDA. We surface segment-level metrics where they materially differ from group (HelloFresh meal kits vs ready-to-eat / Factor, THG Beauty vs Nutrition). We surface statutory operating profit or loss and statutory pre-tax loss where the adjusted-to-statutory gap is the operator-relevant story (ASOS, THG, Debenhams Group).
Companies House was not separately pulled for this comp set because all six companies are publicly listed and disclose group-level financials at exchange level. Storeleads was queried and returned no coverage on any of the six brands (all run custom enterprise commerce stacks, not Shopify). Channel-mix triangulation is therefore from company disclosures only.
Limitations. First, four different fiscal year-ends across six companies (28 Feb, 31 Aug, 31 Dec twice, plus Marley Spoon Q2 cut). No two FY25 result sets overlap exactly. Second, adjusted definitions are not consistent across the comp set. Third, Marley Spoon FY25 full-year accounts were not finalised at the time of this cut, so Q2 2025 is shown as latest available. Fourth, gross margin disclosure is inconsistent: only Debenhams Group, ASOS and THG disclose group-level gross margin in the headline release. Fifth, active-customer counts are only disclosed by Zalando and HelloFresh at group level. Sixth, the comp set spans GBP and EUR. We show native currency per company in tables rather than translating, because operator readers know the relative scale.
Update cadence. This tracker is refreshed quarterly aligned to the heaviest disclosure month: April for HelloFresh, Zalando and THG (FY finals); late September for ASOS (FY year-end 31 August); late August for Debenhams Group (FY year-end 28 February interim); variable for Marley Spoon. Next refresh target: September 2026.
For the cross-Atlantic view, see the DTC layoff and hiring tracker for the labor-cost side of the same brands. For the UK private-market read on margin by vertical, see the average UK ecommerce margin by vertical benchmark.
Frequently asked questions
which uk or eu listed dtc brand has the highest margin in 2025?
On a segment metric, HelloFresh's meal-kit segment leads at 13.5% AEBITDA. On a group adjusted metric, HelloFresh leads again at 6.3% AEBITDA. Marley Spoon prints 7.8% operating EBITDA at the quarter level but carries an auditor going-concern qualification at the full-year, so it does not really belong on a like-for-like leaderboard. The other four (Zalando, ASOS, Debenhams, THG continuing) cluster between 4.5% and 5.3% on adjusted metrics.
is hellofresh actually profitable or is the meal kit story still losing money?
The meal-kit segment is profitable and getting more so (13.5% AEBITDA in FY25, up from 9.8%). The ready-to-eat / Factor segment swung negative (-1.2% AEBITDA, down from +1.6%). Group AEBITDA was EUR 422.8m at 6.3% margin, so the company prints profit at the consolidated line. The risk isn't meal kits, it's the ready-to-eat unit and the Italy / Spain exits the company has flagged for FY26.
why did zalando buy about you and what did it do to revenue?
Zalando consolidated ABOUT YOU from 11 July 2025. FY25 group revenue jumped to EUR 12,346.1m (+16.8% YoY) and active customers rose to 62.0m (+19.7%) on the consolidation. The strategic read is marketplace defence against Shein and Temu. The financial read is that the underlying growth rate of legacy Zalando in FY25 was much lower than the +16.8% headline. Treat any post-deal comparison carefully.
how does the asos margin compare to debenhams group and boohoo in 2025?
ASOS and Debenhams Group are both at 5.3% adjusted EBITDA margin in FY25, on very different revenue bases (GBP 2.48bn for ASOS, GBP 790.3m for Debenhams Group). ASOS holds inventory; Debenhams Group is now a marketplace, which is why Debenhams revenue is so much lower than its GMV. Both still print large statutory losses (ASOS -GBP 281.6m PBT; Debenhams -GBP 260.7m PBT). The marketplace pivot reduces revenue but should lift margin over time. On Boohoo specifically: the Boohoo brand sits inside Debenhams Group's Youth Brands segment (GMV GBP 795.6m, -19% YoY) and standalone brand EBITDA is no longer disclosed after the group restructure.
did thg become profitable after the ingenuity demerger?
Just barely on statutory operating profit (GBP 8.1m), versus a GBP 147.9m restated operating loss in FY24. Adjusted EBITDA was GBP 76.6m on GBP 1,716.0m revenue (4.5% margin), ahead of the c.GBP 74m guidance. Statutory PBT was still negative at -GBP 69.4m because of finance costs. So the answer is: operating-line profitable on a statutory basis for the first time in years, not yet PBT-positive.
what is going on with marley spoon and is it going bankrupt?
Q2 2025 operating EBITDA was 7.8% margin on EUR 64.2m revenue, contribution margin hit a record 37.6%, and operating cash flow was -EUR 2.6m. In December 2025 the company restructured the loan from Runway Growth Finance: extended to 31 December 2030, increased to EUR 45.5m at April 2026 closing, with lender conversion rights into up to 80% of the German operating subsidiary's equity. Capital was reduced from EUR 73.6m to EUR 19.6m. FY25 auditor going-concern doubt was confirmed. The company is operating but the lender now holds most of the downside protection.
how should a private uk or eu dtc brand benchmark against zalando or hellofresh?
Add 100 to 300 bps to the listed-peer adjusted EBITDA at similar revenue scale. This is Eightx's operator read across 100+ private DTC engagements, not a measured industry benchmark: private operators clear structurally higher EBITDA than listed peers because they carry less public-company G&A burden, simpler capital structure, and no quarterly disclosure cycle. So a private apparel brand at GBP 20m revenue benchmarking against Zalando's 4.8% should target 6 to 8% on a comparable adjusted EBITDA basis. Meal kits private benchmark is closer to HelloFresh's 13.5% segment number than the 6.3% group number.
what does the difference between adjusted ebitda and statutory pre-tax loss actually tell me about an ecom brand?
Adjusted EBITDA strips out depreciation, amortisation, interest, tax, and 'one-off' items the management team flags. Statutory pre-tax profit puts depreciation, impairment, most one-offs and finance costs back in. The gap tells you how much of the business's margin is being eaten by past capital decisions (warehouses, IT spend, acquisitions), ongoing restructuring and debt service. On a consistent adjusted-EBITDA-to-statutory-PBT basis: ASOS gap is GBP 413.2m (GBP 131.6m AEBITDA vs -GBP 281.6m PBT); THG gap is GBP 146.0m (GBP 76.6m AEBITDA vs -GBP 69.4m PBT); Debenhams Group gap is GBP 302.3m (GBP 41.6m AEBITDA vs -GBP 260.7m PBT). Big gaps mean the underlying operating engine is healthier than the headlines suggest, but the company can't yet earn back what it invested or borrowed.