
Insights
Working capital drag calculator: what your cash conversion cycle costs in 2026
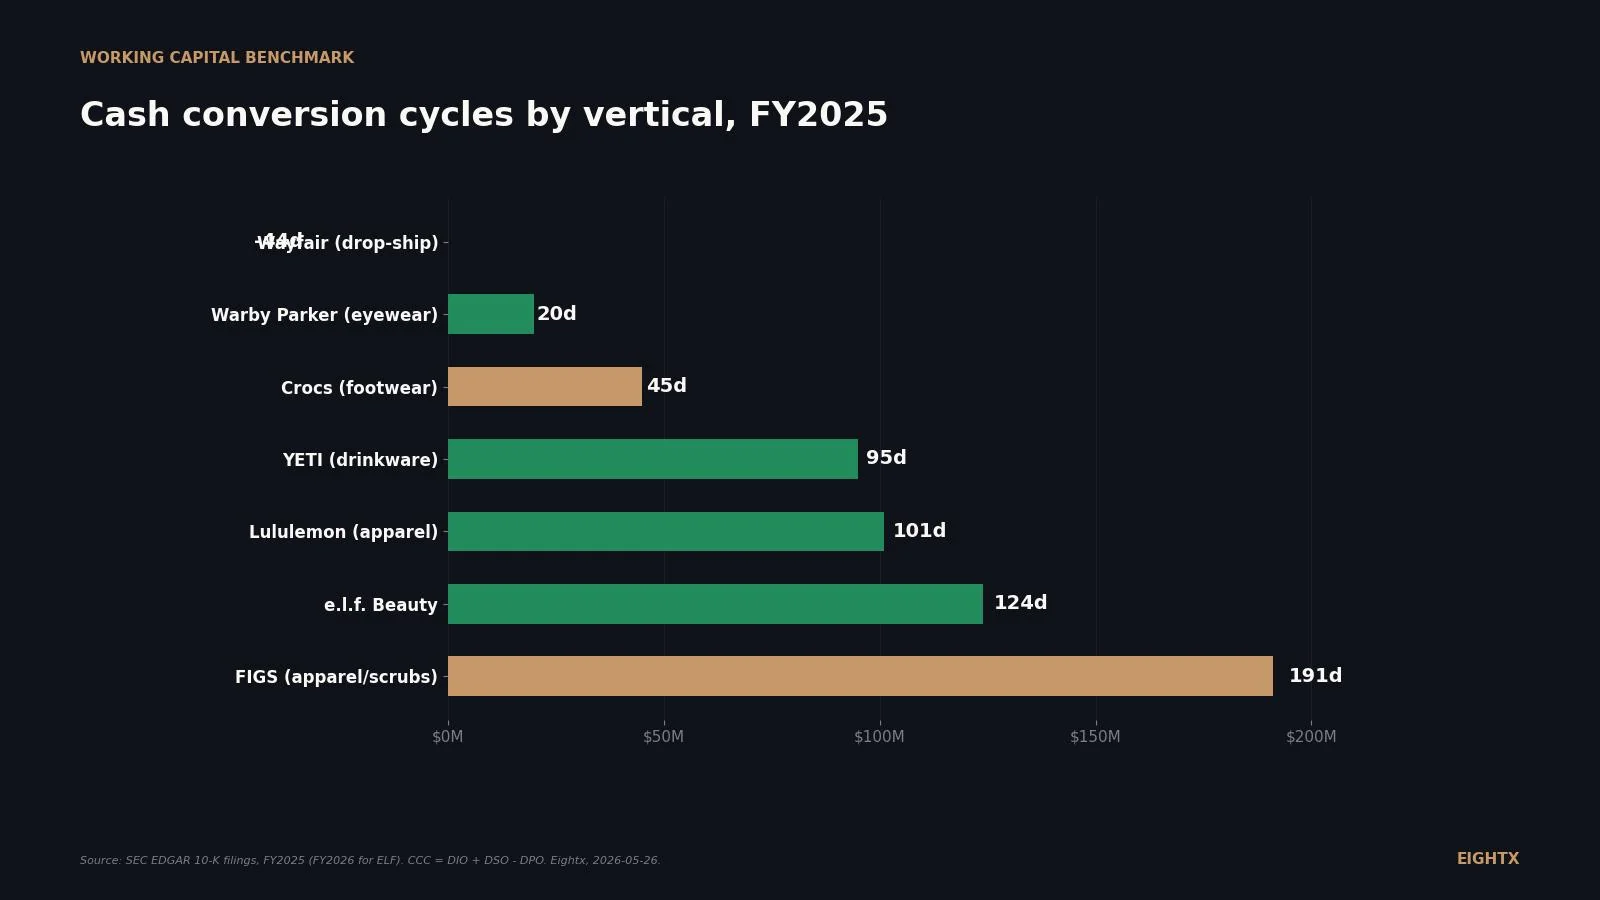
Every $1M trapped in your inventory and receivables cycle costs about $120,000 a year at a 12% cost of capital. Public DTC cash conversion cycles range widely, from FIGS at 191 days to Wayfair at negative 44 days. With the Federal Funds rate at 3.64% in April 2026, down from a 5.33% peak, the cost of carrying working capital has eased but compressing your cycle remains one of the highest-leverage cash moves a brand can make.
Key Takeaways
- The Fed Funds rate has dropped 170 bps in 18 months, but US bank prime is still 6.75% and most $5-20M DTC operators actually borrow at 11-22%. Cost of carry on trapped working capital has barely moved for the brands that have to finance it.
- Public DTC cash conversion cycles run 9x apart by vertical: Wayfair at -44 days (drop-ship), Crocs 45, YETI 95, LULU around 101, ELF 124, FIGS 191. Your vertical sets the floor, not the ceiling.
- At a 12% cost of capital, every $1M of trapped working capital costs you $120,000 a year. A $20M apparel brand carrying a FIGS-like cycle has about $5.83M of working capital trapped and pays roughly $700,000 a year in carry cost alone.
- DPO is the underused free lever. Crocs runs 58 days payable, YETI 68, ELF 65. Extending payables 10 days on $200K of monthly purchases releases about $66K with zero financing cost.
- The calculator below uses 12% as the default cost of capital because that's where actual DTC borrowing sits, not headline prime. Drag it up to 25% if you're on RBF, 50% if you're on MCA.
Most operators we talk to don't carry too much inventory by accident. They carry it on purpose, for reasons that made sense at the time. Then prime sits at 6.75% for two years and the math turns against them. The calculator below converts your DIO, DSO, and DPO (days inventory outstanding, days sales outstanding, days payable outstanding) into a dollar figure you can argue with. It uses 12% as the default cost of capital, not 6.75%, because that's where most $5-20M DTC operators actually borrow.
What working capital drag actually costs you in 2026
The Federal Funds Effective Rate has dropped from a peak of 5.33% in August 2024 to 3.64% in April 2026, a 170 bps decline. US bank prime tracked it most of the way down but stopped at 6.75%. That's the headline rate. The rate that actually applies to a private DTC brand depends on where you sit in the financing stack.
A $5M to $20M DTC operator with a bank line is typically priced at prime+400 to prime+700 (i.e., bank prime plus 400-700 basis points), so 10.75% to 13.75% all-in. A brand on RBF (revenue-based financing) is paying a 6-12% fee on principal that translates to 14-22% effective APR if you pay it off in 6-12 months, higher if you pay it off faster. A brand on MCA is paying 30-80% APR. The cheapest rate you'll actually see in this band is 7-9% on a SOFR-linked ABL secured by inventory and AR, and that's only if your collateral and financials clear the underwriting.
The dollar math is the part most operators don't run. Every $1M trapped in your working capital cycle, at a 12% blended cost of capital, costs you $120,000 a year. That's roughly $329 a day, per million, before you've sold a single extra unit. On a $20M apparel brand carrying a FIGS-like cycle (212 DIO, 3 DSO, 24 DPO, 191-day CCC, 55% COGS), the trapped working capital is roughly $5.83M and the carry cost alone is about $700K a year. Pull that to a Crocs-like cycle (79/24/58, 45-day CCC) and trapped capital drops to about $1.95M, releasing roughly $3.88M of cash plus saving about $466K a year on the carry. That's a 2.3 percentage-point net margin lift with no extra revenue.
The CCC formula and the three levers you actually control
Cash conversion cycle is one formula with three operator-relevant inputs:
CCC = DIO + DSO - DPO
- DIO (days inventory outstanding) is how many days of cost-of-goods-sold you carry as inventory at any time. Calculation: (average inventory ÷ COGS) × 365. This is the biggest lever for most product DTC brands.
- DSO (days sales outstanding) is how many days it takes customers to pay you. For pure ecom, this is 2 to 7 days because Shopify and Stripe settle fast. For wholesale-heavy brands, it's 30 to 60.
- DPO (days payable outstanding) is how many days you take to pay your suppliers. The bigger this number, the less of your own cash is funding inventory in transit. This is the free lever most $5-20M brands underuse.
Each lever moves independently, and the size of each lever depends on your vertical. Apparel brands have huge DIO and tiny DSO. Drop-ship marketplaces have nearly zero DIO and DSO and live entirely on DPO. The first move is to figure out which lever is yours.
Public DTC benchmarks by vertical (FY2025)
We pulled the most recent 10-K filings for seven public DTC and consumer brands and computed CCC the same way for each: average inventory, average AR, and average AP across the fiscal year, then DIO, DSO, DPO, and CCC.
The full breakdown:
Company Vertical Revenue ($M) DIO DSO DPO CCC Wayfair Home (drop-ship) 12,457 3 4 51 -44 Warby Parker Eyewear 872 44 1 25 20 Crocs Footwear 4,041 79 24 58 45 YETI Drinkware 1,868 138 26 68 95 Lululemon Athletic apparel 11,103 119 ~5 23 ~101 e.l.f. Beauty Beauty 1,636 156 34 65 124 FIGS Apparel (scrubs) 631 212 3 24 191
Three patterns worth naming. Wayfair's -44 days is a drop-ship model, not an aspiration. If you own your inventory and run your own fulfillment, you cannot replicate this; your floor is closer to YETI's 95 days or Crocs' 45. FIGS at 191 days is what a pure-play DTC apparel brand looks like when inventory commitments run six months ahead of sell-through. Crocs at 45 days proves that an apparel-adjacent brand can run a clean cycle if DPO sits at 58 and inventory turns are tight.
The calculator: what your cycle actually costs
The fastest unlocks: DPO first, then DIO
If you took one lesson from the public benchmarks above, it should be that Crocs (45 days CCC) and ELF (124 days CCC) both run DPO over 58 days. The footwear and beauty verticals both figured out that paying suppliers slower is the cheapest source of working capital available. FIGS runs DPO at 24 days. That's where the 191-day cycle comes from.
The Eightx CFO playbook on DPO isn't "push net-30 to net-60" blanket. It's negotiating a revolving credit cap with key suppliers: a ceiling of $X open at any time, in exchange for a 12-month volume guarantee. One of our senior CFOs closed a £70K cap with a long-term supplier for a client last year. The supplier got predictability; the client got the equivalent of a free 30-day line of credit. That's the move, not blanket net-60.
DIO is the second lever, and it's operational, not relational. The mechanics are forecast accuracy (fewer false bets on stock-keeping units that don't sell through), MOQ discipline (don't take the supplier's 5,000-unit minimum if your model says 3,000), and pre-order on high-consideration items if your category supports it. In our portfolio, we've seen clients pull 30 days of DIO in two quarters via these moves alone. At a 12% cost of capital and 55% COGS, 30 days of inventory on a $20M brand is about $904K in released cash and $108K a year in saved carry.
DSO is the third lever and the smallest for most pure-DTC operators. If you sit on Shopify with Stripe or Shopify Payments, you're already at 2 to 7 days. The DSO conversation worth having is on the wholesale channel. Big-box retailers default to net-60 and the negotiation to net-45 or net-30 is hard but possible if you have leverage (exclusive SKU, sell-through data, alternative buyers). For DTC operators with a wholesale arm, this is where the DSO lever has actual size.
What changes if rates drop another 100 bps in 2026
The Fed dropped 170 bps in 18 months and US bank prime followed most of the way. A further 100 bps cut would take bank prime to about 5.75% and reprice SOFR-linked lines to roughly 6-8% all-in for the brands that qualify. But most $5-20M DTC borrowers wouldn't see the full 100 bps because the spread on smaller credit facilities (prime+400 to prime+700, i.e., bank prime plus 400-700 basis points) widens when banks tighten underwriting in a slower-growth environment.
RBF and MCA pricing barely moves with the Fed at all. RBF caps are priced on growth velocity and underwriting model risk, not the rate environment. MCA pricing is structurally 30-80% APR regardless of what the Fed does. If your real cost of capital is closer to RBF or MCA than bank prime, a 100-bp Fed cut saves you essentially nothing.
The practical read: don't wait for rates to come to you. The carry on $1M trapped at 12% is $120K a year. At 11% it's $110K. The $10K saving from a 100 bps cut is real but small compared to the $100K-plus a year a $20M brand can save by pulling 30 days out of DIO. Fix the cycle now; treat any rate relief as a bonus.
Most operators we talk to don't carry too much inventory by accident. They carry it on purpose, for reasons that made sense at the time. The calculator gives you a number. What you do with it depends on whether the risk-mitigation premium still pencils at your actual cost of capital, not headline prime.
For more on how rate-environment shifts hit DTC unit economics, see our Fed Funds vs. DTC cost of capital post, and the calculator's standalone tool page at /tools/working-capital-drag-calculator.
Sources and methodology
Cost-of-capital data. FRED series DFF (Federal Funds Effective Rate) and DPRIME (US Bank Prime Loan Rate), both pulled at monthly average frequency for January 2020 through April 2026. DFF current value (April 2026): 3.64%. DPRIME current value (April 2026): 6.75%. SOFR was also reviewed (FRED series SOFR) and tracks DFF closely (3.64% April 2026). Rates are hard-coded into the calculator as of 2026-04 with FRED citations; we refresh quarterly.
Working capital benchmarks. Pulled directly from each company's annual report filed with the SEC, using the reported inventory, cost-of-goods, revenue, accounts-payable, and accounts-receivable lines.
Per-company fiscal years. Lululemon FY2025 ended 2026-02-01 (accession 0001397187-26-000020). YETI FY2025 ended 2026-01-03 (accession 0001670592-26-000013). Crocs FY2025 ended 2025-12-31 (accession 0001334036-26-000006). FIGS FY2025 ended 2025-12-31 (accession 0001628280-26-012333). Warby Parker FY2025 ended 2025-12-31 (accession 0001504776-26-000006). Wayfair FY2025 ended 2025-12-31 (accession 0001616707-26-000027). ELF Beauty FY2026 ended 2026-03-31 (March year-end, accession 0001600033-26-000020).
Pricing benchmarks for the cost-of-capital input. Bank LOC / ABL secured by inventory and AR: SOFR + 350-500 bps, about 7-9% all-in. Strong-credit bank line: SOFR + 200-300 bps, mid-to-high single digits. Fintech working-capital loans: 6-20% APR (prime borrowers 5.9-7.5%). Specialized inventory financing (Wayflyer, Settle, Kickfurther, Clearco, Parker, Dwight Funding): 18-30% effective APR; advance rates 50-80% of inventory value. RBF flat-fee structure: 6-12% fee on principal; effective APR 15-45% depending on payoff speed; can hit 40-350% in extreme fast-growth cases because the total payback is fixed, so fast growth penalizes you in APR terms. MCA (merchant cash advance): 35-80% effective APR.
RBF provider landscape (as of 2026-05). Wayflyer (advances $10K-$20M, fees 6-12%, 6 months history minimum, recent $250M facility with ATLAS SP Partners), Clearco (fixed fees 3.5-22%, requires 12+ months history and $100K+ monthly revenue), Settle (CPG inventory and working capital, $300K TTM revenue minimum), Parker (case-by-case pricing), Dwight Funding (asset-backed lending for the $15-50M revenue band). These are surfaced in the calculator's cost-of-capital tooltip and pricing presets.
Limitations. Lululemon does not tag AccountsReceivableNetCurrent or AccountsReceivableNet as us-gaap concepts in EDGAR XBRL; LULU's AR is small and embedded in "Prepaid expenses and other receivables." We estimated LULU DSO at less than or equal to 5 days given more than 95% retail and DTC revenue mix, and we keep LULU in the headline chart with this footnote. Average balances use a simple two-point average (beginning + ending) / 2; a four-quarter average would deviate by less than 5% in most cases. We did not pull Stitch Fix, Revolve, Allbirds, On Holding, or Chewy for this v1; the marginal value vs. complexity is low given the spread already shown by our seven. Storeleads private-brand benchmark expansion is logged for v2.
Operator voice and the 250-day flag. The "250 days of inventory" trigger Eightx CFOs use to flag a working-capital problem comes from real client calls in 2025-01 and 2025-08. The DPO-cap playbook (negotiate a revolving credit cap with a key supplier, not blanket net-60) is from a 2025-08-06 client call with one of our senior CFOs. Client names are redacted; team-member quotes are paraphrased and on the record.
Update cadence. Quarterly. Next refresh: August 2026 after Q2 2026 10-K and 10-Q wave lands and FRED publishes the May 2026 prime print.
Frequently asked questions
what's a good cash conversion cycle for a $10m dtc apparel brand?
Use the public benchmarks as guardrails. For apparel, the public range runs about 100 to 191 days (LULU around 101, FIGS at 191). A healthy private brand of your size should land closer to 90 to 110 days; anything above 150 means you're financing inventory the market doesn't reward. Pull DIO toward 90 days first, then push DPO toward 45.
what cost of capital should i use if i don't have a credit line?
Use the rate you'd pay to free up the cash some other way. If you're funding inventory with a $5K MCA at 50% APR, that's your real cost. If you're paying down a 12% RBF cap early, that's your real cost. Don't use bank prime (6.75%) unless you actually have a bank line. The calculator default is 12% because that's where most $5-20M DTC operators actually sit.
how do i extend dpo without damaging supplier relationships?
The version Eightx CFOs run on real calls isn't 'push net-30 to net-60' blanket. It's negotiating a revolving credit cap (e.g., 'we can run $X open with you at any time'). One Eightx senior CFO closed a £70K cap with a long-term supplier for a client last year. Frame it as a forecasting commitment, not a payment delay: longer terms in exchange for a 12-month volume guarantee.
is it worth paying my suppliers early for a 2% discount when prime is 6.75%?
Almost always yes, but only if your real cost of capital is below about 36%. A 2/10 net 30 discount works out to roughly 37% annualized. If you're on bank prime (6.75%) or even an RBF at 25%, take the discount. If you're financing inventory with an MCA at 50%+, the discount is more expensive than the carry. Run the math against your actual rate, not headline prime.
should i factor my receivables if my dso is over 30 days?
For pure DTC, no, your DSO is already 2 to 7 days and factoring would cost more than the cycle. For wholesale-heavy brands with net-60 terms from big-box buyers, factoring at 1-3% per month is sometimes cheaper than RBF and definitely cheaper than MCA. Run two scenarios side by side: factor cost vs. cost of carry on the AR balance at your actual cost of capital.
how much working capital does a $20m dtc brand actually need?
Rule of thumb: 90 to 120 days of COGS plus two months of fixed costs plus a seasonal buffer. On $20M revenue at 55% COGS, that's roughly $2.7M to $3.6M in inventory, plus another $300K to $500K in fixed-cost coverage, plus your seasonal Q4 inventory build. A clean DTC apparel brand should target $3M to $4M in working capital availability, not the $8M to $10M most operators end up holding.
what if the fed cuts rates another 100 bps in the next 12 months?
Your headline cost of capital on a bank line drops about 100 bps, but most $5-20M DTC brands won't see the full benefit because the prime+400 to prime+700 spread on smaller credit facilities widens when banks tighten underwriting. RBF and MCA pricing barely moves with the Fed. The sensitivity panel in the calculator shows what 100 bps actually saves you on your specific cycle: usually about $10K per $1M trapped.
how do tariffs change my working capital requirements in 2026?
Tariffs increase DIO two ways. First, you pay duty at port of entry, which adds 15-30% to your inventory cost basis. Second, the typical reaction is to over-order ahead of the next tariff round, which spikes DIO further. We've seen clients add 30 to 45 days of DIO post-tariff. If you're sitting on extra inventory specifically to hedge a tariff cycle, that hedge has a real cost: feed it into the calculator at your actual cost of capital to see what the hedge is costing you per quarter.