
Inventory
Size-Curve and SKU Inventory Economics: The Hidden Margin Trap in Apparel 2026
An apparel SKU can read sold out and still lose money. Buy to a flat size curve and your core sizes stock out early while fringe sizes pile up and get marked down. The fix: set the curve from clean, in-stock, full-price sell-through and recalculate it every order cycle.
Key Takeaways
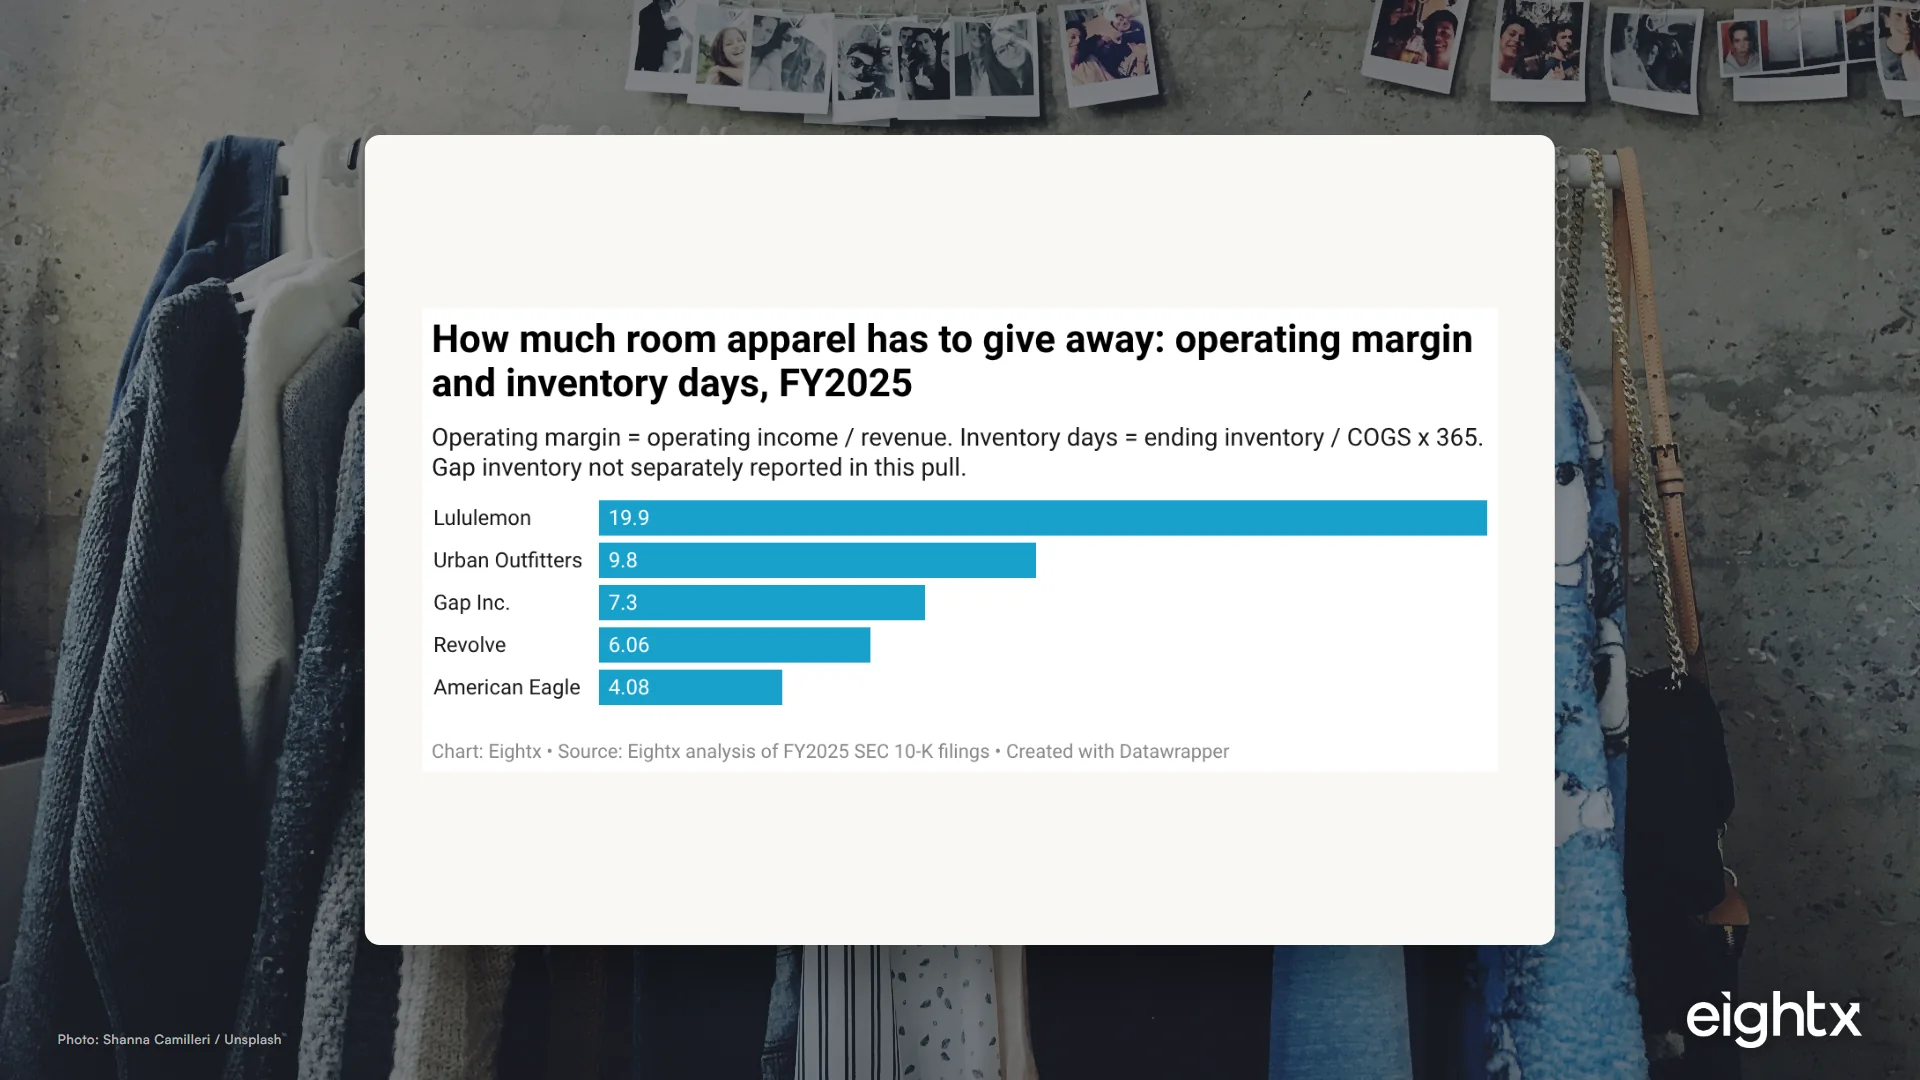
- Public apparel operating margins run from 4.08 percent (American Eagle) to 19.9 percent (Lululemon), with the DTC midpoint around 6 percent, so a few points of markdown drag can wipe out a style's profit.
- Set the size curve from clean, full-price, in-stock weeks only; markdown-period and stockout-distorted sales bias the curve toward the wrong sizes.
- A SKU can hit 100 percent unit sell-through and still lose money if the last 30 to 40 percent of units cleared at 50 percent off.
- In our worked example a 1,000-unit buy on a flat curve nets about 4,600 dollars (roughly 11 percent) less gross profit than the same buy on the right curve, purely from broken sizes and markdowns.
- Private apparel brands should target 30 to 60 days of inventory, not the 65 to 147 days public comps carry; broken size runs are what push days on hand the wrong way.
In apparel, "sold out" is one of the most expensive lies in your dashboard. A style can read 100 percent sell-through and still have lost you money, because the headline number hides what actually happened underneath it: your core sizes cleared at full price in the first three weeks, and the last few hundred units, all in the fringe sizes nobody reached for, only moved after you cut the price in half. The SKU is gone from the warehouse. So is a chunk of the margin you thought you booked.
This is the hidden margin trap in apparel, and it lives entirely inside the size curve, the split of how many units you buy in each size. Get the curve wrong and you stock out of M and L while XS and XXL sit there aging into markdown stock. In a vertical where the cleanest public DTC comp (Revolve) ran a 6.06 percent operating margin in FY2025, a few points of markdown drag per style is the difference between a profitable line and a break-even one. Here is how to set the curve from your own sell-through, and why broken sizes cost you twice.
Apparel has almost no margin to give away
Start with the numbers that should scare you into caring about size curves. Pulled directly from FY2025 SEC 10-K filings, public apparel operating margins run from American Eagle at 4.08 percent and Revolve at 6.06 percent, up through Gap at 7.3 percent and Urban Outfitters at 9.8 percent, to Lululemon at 19.9 percent. The premium leader is the exception. Normal, well-run public apparel is a 4 to 10 percent operating margin business, and the cleanest DTC comp sits right at 6 percent.
That thin margin is exactly why markdowns hurt so much here. Apparel gross margins sit in the 36 to 57 percent range across that cohort, but the gap between gross and operating margin gets eaten by marketing, returns, and discounting. When you mark a unit down 50 percent, you do not just lose half the price. You lose it against a cost base you already committed, on a style where you had maybe six points of operating margin to begin with. The markdown does not trim the profit. It can erase the whole style's contribution.
We are honest about how hard this vertical is. When I talk to founders running apparel brands at this size, the line that comes up again and again is some version of "apparel is such a hard game to be in right now." Matt has lived it from the operator seat too: he bought an apparel business with a partner and it flamed out. None of the discipline below is theoretical. It is the stuff that decides whether a thin-margin style survives the season.
Why a sold-out SKU still loses money
The mistake is reading inventory health on a unit basis. Total units bought, total units sold, sell-through percentage. On that view a SKU that clears 100 percent looks like a win. It often is not, because units are not the same as margin, and a size run does not clear evenly.
Here is the sequence that plays out on a poorly bought style. The core sizes, usually M and L, sell fastest. They hit 95 percent plus sell-through within weeks and effectively stock out. The moment that happens you have a broken size run: a customer who wears L cannot buy, so you lose the incremental full-price sale, and worse, that customer often leaves without buying anything at all. Meanwhile the fringe sizes, XS and XXL, are still sitting at around 40 percent sell-through. Now you are stuck. You cannot reorder just the core sizes economically mid-season, and the only way to move the fringe before end of season is to mark it down.
That picture is the whole problem in one chart. The SKU will eventually report a high blended sell-through, but the price mix is wrong: the core went out at full price and the tail went out at clearance. The pattern we hear from operators is exactly this. One founder described a year that "got off to a rocky start and then we were sold out of best sellers by June, July." Selling out of your best sizes early is not a win. It is the broken run starting, and an out-of-stock best seller can quietly turn a 25 to 30 thousand dollar day into an 8 to 10 thousand dollar one.
The cost is not only margin, it is cash. When we have sat with a brand trying to value the stuff left in the warehouse, the math is brutal: a lender we worked through valued branded inventory at "57 cents on the dollar, and for private label it's 49 cents on the dollar." A stranded run of XS and XXL is not a number on a spreadsheet that you recover later. It is cash you converted into 50-cent dollars. Poor size-level visibility is estimated to cost apparel retailers up to roughly 20 percent of profit, with item-level stock accuracy often only 55 to 80 percent, so most of this is a planning and allocation problem, not true demand weakness.
The worked example: same buy, two curves
Take a single style. A 1,000-unit buy, 80 dollars retail, 32 dollars landed cost, so a 60 percent gross margin and 48 dollars of gross profit per unit at full price. Now compare two ways of splitting that 1,000 units across the size run.
The flat buy spreads units roughly evenly with a slight core lean. The core sizes sell out at full price, the fringe sizes only clear at 50 percent off (40 dollars, which is 8 dollars of gross profit per unit). The sell-through-weighted buy puts the units where the demand actually is, so far less stock ends up in the markdown bin.
| Size | Flat buy units | Flat full-price sales | Flat marked-down units | Right-curve units | Right-curve marked-down units |
|---|---|---|---|---|---|
| XS | 120 | 60 | 60 | 70 | 20 |
| S | 200 | 170 | 30 | 180 | 10 |
| M | 220 | 220 (stocked out) | 0 | 280 | 0 |
| L | 220 | 220 (stocked out) | 0 | 290 | 0 |
| XL | 160 | 130 | 30 | 130 | 10 |
| XXL | 80 | 35 | 45 | 50 | 10 |
| Total | 1,000 | 835 | 165 | 1,000 | 50 |
Run the gross profit. On the flat buy, 835 units clear at 48 dollars (40,080 dollars) and 165 units clear at 8 dollars (1,320 dollars), for 41,400 dollars of gross profit. On the right curve, 950 units clear at 48 dollars (45,600 dollars) and 50 units at 8 dollars (400 dollars), for 46,000 dollars. Same 1,000-unit buy, same cost, same retail price.
The flat curve gives up about 4,600 dollars, roughly 11 percent less gross profit, purely to broken sizes and markdown drag. That gap is bigger than the entire operating margin on a typical apparel style. Scale it across a season of styles and the size curve is one of the largest controllable margin levers you have. And remember it lands on an already-thin line: a healthy brand is trying to hold contribution margin after variable marketing somewhere around 20 to 30 percent, and markdown drag eats straight into that.
How to set the size curve from sell-through data
The good news is the data to fix this is already in your sales reports. The discipline is in how you read it. Best practice across apparel planning is to build the curve from clean demand, not raw history.
- Use clean weeks only. Pull sell-through by size from weeks when every size was in stock and nothing was on markdown. Promotional and stocked-out weeks distort the picture and bias the curve toward whatever happened to be available.
- Adjust for stockouts. If M sold out in week two, its recorded units understate true demand. Estimate the lost sales and add them back, or you will keep under-buying your best sizes and recreating the broken run every season. Operators who plan this well will literally model the stockout date ("we will stock out July 24th") and back the lost demand into the next buy.
- Express each size as a share of total demand. That share, not your gut and not the manufacturer's standard pack, is your size curve. The buy quantity is then forecast times curve, set against MOQ and case-pack constraints with the vendor.
- Buy fringe sizes shallower than the curve suggests. The cost of a stockout on a fringe size is low; the cost of stranding it into markdown is high. Round the tail down on purpose.
- Recalculate every order cycle. Customer mix shifts, fit changes, and a curve that was right last year quietly drifts. Treat it as a living input, not a one-time setting.
- Watch the size mix weekly in-season. The moment the core sizes pull ahead, you have an early warning. Acting then, with a bundle or a small targeted promo, costs far less than an end-of-season clearance on a fully broken run. For the fringe that does strand, off-price channels exist precisely so you can offload stock that is not turning rather than fire-saling the whole brand.
One thing the finance seat cannot do alone: pull this lever. The size curve is a merchandising decision, and the most common version of the conversation we have with a founder carrying too much stock is them saying "from day one I'm like, we have too much inventory, I am not a merchandiser, so I do not know what to do other than keep telling them, can we please bring it down." The fix is to make the curve a shared, data-driven input that finance and merchandising own together, not a gut call buried in the buy.
Where the size curve connects to the rest of your P&L
Size-curve discipline does not live alone. It sits next to the two other apparel margin leaks we see most often. The first is returns, where a poor fit and the wrong size mix drive both the markdown and the true cost of returns on the same units. A customer who buys the only size left, finds it does not fit, and sends it back hands you the worst of both: a return cost on top of a unit that is now even harder to resell. The second is your overall markdown strategy, where the timing and depth of every cut decides how much of the broken-size tail you give back. Set the curve right and you start fewer markdown clocks in the first place.
All of this rolls up into inventory days, which is where the size curve quietly shows up on the balance sheet. Public comps carry anywhere from roughly 65 days (American Eagle, Urban Outfitters) to 147 days (Revolve), but a private 5 to 50 million dollar brand does not have the gross margins or scale to fund that carry. The efficient benchmark for brands your size is a 6 to 12 turn business, which is about 30 to 60 days of inventory, and broken, slow-moving fringe sizes are exactly what push days on hand the wrong way.
| Segment | Inventory turns per year | Implied inventory days |
|---|---|---|
| Fast fashion / value | 8 to 12 | ~30 to 46 |
| Mid-market apparel | 4 to 8 | ~46 to 91 |
| Premium / luxury / seasonal | 2 to 4 | ~90 to 180 |
| Retail apparel industry (Q1 2026 TTM) | 6.78 | ~54 |
The pattern we see again and again is a brand carrying way too much: one founder was sitting on roughly 250 days of inventory, which is super high, and pulling it back toward the 3 to 4 month range would free up real liquidity. That carry is rarely uniform. It is concentrated in the broken runs and the fringe sizes nobody re-cut the curve for. With apparel costs turning inflationary again (US apparel CPI swung from minus 0.1 percent YoY in September 2025 to plus 4.17 percent by April 2026 as tariffs bit), every avoidable markdown now compounds the squeeze.
All of this is the core of our work as a fractional CFO for apparel brands. The size curve is a small input with a large dollar tail, and it is one of the cleanest places to recover margin without touching your price or your sourcing.
Methodology
Operating margin and inventory days benchmarks are computed from FY2025 SEC 10-K filings pulled directly via SEC EDGAR for Lululemon (CIK 0001397187), Revolve (0001746618), Gap (0000039911), American Eagle (0000919012), and Urban Outfitters (0000912615). Operating margin = operating income / revenue. Inventory days = ending inventory / COGS x 365, computed from a single year-end balance, so they are directionally correct comps rather than audited days-inventory-outstanding figures (a true DIO uses average inventory). Gap inventory was not separately returned in the XBRL pull, so its inventory-days cell is blank.
The apparel CPI figure is FRED series CPIAPPSL (BLS CPI-U Apparel), which moved from minus 0.10 percent YoY in September 2025 to plus 4.17 percent in April 2026. Size-curve best practice reflects published apparel-planning guidance (Toolio, Retail Dogma, o9 Solutions, TakeOff) on building curves from clean, full-price, in-stock weeks, adjusting for stockout-driven lost sales, and recalculating each order cycle. The inventory-turn bands are from StyleMatrix and CSIMarket. The "up to 20 percent of profit from poor size visibility" and "55 to 80 percent item-level stock accuracy" figures are industry research (Badger Technologies citing BoF/McKinsey and RFID Journal), presented as context.
The 1,000-unit worked example, including unit splits, sell-through-by-size rates, the 50 percent markdown assumption, and the roughly 4,600 dollar (about 11 percent) gross-profit gap, is illustrative and built to show the mechanics of markdown drag. It is not a published statistic or a measurement of any one brand. Your own numbers will differ by category, price point, and season. Use it as a framework, then run it on your real sell-through.
Frequently Asked Questions
how do you set an apparel size curve from sell-through data?
Use sales by size from clean weeks only, when every size was in stock and nothing was on markdown, then express each size as a share of total units sold. Adjust for any stockouts so missing sizes are not undercounted, and recalculate the curve every order cycle because customer mix shifts over time.
why does a sold-out apparel sku still lose money?
Because sold out usually means your core sizes cleared at full price and your fringe sizes only cleared after markdowns. A SKU can hit 100 percent unit sell-through and still miss its margin if the last 30 to 40 percent of units went out at 50 percent off. Unit sell-through hides the price you actually got.
what are broken sizes in apparel inventory?
A broken size run is when the most-demanded sizes (often M and L) sell out while the fringe sizes are still on hand. The style looks healthy on a unit basis but you can no longer fully serve a customer, so you lose incremental full-price sales on the core and you are left holding the slow sizes.
should i buy fringe sizes (xs, xxl) to the same curve as my core sizes?
No. Buy the fringe shallower than even a sell-through-weighted curve suggests. The cost of stocking out a fringe size is small, but the cost of stranding it into a 50 percent markdown is large. Round the tail down on purpose.
how often should i recalculate my size curve?
Every order cycle. Customer mix, fit, and which sizes run hot all drift over a year, and a curve that was right last season quietly goes stale. Treat it as a living input, not a one-time setting you copy from the manufacturer's standard pack.
how many inventory days should a private apparel brand carry?
Target a 30 to 60 day band, not the 65 to 147 days public comps carry. Public apparel brands hold more because their gross margins and scale fund the carry. For a 5 to 50 million dollar brand, broken size runs and slow fringe sizes are usually what push days on hand the wrong way.
how do you reduce markdown drag on leftover odd sizes?
Buy fringe sizes shallower so you never strand them, weight the buy toward proven demand sizes, and watch the size mix weekly so you catch imbalance before clearance. Treat lingering odd sizes as a markdown-risk signal and clear them with bundles or targeted promos early, when the discount needed is smaller.