
Inventory
Managing Inventory Across Multiple Channels
Managing inventory across DTC, Amazon FBA, wholesale, and retail is an allocation problem, not a stockpile problem. Hold one real-time source of truth, reserve units against firm wholesale and retail commitments first, set channel-specific buffers, and rebalance weekly by margin-adjusted velocity.
Key Takeaways
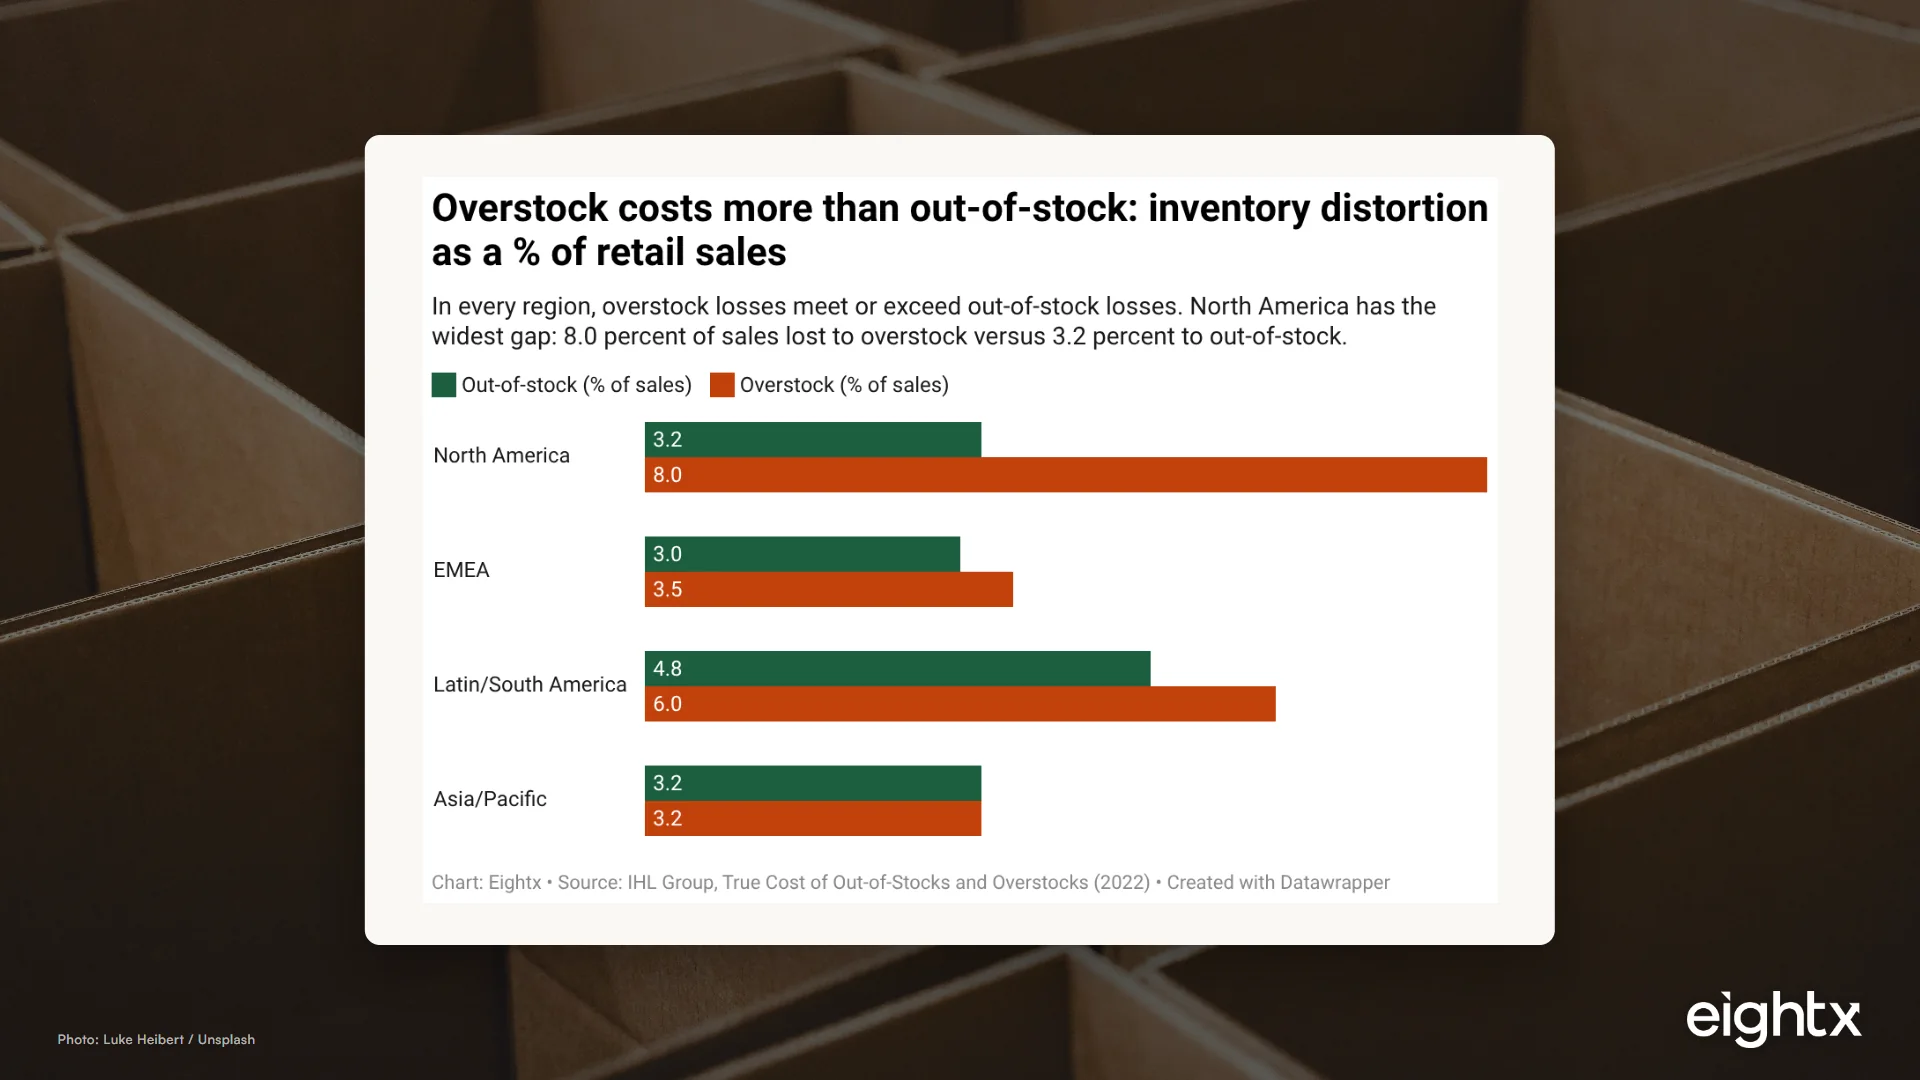
- Overstock costs more than stockouts. IHL Group puts North American out-of-stocks at 3.2 percent of sales and overstocks at 8.0 percent, yet operators only manage the loud half.
- Misallocation is two costs at once: lost margin from stockouts in the strong channel plus carrying cost on stranded units in the weak one. On a $20M brand both can run into six figures a year.
- Allocate against a priority hierarchy, not equally: firm wholesale POs and retail commitments first, then Amazon rank protection, then flexible DTC, then a safety buffer.
- You cannot allocate what you cannot see. One real-time available-to-promise number across every channel is the prerequisite, not a nice-to-have.
- Channel inventory days vary widely. Public DTC and CPG brands sit at a pooled median of 133 days, but apparel runs 145 and beauty CPG 170, so a blended target hides the problem.
If you sell on Shopify, Amazon, into wholesale accounts, and through retail doors, you do not have an inventory problem. You have an allocation problem. The total units in your system might be fine. The issue is that they are in the wrong place: a pallet committed to FBA while your DTC hero SKU goes out of stock, or a retail backroom full of a colorway that only moves on your own site. That is the quiet way multichannel brands bleed cash.
Single-channel brands get to think about inventory as one number. The moment you add a second and third channel, every unit has to be promised to exactly one place, and a wrong promise costs you twice: lost margin where you stocked out, and carrying cost where the units are stranded. This post is the CFO framework for allocating stock across DTC, Amazon FBA, wholesale, and retail so you stop paying both bills at once.
Why multichannel inventory is an allocation problem, not a storage problem
The instinct most operators bring from the single-channel days is to pool everything and let each channel pull from the pile. That works until two channels want the same unit at the same time. Then you are either overselling (and eating cancellations and Amazon defect rate) or you are hoarding a buffer so deep that your cash is permanently underwater.
It is worth saying out loud that this is hard for everyone. When I talk to founders running brands well past $50M, with dedicated accounting, supply-chain, and fulfillment teams, they still describe inventory as the hardest thing to get right, the part of the business no one feels they have fully solved. So if your channel reconciliation lives in a spreadsheet that never quite ties out, that is normal, not a sign you are behind.
The better mental model: every unit is committed, or it is available to promise (ATP). Firm wholesale POs and retail allocations are committed before they ever hit your sellable pool. What is left is ATP, and ATP is what you actually allocate across the channels that flex (DTC, Amazon). Get the ATP number wrong and you make every downstream allocation decision on bad data.
This is also why your accounting layer matters more than people expect. The most common failure we see is the double-count: stock booked from a file with three sections (an Amazon block, a 3PL sub-group, a Shopify block) where the numbers never reconcile, and a brand finds itself out by tens of thousands of units against what the system claims it should hold. The way your orders post (order-level versus settlement-summary journals) determines whether you can read true channel-level COGS and inventory movement at month-end. We unpack that tradeoff in our breakdown of Webgility vs A2X; the short version is that clean, channel-segmented data is the input to every allocation call you make.
The cash impact of getting allocation wrong
Misallocation does not show up as a single line on your P and L, which is exactly why it survives for years. It hides as two separate costs. The first is lost gross margin: when the channel with real demand stocks out, every unit of demand you cannot fill is contribution margin you will never recover, plus the wasted ad spend that drove that traffic. The second is carrying cost: the stranded units sit in the wrong channel at a holding cost of roughly 20 to 30 percent a year, before any markdown to clear them.
The counterintuitive part is which cost is bigger. IHL Group's study of retail inventory distortion put North American out-of-stocks at 3.2 percent of sales and overstocks at 8.0 percent, with global inventory distortion running roughly $1.235 trillion in 2022. The overstock side is more than twice the stockout side, yet operators only manage the loud half because stockouts scream (lost Amazon rank, angry retail buyers) while stranded stock is silent.
That silence is dangerous because it feels like progress. When we talk to founders about where their cash went, a common answer is that all the extra cash flow right now just goes into inventory, with a quiet worry that they might be over-buying. They are. The units are real, they are paid for, and they are sitting in the wrong channel earning nothing.
Here is what that looks like for an illustrative $20M brand. Each bar is one channel; the dark segment is margin lost to stockouts, the gray segment is the carrying cost of stranded stock in that channel.
The pattern is the point. Amazon and DTC tend to lose more to stockouts because demand there is fast and unforgiving. Wholesale and retail tend to accumulate stranded stock because you commit units to them in advance against forecasts that miss. Add the two columns and you are looking at roughly $670K of avoidable drag, most of it invisible because no single report ever sums it.
The allocation hierarchy: who gets units first
You cannot give every channel equal access to every unit. You need a priority order, and it should follow the economics of being wrong, not the size of the channel. Based on how the best multichannel operators run it, the order looks like this:
| Priority | What it covers | Why it ranks here |
|---|---|---|
| 1 | Firm wholesale POs | Missing a PO means penalties, chargebacks, and losing the account |
| 2 | Retail commitments | Store-level stockouts kill sell-through and shelf position |
| 3 | Amazon / FBA | Protects rank, Buy Box, and Prime availability |
| 4 | DTC sellable | Flexes with promotions and paid traffic; easiest to throttle |
| 5 | Safety buffer | Absorbs forecast error, lead-time shocks, and returns |
The logic: protect the commitments where being short is most expensive and least reversible first. Wholesale and retail are contractual or relationship-bound, so they sit at the top even though their per-unit margin is often lower. DTC sits lower not because it matters less but because it is the channel you can most easily dial up or down without breaking anything. The buffer comes last on purpose, so you are sizing safety stock against what is genuinely uncommitted.
One caution we keep returning to with founders: a big wholesale or trade-spend commitment is not automatically a win. The pattern we see again and again is a buyer who loads up on inventory against a promo, fails to sell it through, and leaves the brand with major whiplash in the pipeline. That is exactly why wholesale sits at the top of the priority list but still gets modeled as its own channel with its own sell-through assumptions, not pooled in with everything else.
Set channel-specific buffers and service levels
A single blended safety-stock target is a trap because channels do not behave the same way. Amazon punishes you hard and fast for stockouts (rank, Buy Box, suppressed listings), so it deserves a deeper buffer on velocity SKUs. As one operator put it, the only thing everyone knows about Amazon is do not run out of stock, but over-flood them with stock and they penalize you on storage and fees too. That two-sided pressure is why FBA gets a deeper buffer on hero SKUs and a rule like "never expose the last X units on the marketplace," not an open-ended pile.
Wholesale is lumpier and lead-time-driven, so the protection there is reserving against the PO calendar, not carrying extra. DTC can run leaner because you control the demand tap directly. A clean way to size all three is to A/B/C rank your SKUs by volume and margin: the C movers you might keep drop-shipping or hold almost nothing of, the B movers hold roughly eight weeks, and the A movers hold roughly twelve. Same logic, different cover by class.
Channel inventory days expose how different these are. Across 15 public DTC and CPG brands the pooled median sits at 133 days, but the spread is enormous, per our inventory days by DTC vertical benchmark from recent 10-K filings.
| Vertical / channel | Median inventory days | Typical fill-rate target |
|---|---|---|
| Food and beverage CPG | 114 | 95-98% |
| Pooled median (15 brands) | 133 | n/a |
| Apparel DTC | 145 | 95-98% |
| Beauty CPG | 170 | 96-99% |
| Amazon FBA (any vertical) | 45-60 days of cover | 97-99% on hero SKUs |
If your channels span verticals or behaviors, a blended days target will systematically over-stock the fast movers and under-stock the slow ones. Set the buffer per channel and per SKU class, and stop chasing a single number. If your team still under-orders against these targets, our note on how to improve inventory days covers the levers in order.
Rebalance on a cadence, measured by turnover and fill
Allocation is not a set-and-forget config. Demand moves between channels week to week, and the only way to catch stranded stock early is a standing weekly review of sell-through, days of cover, inbound receipts, aged stock, and channel-level stockouts. Then you shift units toward the channels with the best margin-adjusted velocity.
The metric that ties it together is inventory turnover. Turnover equals 365 divided by your days inventory outstanding, so a brand at 91 days of cover is turning 4.0x a year, as we lay out in what is inventory turnover. When we work with a brand carrying something like 250 days of inventory, the message is blunt: the inventory balance is very high and the cash conversion cycle is very long, and pulling that down toward three to four months of cover frees real liquidity. As a rough lever, each one-day reduction in inventory days frees on the order of $80K of working capital at $30M of revenue.
The mistake is optimizing turnover in isolation. Push it too high and you sacrifice Buy Box, organic rank, and DTC fill rate. The right target is the highest sustainable turnover that still holds 95 percent-plus fill across your priority channels. The most disciplined move we have seen an operator make was to stop chasing a lower unit cost and instead just bring the units on hand down, ordering biweekly and holding a very low balance on purpose. Building the forecast that feeds these reorder points is its own discipline; see demand forecasting without overordering for the method.
This whole allocation discipline sits inside the broader working-capital picture we cover in our pillar on ecommerce inventory management as a financial function.
What to do about it
- Build one available-to-promise number. Before anything else, get a single real-time inventory figure that every channel reads from, with firm wholesale and retail commitments netted out. If you are still reconciling channels in spreadsheets, fix that first.
- Write down your priority hierarchy. Put the five-tier order above in a document your ops team actually uses, and define exactly what "committed" means for wholesale and retail so units get reserved before they hit the sellable pool.
- Set buffers per channel, not blended. Give Amazon a deeper velocity buffer, reserve wholesale against the PO calendar, and let DTC run leaner. Tie each to a per-channel service-level target.
- Run a weekly allocation review. Pull days of cover, sell-through, aged stock, and stockouts by channel. Move units toward margin-adjusted demand and flag anything aging past its target.
- Price the drag once a quarter. Add up lost stockout margin plus stranded carrying cost. Putting a dollar figure on misallocation is what gets it onto the leadership agenda and keeps it there.
Related reading. For the strategy question that sits above the allocation rule, see which channel gets the inventory when you are short.
Sources and methodology
The out-of-stock and overstock figures come from IHL Group's True Cost of Out-of-Stocks and Overstocks (2022): North America out-of-stock at 3.2 percent of sales and overstock at 8.0 percent, with comparable regional splits for EMEA, Latin and South America, and Asia/Pacific, and global inventory distortion of roughly $1.235 trillion. These are retail-wide and from 2022, so treat them as directional magnitude rather than a DTC-specific 2026 number; they remain the strongest primary source on the relative size of the two costs.
Inventory carrying cost of 20 to 30 percent of average inventory value per year reflects practitioner consensus across inventory-cost analyses (Impact Analytics, Fishbowl Inventory). Fill-rate and service-level bands of 95 to 99 percent draw on GainSystems and Alexander Jarvis, with B2C retailers typically at 95 to 98 percent and top ecommerce performers at 97 to 99 percent.
Channel and vertical inventory-days figures are drawn from the Eightx inventory days by DTC vertical benchmark: days inventory outstanding from recent 10-K filings for 15 public DTC and CPG companies, pooled median 133 days, with apparel at 145, beauty CPG at 170, and food and beverage CPG at 114. Per-vertical medians rest on as few as two to four filers each, so treat them as directional anchors. DIO is calculated as average inventory divided by COGS times 365, and turnover is 365 divided by DIO.
The cost-of-misallocation chart is an illustrative model for a representative $20M multichannel brand, assuming roughly 14 percent stockout exposure on lost-margin units and a 25 percent annual holding cost on stranded stock. The figures are directional and should be replaced with your own channel data before you act on them. The working-capital lever (roughly $80K freed per one-day reduction in inventory days at $30M revenue) and the channel contribution-margin gaps come from the Eightx 2026 eCommerce KPI benchmark.
Amazon FBA magnitudes (a 15 to 25 percent loss of potential sales on chronically out-of-stock SKUs, a rank drop while out of stock that takes several weeks of velocity to recover, and 45 to 60 days of cover on hero SKUs) are practitioner estimates synthesized from seller-analytics sources, not Amazon-published aggregates; no official stranded-inventory percentage exists. The allocation hierarchy reflects best-practice patterns synthesized from multichannel inventory research and recurring themes in operator conversations.
Frequently Asked Questions
what is multichannel inventory management?
It is the discipline of allocating one pool of stock across multiple sales channels (DTC, Amazon FBA, wholesale, and retail) so each channel hits its service level without trapping cash in slow-moving units somewhere else. The core problem is allocation, not storage: deciding which units each channel can sell from a single real-time available-to-promise number.
how do i decide which channel gets inventory first?
Use a priority hierarchy rather than splitting stock evenly. Reserve units against firm wholesale purchase orders and retail commitments first because missing those carries penalties and lost accounts. Protect Amazon next to defend rank and Buy Box. Let DTC flex with promotions and traffic. Keep a safety buffer last to absorb forecast error and returns.
what is stranded stock and why does it hurt cash?
Stranded stock is inventory sitting in the wrong channel: units committed to FBA or a retail backroom that the demand has moved away from. It hurts cash because you have already paid for the goods, you are paying to carry them at roughly 20 to 30 percent a year, and you often cannot redeploy them quickly to the channel that is actually stocking out.
why does overstock cost more than running out of stock?
Out-of-stocks are loud and visible, so operators chase them. Overstock is silent: it just sits and carries. IHL Group found North American overstocks cost 8.0 percent of sales versus 3.2 percent for out-of-stocks, so the stranded side of the ledger is more than twice the stockout side even though nobody feels it day to day.
how much does poor inventory allocation cost?
It is two costs at once: the gross margin you lose when a strong channel stocks out, plus the carrying cost on stranded units in a weak channel. In our illustrative $20M model the combined drag runs around $670K a year. The exact number depends on your margins, holding cost, and how far apart your channel demand curves are.
what is available to promise (ATP) and why do i need it?
Available to promise is your on-hand and inbound stock minus everything already committed to firm wholesale POs and retail allocations. It is the only number you should let your flexible channels sell against. Without one shared ATP figure you either oversell the same unit on two channels or hoard a buffer so deep your cash goes underwater.
what systems do i need to manage inventory across channels?
At minimum, one inventory source of truth that exposes a real-time available-to-promise number to every channel, plus channel-aware reservation rules so you do not double-sell the same unit. As volume grows you layer in an inventory management system (Cin7, Katana, Finale) and clean accounting data. How your accounting posts orders, order-level versus settlement-summary, shapes how readable that data is.
how often should i rebalance inventory between channels?
Weekly for most brands. Review sell-through, days of cover, inbound receipts, aged stock, and channel-level stockouts, then shift units toward the channels with the best margin-adjusted demand. Monthly is too slow during peak or a product launch; daily is overkill unless you are running very high velocity SKUs with short lead times.