
Inventory
How to Benchmark and Improve Your Inventory Days in 2026
Good inventory days are vertical-specific: eyewear runs 40, food and beverage 114, apparel 145, beauty 170. Calculate yours as average inventory divided by COGS times 365, compare to your category, then cut days by turning faster, tightening buys, and clearing dead stock. At a $20M brand, every 30 days cut frees about $1M.
Key Takeaways
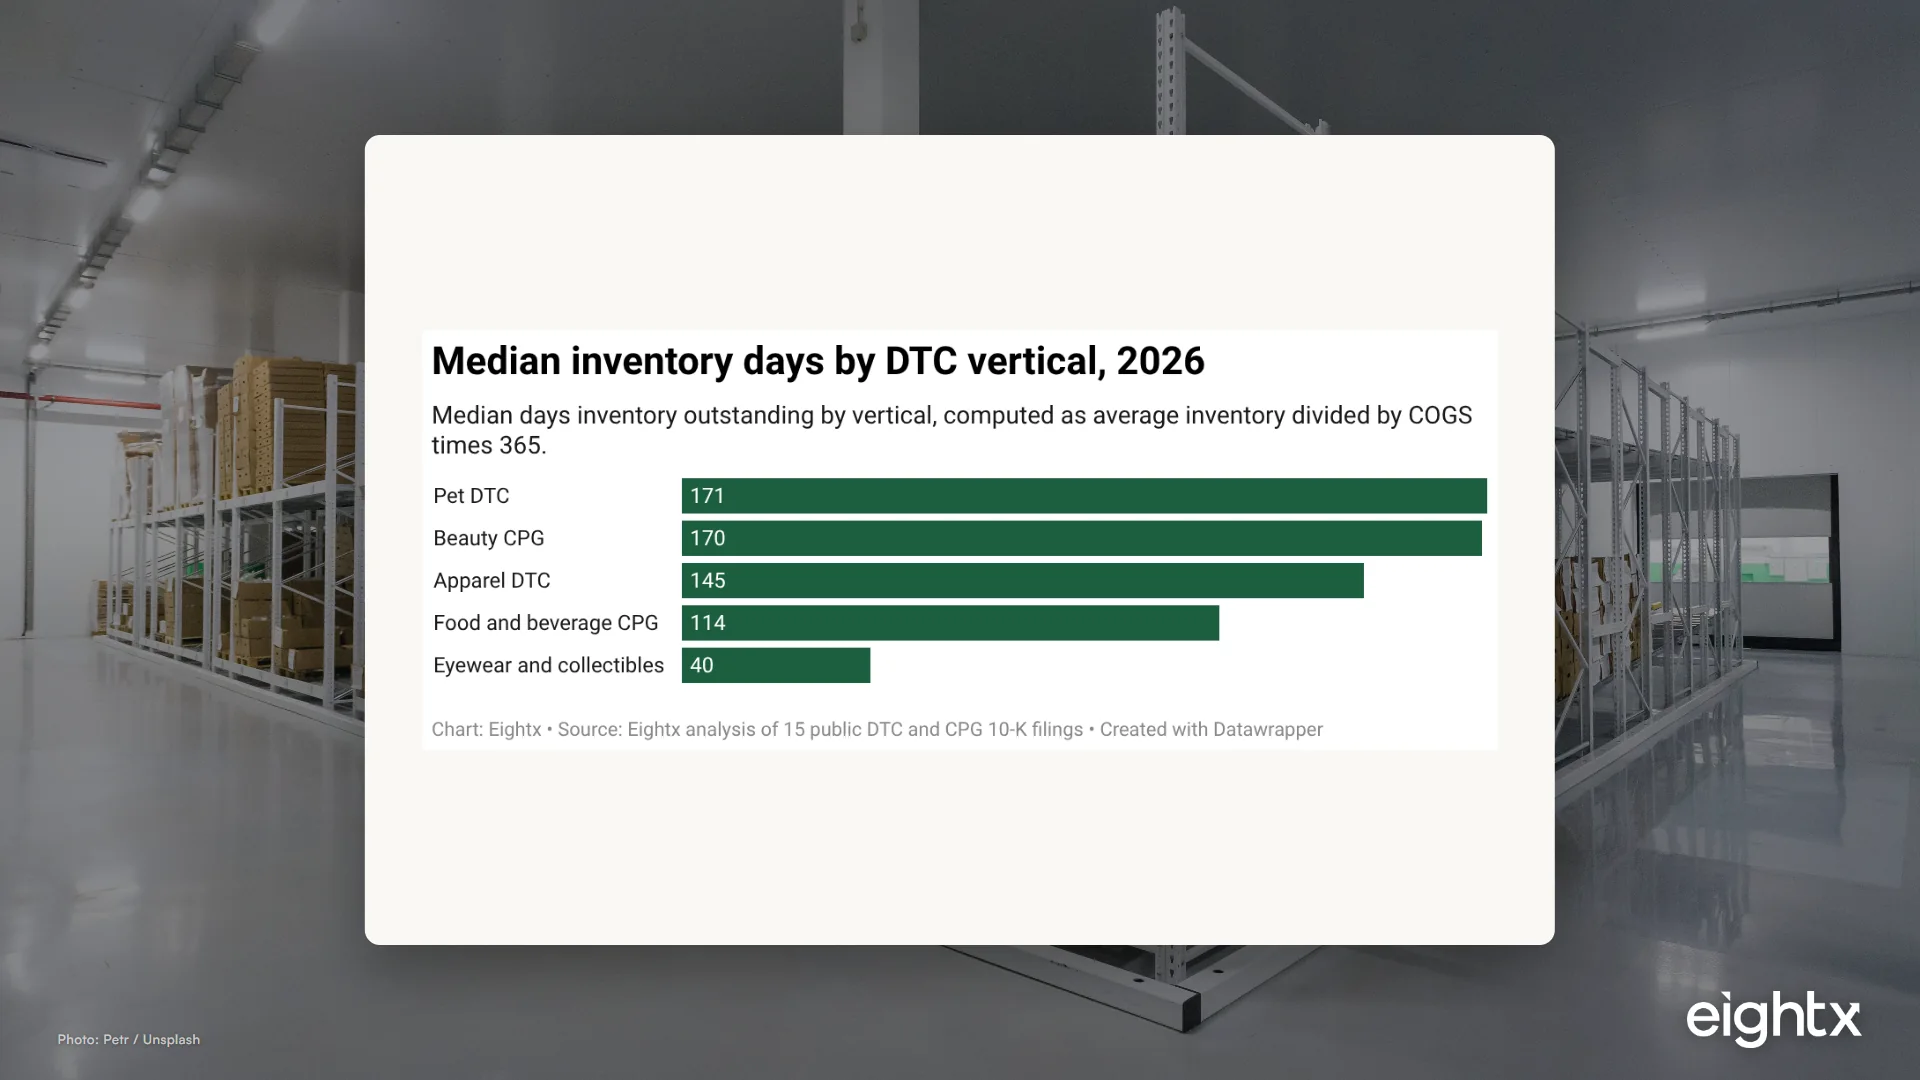
- There is no single benchmark. Median inventory days run 40 for eyewear and collectibles, 114 for food and beverage, 145 for apparel, 170 for beauty, and 171 for pet, so compare only against your vertical.
- Inventory days equals average inventory divided by COGS times 365. A brand with $2M average inventory and $8M COGS sits at 91 days.
- At a $20M brand, every 30 days of inventory you cut frees roughly $1M of cash, about $24,700 per day at 45% COGS.
- Three levers bring days down: turn faster with SKU discipline, tighten buys with smaller and more frequent POs, and clear dead stock even at 50 cents on the dollar.
- The $5M to $20M stage is the danger zone, where SKU sprawl pushes days to 120 to 240 and most preventable cash crises start.
Your accountant tells you inventory is an asset. Your bank balance tells you it is a hole in the floor. Both are right. Inventory is the single largest cash sink in a DTC or CPG brand, and the number that tells you how deep the hole is goes by an unglamorous name: inventory days. It measures how long your cash sits as product on a shelf before it sells. The longer the number, the more of your cash is stranded.
The good news is that inventory days is benchmarkable, calculable, and movable. This post shows what good looks like by vertical, how to calculate yours in two minutes, and the three levers that bring the number down, with the cash you free for every single day you cut.
What good inventory days look like by vertical
There is no such thing as an industry average for inventory days. There are verticals, and the spread between them is enormous. Across 15 public DTC and CPG brands, the pooled median is 133 days, but that number is a sanity check, never a target. That cohort spans beauty, apparel, food and beverage, eyewear, and pet, with no single vertical making up the majority, so the pooled figure says more about which brands file public 10-Ks than about any brand you run. The vertical you operate in sets your benchmark.
The structural logic is straightforward. Eyewear and collectibles run lean at 40 days because their SKU sets are narrow and replenishable. Food and beverage sits at 114 days because perishability forces discipline at the low end while global expansion stretches it at the high end. Apparel runs 145 because of seasonal pre-buys, returns, and size and color matrices. Beauty runs the longest at 170 because a single line can spin out 40 to 50 SKUs, supply chains are long, and high gross margins (often above 70%) make brands willing to fund the extra buffer rather than risk a stockout. Pet DTC sits highest at 171, where subscription boxes and a broad accessory range stack more SKUs on top of replenishment cover. None of these are management quality signals. They are the physics of the category.
| Vertical | Median inventory days | Why this number |
|---|---|---|
| Eyewear and collectibles | 40 | Narrow, replenishable SKU sets |
| Food and beverage CPG | 114 | Perishability sets the floor, growth bets the ceiling |
| Apparel DTC | 145 | Seasonal buys, returns, size and color matrices |
| Beauty CPG | 170 | SKU complexity, long supply chains, 70%-plus margins |
| Pet DTC | 171 | Subscription boxes plus broad accessory range |
A second lens is inventory turns, which is just the same metric flipped: turns equals 365 divided by inventory days. By that measure, supplements should run 8 to 12 turns and food and beverage 12 to 15, while apparel and home goods sit at the slow end at 3 to 7. Whichever way you express it, compare against your category and your revenue stage, and remember a simple ceiling: holding more than roughly twice your supplier lead time is a structural cash leak disguised as caution.
How to calculate your inventory days
The formula is the same one public-company analysts use, and you can run it in two minutes.
Inventory days (DIO) = (Average Inventory / COGS) x 365
Average inventory is usually the average of your beginning and ending inventory balance for the period. COGS is annual cost of goods sold, not revenue. A brand with $2M of average inventory and $8M of COGS sits at ($2M / $8M) x 365 = 91 days. The same formula applies across every vertical. What changes is the healthy benchmark you compare it against.
Two cautions before you act on the number. First, use COGS, not revenue, in the denominator. Plugging in revenue understates your days and hides the problem. Second, pull a true average inventory, because a single snapshot taken right after a big PO landed will read artificially high, and one taken right before a reorder will read artificially low.
What every day of inventory is worth in cash
This is the part that makes the abstract concrete. The dollar value tied up in inventory is (DSI x COGS) / 365, which means every single day of inventory equals one day of COGS sitting on a shelf. Cut a day, free a day of COGS. Cut thirty, free a month of it.
The math scales hard with revenue. Cutting a $10M brand at 50% gross margin from 180 to 90 DSI frees $1,232,876 of working capital, none of which shows up on the P&L and all of which shows up in the bank. Here is the same exercise across revenue bands.
| Revenue | Gross margin | 180 DSI inventory | 90 DSI inventory | Cash freed |
|---|---|---|---|---|
| $5M | 55% | $1.11M | $0.55M | $555K |
| $10M | 50% | $2.47M | $1.23M | $1.23M |
| $25M | 45% | $6.78M | $3.39M | $3.39M |
| $50M | 40% | $14.79M | $7.40M | $7.40M |
The per-day figure is the one to anchor on. At a $20M brand running 45% COGS, COGS is $9M, or about $24,700 a day. So every day of inventory you cut frees roughly $24,700, and every 30 days frees about $1M. For most brands in the $5M to $50M range, halving inventory days frees somewhere between $500K and $7M, an order of magnitude more than most operational efficiency projects ever return.
When I talk to founders running a brand this size, the thing that finally lands is not the days number, it is the dollar number. One operator sitting on 210 days at a $20M run rate did the math live on the call and realized they had roughly $5.2M of cash parked as stock, more than their entire ad budget for the year. The days had been on a dashboard for months and nobody acted. The dollar figure moved the next PO within a week.
The three levers that bring inventory days down
You move inventory days with three levers, in roughly this order of speed.
Lever one: turn faster. This is the biggest pool because inventory is your largest balance. Reorder by velocity rather than on a calendar, cut the slow tail of SKUs, and tighten safety stock with better forecasting. The bottom 20% of SKUs often drive under 5% of revenue while consuming 25% to 30% of safety stock, so SKU rationalization is the single highest-return move most brands have. Tier your reorder cadence by velocity so hero SKUs get watched weekly and the tail gets bought rarely.
Lever two: tighten your buys. Most elevated inventory days trace back to the PO. Tier discounts make the per-unit cost look great, so brands over-order and end up funding a forecasting mistake. Negotiate smaller, more frequent POs even if per-unit cost rises 5% to 10%, because the working capital you free is worth more than the unit savings. Holding more than twice your lead time is the tell that your buys are too big.
Lever three: fix dead stock. Slow-movers do not fix themselves. Build markdown triggers into every launch so product that has not moved in 90 days gets cleared. The way we put it to operators is simple: if you have inventory that is not moving, you have a bag of money on a shelf you cannot access. Even selling it at 50 cents on the dollar takes the bag off the shelf and puts cash to work. Clearing dead stock is the fastest lever because it frees cash immediately and removes the obsolescence risk sitting on your balance sheet.
If you want a structured target to buy into rather than just a number to cut toward, our guide to ideal inventory investment frames how much stock the business should actually hold, and our guide to forecasting demand without over-ordering turns the lever-one work into a repeatable system.
Where this goes wrong: the danger zone
The trend data shows how fast inventory days can run away from you. The pooled median across public DTC and CPG brands climbed from 75 days in FY2020 through 158 in FY2021 to 178 at the FY2022 peak during the bullwhip, then corrected back toward 131 by 2026. The brands that recovered fastest cut SKUs hard and moved to rolling reorders. The stragglers kept buying against an optimistic forecast.
At the individual brand level, the danger zone is the $5M to $20M stage. You have outgrown founder-led reordering but have not yet hired a demand planner. SKU count has tripled in 18 months. You bought tier discounts because the per-unit math looked great. The result is 200 days of inventory, a third of it slow-moving, while you stock out on hero SKUs because planning lives in scattered spreadsheets. Most preventable cash crises start exactly here. The pattern we see again and again at this stage is a founder who is convinced they have a sales problem when what they actually have is a cash-trapped-in-stock problem: revenue is fine, but every dollar of growth gets eaten by the next over-sized buy before it ever reaches the bank.
What to do about it
- Calculate your real inventory days this week. Pull average inventory and annual COGS, run (Average Inventory / COGS) x 365, and write the number down. You cannot improve what you have not measured.
- Benchmark against your vertical, not the average. Find your category median in the chart above, then compare yourself to the public peer closest to your model and revenue stage.
- Put a dollar figure on the gap. Multiply the days you are above benchmark by your daily COGS. That is the cash you are leaving on the shelf. Anchor the team on roughly $24,700 per day at $20M.
- Clear dead stock now. Mark down anything that has not moved in 90 days. Take 50 cents on the dollar rather than zero cents forever.
- Shrink the next PO. Move from one big seasonal buy to smaller, more frequent orders, and cap cover at roughly twice your lead time.
- Cut the slow tail. Rank SKUs by cash tied up versus contribution and kill the bottom decile. Then build weekly velocity review so the days stay down.
Inventory days is the most under-managed lever in DTC because it sits on the balance sheet, not the P&L, so it never shows up in the dashboards founders watch daily. But it is where the cash is. For the full picture of how inventory connects to your cash position, start with our guide to freeing trapped working capital.
Methodology
Vertical medians (eyewear and collectibles 40, food and beverage 114, apparel 145, beauty 170, pet 171, pooled 133 days) come from Eightx's analysis of 15 public DTC and CPG 10-K filings drawn from SEC EDGAR, with DIO computed as average inventory divided by COGS times 365. The cohort spans beauty, apparel, food and beverage, eyewear and collectibles, and pet, with no single vertical making up the majority; the pooled median is a blended sanity check, not a target, and per-vertical medians rest on as few as two to four filers each, so treat them as directional. Three caveats apply. First, public 10-K filers tend to be larger and more mature than the private $5M to $50M brands this post is written for, so a private brand at the same revenue stage may reasonably run leaner or heavier than its public peer. Second, fiscal years are not aligned across filers, so the trend series stacks each brand's own fiscal year rather than a strict calendar year. Third, the FY2026 figure of near 131 is an estimate-to-date: most filers have not closed FY2026 as of publication, so it reflects the most recent reported and interim balances, not final full-year audited numbers.
The 2020 to 2026 trend figures (75 days in FY2020, 158 in FY2021, 178 at the FY2022 peak, near 131 by FY2026, and about $1M per 30 days at a $20M brand) come from the same filing set. The cash math (average inventory equals DSI times COGS divided by 365, and the $1,232,876 freed cutting a $10M brand from 180 to 90 DSI) is reproducible from the stated formula and is detailed in our freeing trapped working capital analysis, alongside the turns benchmarks. The per-day figure of about $24,700 assumes a $20M brand at 45% COGS, or $9M of COGS divided by 365. All figures are benchmarks. Model your own balances before acting.
Frequently Asked Questions
how do I calculate my inventory days?
Inventory days, also called days inventory outstanding or DIO, equals average inventory divided by COGS times 365. Average inventory is usually the average of your beginning and ending balance for the period, and COGS is your annual cost of goods sold. For example, $2M average inventory and $8M COGS gives ($2M divided by $8M) times 365, which is 91 days.
what is a good number of inventory days for a DTC brand?
It depends entirely on your vertical. Median inventory days run about 40 for eyewear and collectibles, 114 for food and beverage, 145 for apparel, and 170 for beauty. Compare only against your category and your revenue stage, not against a single industry average. A useful ceiling is roughly twice your supplier lead time.
how much cash does cutting inventory days actually free?
Average inventory dollars equal DSI times COGS divided by 365, so every day you cut frees one day of COGS. At a $20M brand running 45% COGS, that is about $24,700 per day, or roughly $1M for every 30 days. Cutting a $10M brand from 180 to 90 DSI frees about $1.23M of working capital.
what are the fastest ways to reduce inventory days?
Clear dead stock first, because it frees cash immediately even at a markdown. Then reorder by velocity with smaller and more frequent POs so you stop pre-buying months of cover. Then prune the slow tail of SKUs that ties up safety stock without earning it. Forecasting discipline holds the gains.
why are my inventory days higher than the benchmark?
The most common causes are SKU sprawl, tier-discount over-buying on large POs, and safety stock set far above your lead time. The $5M to $20M stage is where this peaks because SKU count outgrows founder-led reordering before a demand planner is in place. Compare your days to twice your lead time to spot the gap.
should I use inventory days or inventory turns?
They are the same metric expressed two ways. Turns equals 365 divided by inventory days, so 90 days is about 4 turns and 45 days is about 8 turns. Days are easier to compare against lead time and to convert into cash, which is why CFOs tend to manage in days.