
eCommerce
Canada e-commerce share of retail 2026: StatCan says 5.7%, forecasters say 12%. Use the right one.
Canada's retail e-commerce share was 5.7% of total retail in November 2025 (Statistics Canada), or C$4.0B online out of C$70.4B. Forecasters like eMarketer cite 12-13%, but that uses a wider denominator including marketplaces, travel and digital goods. The two are not comparable. Here is which figure to use, and when.
Key Takeaways
- Canada retail e-commerce share is 5.7% of total retail in November 2025 (Statistics Canada, The Daily, 2026-01-23). That is $4.0B online out of $70.4B in total retail trade, seasonally adjusted.
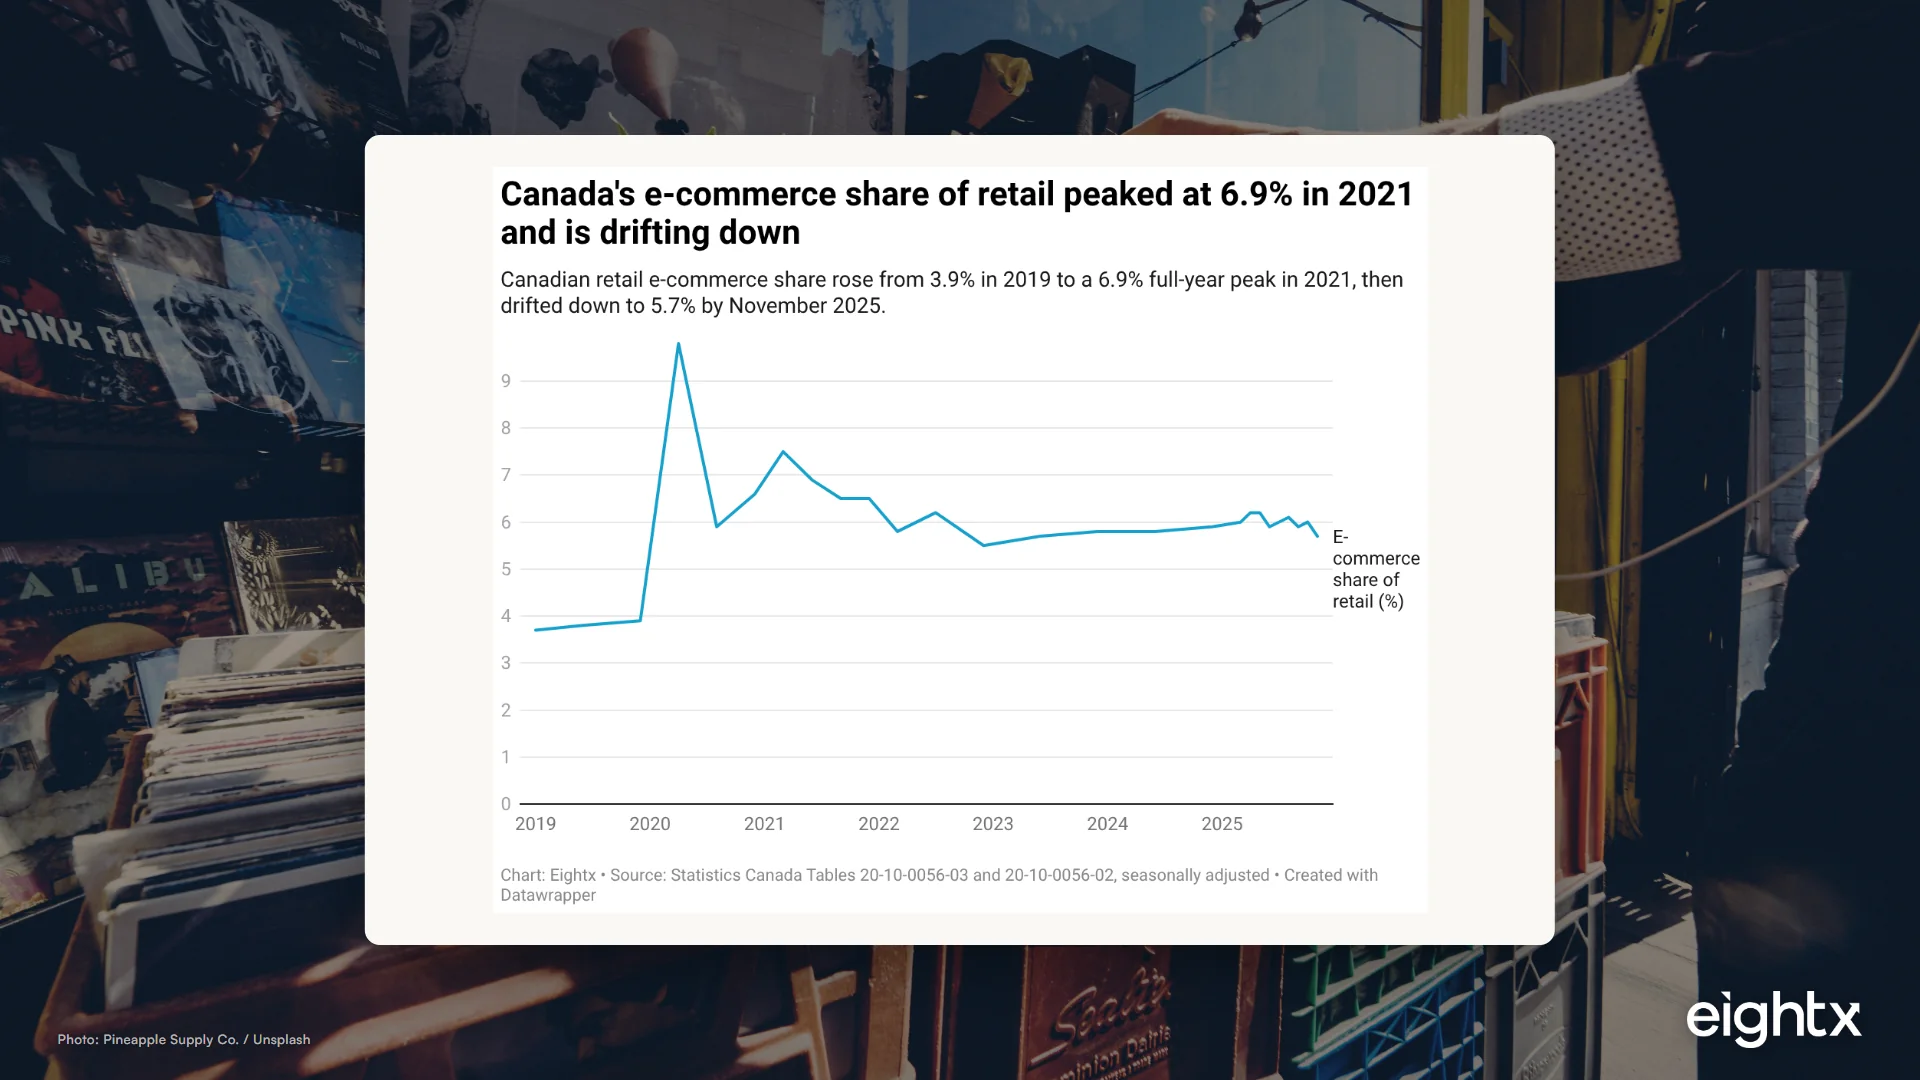
- The pandemic peak reading was 6.9% inside 2021, not 2020. That 6.9% is the StatCan 11-621-M peak monthly share for 2021; the full-year 2021 rollup was 6.5%. Online share has now drifted about 1.2 percentage points off the peak reading. Pre-pandemic 2019 share was 3.9%.
- The eMarketer 12-13% Canada e-commerce share is a different denominator, not a bigger market. Forecasters fold in marketplaces, travel, digital goods, and ticketing. StatCan's retailer survey (NAICS 44-45) does not.
- Subsector dispersion is 30 points wide. Electronics stores transact 31.9% online; clothing 19%; health & personal care 5.5%; grocery and gas barely register. The national average hides the only number that matters to you.
- If you are modelling Canada TAM off the 12% number, you are double-counting marketplace 3P GMV, travel, and digital subscriptions. Use StatCan for retail TAM math; use eMarketer only for total-digital-spend questions.
If you are planning a Canadian DTC launch or sizing your 2026 cross-border budget, the headline number you need to use is 5.7% of Canadian retail trade is online (Statistics Canada, November 2025 release). Not the 12% you keep seeing in slide decks. The gap between those two numbers is the single most-misused assumption in Canadian DTC market sizing right now, and getting it wrong by 6 percentage points will over-allocate budget to a market that is, by the official retailer survey, materially smaller than US e-commerce penetration.
This page is a living index. We refresh it when StatCan releases new Daily Retail trade articles, which happen monthly with about a seven-week lag.
What the latest StatCan release actually says
The most recent detailed StatCan Daily release covering retail e-commerce, dated January 23, 2026, showed Canadian retail trade at $70.4 billion seasonally adjusted in November 2025, with e-commerce sales at $4.0 billion. That is a 5.7% share, the lowest monthly reading since June 2025.
For context: pre-pandemic 2019 share was 3.9%. The 2021 peak monthly reading was 6.9% (StatCan analytical article 11-621-M, Table A.1); the full-year 2021 annual rollup was lower, at 6.5% (StatCan Canada at a Glance 2023). We use the 6.9% peak-reading number as the "pandemic peak" comparison anchor throughout this page, and we flag the annual rollup where it matters in the methodology section. The current 5.7% sits about 1.2 percentage points off the 2021 peak reading and about 1.8 points above the pre-pandemic 2019 base.
The 2025 monthly series has stayed in a tight band:
| Month | Total retail (SA, $B) | E-commerce sales (SA, $B) | E-commerce share | Prior month share |
|---|---|---|---|---|
| 2025-Apr | 70.1 | 4.4 | 6.2% | 6.0% (Mar) |
| 2025-May | 69.2 | 4.3 | 6.2% | 6.2% (Apr) |
| 2025-Jun | 70.2 | 4.2 | 5.9% | 6.1% (May) |
| 2025-Aug | ~70.0 | ~4.3 | 6.1% | n/a |
| 2025-Sep | 69.8 | 4.1 | 5.9% | 6.1% (Aug) |
| 2025-Oct | ~70.0 | ~4.2 | 6.0% | 5.9% (Sep) |
| 2025-Nov | 70.4 | 4.0 | 5.7% | 6.0% (Oct) |
There is no clear upward trend in the 2025 monthly series. Share is flat to down year over year. If you saw a 2024 plan that assumed online share would tick up to 7% or 8% in 2026, the data has not cooperated.
The two ways to count Canadian e-commerce, and which one your model should use
This is the part that breaks most decks. You can get to a Canadian e-commerce share number in two completely different ways, and the answers come out roughly 6 percentage points apart.
StatCan retailer survey (the 5.7% number). Statistics Canada surveys businesses classified under NAICS 44-45 retail trade. It counts sales those retailers report as having been transacted online. Amazon Canada's 1P sales as a registered retailer are captured here; what is not fully captured is marketplace 3P GMV from pure-play marketplaces not classified as retail trade, digital goods, subscriptions, travel, and services. The denominator is Canadian retail trade.
eMarketer and similar forecaster surveys (the 12% to 13% number). These count broader Canadian consumer digital commerce. The numerator includes marketplace 3P GMV, travel, digital subscriptions, and ticketing on top of retailer-survey volume. The denominator is consumer spending more broadly. Both numbers are correct for what they actually measure. They are not measuring the same thing.
The decision tree for an operator is straightforward. If the question is "what share of Canadian retail can my Shopify brand realistically address," use StatCan. If the question is "how much do Canadians spend online in total across everything digital," use the eMarketer number. Almost every TAM model we see for Canada is asking the first question and pulling the second number. That is the error.
The practical implication is large. If you model a $50M revenue ceiling off a 12% share, then learn the StatCan-comparable number is closer to 6%, you have just halved your real Canadian TAM. Better to know that before you over-hire the country manager.
Where the online share is actually hiding: subsector concentration
The 5.7% national average is misleading on its own because retail subsector e-commerce penetration in Canada is dispersed by 30 percentage points.
One caveat before the numbers. The subsector breakdown below is 2022 year-to-date (January through July 2022), which is the most recent public StatCan subsector refresh as of publish. The rank order (electronics on top, clothing and sporting goods next, grocery and gas at the bottom) has been stable across every prior release we have, so treat the order as durable. Treat the exact percentages as a floor, not a current reading. If your 2026 plan depends on the precise subsector number, supplement with your own category panel data.
Electronics and appliance stores transact 31.9% of their sales online (StatCan's latest subsector breakdown, 2022 year-to-date). Clothing and accessories run 19.0%. Sporting goods, hobby, book, and music are 18.7%. Furniture is 13.0%. Health and personal care is 5.5%. Grocery stores, gas stations, and motor vehicle dealers are barely measurable.
Two operator takeaways. First, the 5.7% national number is the wrong benchmark for your specific category. If you sell apparel, you are operating in a 19% online category, not a 5.7% one. If you sell electronics accessories, the relevant ceiling is 32%, not 5.7%. Pull the subsector number for your own modelling, and pair it with your subsector's average AOV by e-commerce vertical to get a defensible TAM range.
Second, the categories that drove the pandemic peak have already given back most of the gains. Electronics peaked at 35.9% in 2021 and is now 31.9%. Clothing peaked at 23.1% and is now 19.0%. The decline is not uniform; sporting goods only fell from 20.9% to 18.7%. But the structural reset is real in the discretionary categories that are most over-indexed online.
The StatCan subsector table here is dated (2022 year-to-date is the most recent public refresh). We will update Chart 2 and the table below if StatCan publishes a 2024 or 2025 subsector breakdown.
| Subsector (NAICS) | 2019 | 2021 peak | 2022 YTD |
|---|---|---|---|
| Electronics & appliance (443) | 26.0% | 35.9% | 31.9% |
| Clothing & accessories (448) | 10.7% | 23.1% | 19.0% |
| Sporting goods, hobby, book & music (451) | 11.1% | 20.9% | 18.7% |
| Furniture & home furnishings (442) | 6.1% | 15.4% | 13.0% |
| Health & personal care (446) | 5.0% | 6.2% | 5.5% |
Canada vs US vs UK, and why the gap matters for cross-border DTC
On the closest retailer-survey bases available, Canada trails both the US and the UK on online penetration by a wide margin. (For the four-country picture across the US, UK, EU, AU, and Canada on a single chart, see our e-commerce penetration by country comparison. For the equivalent Australian data, see Australian online retail share 2026.)
The US Census MRTS e-commerce share sat at roughly 16% at the end of 2025. The UK ONS internet sales share has been holding around 26%. Canada at 5.7% is somewhere between one-third and one-quarter of the UK level. Methodologies are not identical (the UK definition is broader), but the spread is real enough that it shows up in operator-level behaviour: Canadian shoppers buy in-store more often, return to brick-and-mortar at higher rates, and resist online grocery at a structural level.
The cross-border implication for a US-based DTC brand is twofold. First, do not assume "Canada equals small US" when you model the market. A US brand at $50M with 15% revenue from Canada is not unusual; that mix reflects cross-border purchase appetite from Canadian consumers buying directly from US sites, not a domestic Canadian e-commerce market that is similar in shape to the US.
Second, for US brands selling into Canada, the friction is mostly Canada Post timelines and duty disclosure rather than duty rates that materially break unit economics. Canada is a reasonable expansion market for an established US brand. It is rarely a primary launch market for one.
What this means for your business in 2026
Three operating decisions land out of this data.
Right-size your Canada TAM off StatCan, not off forecasters. If your 2026 plan has a Canada line item, the e-commerce TAM you should be modelling is your subsector's StatCan share times Canadian retail spend in that subsector, not 12% of total Canadian consumer spending. The two numbers can be 2x apart at the line-item level. If your plan was built off the larger number, expect actuals to disappoint, and rebuild the model now.
Recognize subsector ceilings before you commit budget. If you are in CPG with grocery exposure, you are fighting category gravity. Canadian grocery is not going online at the rate US grocery did, and the StatCan series confirms that. Bake the lower ceiling into your channel mix assumptions. If you are in apparel, electronics, or specialty hobby, the 19% to 32% subsector ranges give you a much more honest backdrop for your share-of-category assumption.
Treat Canada as a second market, not a first market. For most US-based DTC brands at $10M to $150M GMV, the right framing for 2026 is that Canada is incremental cross-border revenue, not a standalone country plan that justifies country-manager hires, local fulfillment, or dedicated brand investment. Use US-side fulfillment with Canada Post or USPS depending on duty environment, run Canada-targeted paid social only when CAC math holds at lower expected AOV, and reassess in 2027 when the e-commerce share trajectory becomes clearer.
The 5.7% number does not mean Canada is a bad market. It means Canada is a smaller, slower-moving, more brick-and-mortar-anchored e-commerce market than you would conclude from the forecasts. Plan to that reality, and your CAC math, channel mix, and headcount decisions will land closer to reality.
Sources and methodology
The headline number comes from Statistics Canada's monthly Retail trade survey, which is published in The Daily. We use Table 20-10-0056-03 for monthly retail trade e-commerce sales and Table 20-10-0056-02 for the corresponding total retail denominator. Both tables replaced the older 20-10-0072-01 and 20-10-0008-01 tables in StatCan's March 2023 restructuring. If you see a methodology citing the old table IDs, it has not been refreshed.
StatCan's retail e-commerce series captures sales reported by Canadian retailers classified under NAICS 44-45 (retail trade). It excludes pure-play marketplaces not classified as retail trade, digital goods and subscriptions, travel services, and ticketing. This is the reason third-party forecasts (eMarketer, ReportLinker, others) reporting Canadian e-commerce share at 11.7% to 13.0% for 2025-2026 are not directly comparable to the StatCan number. Different denominator, different scope. Both are legitimate for the questions they answer; they are not interchangeable.
The annual figures cited in the table above (2020 through 2022) are pulled from StatCan's Canada at a Glance 2023, Section 16 (Economy). The 2022 annual share (5.5%) differs slightly from the 2022 year-to-date figure (6.2%) used in the subsector table. This reflects a known StatCan reporting quirk: the annual rollup and the monthly Daily series use slightly different consolidation methodologies. Both numbers are legitimate; we use the monthly series for trend analysis and the annual rollup for full-year totals.
The subsector breakdown comes from StatCan's analytical catalogue 11-621-M, "Retail e-commerce and COVID-19: How online sales evolved as in-store sales fell," Table A.1. The 2022 figure covers January through July only. This is the most recent publicly available subsector breakdown. If StatCan publishes a 2024 or 2025 refresh, we will swap Chart 2 and the subsector table accordingly.
For Chart 3, the US comparison uses the US Census Bureau's Quarterly Retail E-Commerce Sales report, which is conceptually similar to the StatCan approach (retailer survey, NAICS-coded). The UK comparison uses ONS Internet Sales as a Percentage of Retail Sales, which uses a slightly broader internet-sales definition. The 2025 row is a calibration estimate from year-to-date data; we will refresh once full-year 2025 numbers post.
Update cadence. This page is refreshed monthly as StatCan releases new Daily Retail trade articles (typically about seven weeks after the reference month). The next refresh adds one row to the monthly table, updates the headline number, and bumps the schema date. Subsector data and cross-country data refresh on the original source's cadence (annual or irregular).
For more on how Canadian operating math interacts with the cross-border decision, see our pieces on the average e-commerce return rate, the average e-commerce CAC by vertical, and the cross-border Shopify tech stack across US, UK, and AU. If you are sizing a CFO bench against the Canada plan, see our fractional CFO services hub.
Frequently asked questions
what percent of canadian retail sales are online in 2026?
The official StatCan number is 5.7% as of November 2025 (the latest detailed release at the time of writing, dated January 23, 2026). E-commerce sales were $4.0 billion seasonally adjusted; total retail trade was $70.4 billion. The monthly share has stayed in a 5.7% to 6.3% band through 2025.
why is statcan's ecommerce share so much lower than emarketer's number?
Different denominator. StatCan only counts sales reported by Canadian retailers in the NAICS 44-45 retail trade survey (which includes Amazon Canada's 1P retail sales but not its full 3P marketplace volume). eMarketer and ReportLinker fold in marketplace 3P GMV, travel, digital subscriptions, and ticketing. Both numbers are correct for what they measure. Use StatCan for retail-TAM math; use eMarketer only when the question is total Canadian consumer digital spend.
how does canada's online retail share compare to the us and uk?
On the closest retailer-survey basis, the US Census MRTS shows e-commerce around 16% of US retail at the end of 2025, the UK ONS shows it at roughly 26%, and StatCan shows Canada at 5.7%. Definitions are not perfectly identical, but Canada is structurally behind both. UK consumers are roughly 4 to 5 times more online-native than Canadians on official stats.
did canada's ecommerce share actually peak in 2020 or 2021?
Both. The peak monthly reading was inside 2021 at 6.9% (StatCan analytical article 11-621-M). The full-year 2021 annual rollup was 6.5% (StatCan Canada at a Glance 2023). Individual monthly peaks during the 2020 lockdowns went higher (April 2020 unadjusted share approached 10%) but those reverted as stores reopened. When operators say 'pandemic peak' they usually mean the 6.9% 2021 monthly reading; if you are comparing annual averages, use 6.5%.
what retail categories in canada have the highest online penetration?
Electronics and appliance stores top the list at 31.9% (latest StatCan subsector data, 2022 year-to-date). Clothing is 19.0%, sporting goods/hobby is 18.7%, furniture is 13.0%, and health & personal care is 5.5%. Grocery, gas stations, and motor vehicle dealers barely register online. The 5.7% national average is dragged down by those three.
how do i size my canadian dtc tam without double counting amazon?
Start with StatCan's e-commerce dollar total in your NAICS subsector, not the 12% headline. If you sell apparel, the relevant number is roughly 19% of Canadian clothing store sales, not 12% of all Canadian consumer spending. Then apply your category share assumption. StatCan's retailer survey does capture Amazon Canada's 1P sales as a registered retailer in NAICS 44-45, but it does not fully capture marketplace 3P GMV, digital subscriptions, or travel. Pulling the 12% number into a TAM model means you are implicitly counting marketplace 3P volume, subscriptions, and travel that you cannot capture as a Shopify brand.
what statcan table should i pull for the latest number?
Table 20-10-0056-03 for monthly retail trade e-commerce sales, and Table 20-10-0056-02 for the total retail denominator. Both replaced the older 20-10-0072 and 20-10-0008 tables in the March 2023 StatCan restructure. If you see a methodology page still pointing at the old IDs, it has not been updated.
is canadian ecommerce share still growing or has it plateaued?
Plateaued and slightly declining. The monthly share has stayed in a 5.7% to 6.3% band through 2025 with no clear upward trend, and 2022 e-commerce dollar volume actually contracted 8.6% year-over-year while total retail grew 8.3%. The honest read is that Canadian e-commerce is in a post-pandemic equilibrium, not a growth phase.
how often does statcan release the retail e-commerce data?
Monthly, with about a seven-week lag from the reference month. StatCan publishes a Daily article on Retail trade for each reference month (e.g., the November 2025 reference month was released January 23, 2026). The headline e-commerce share, the dollar numerator, and the retail denominator all refresh on that monthly cadence. Subsector breakdowns from the 11-621-M analytical catalogue refresh on an irregular cadence (the last public release covered 2022 year-to-date). Plan content or model refreshes around the seven-week lag.