
Insights
Average affiliate revenue share by ecommerce vertical, 2026: why beauty and fashion sit at 18-30% and CPG can't get past 8%
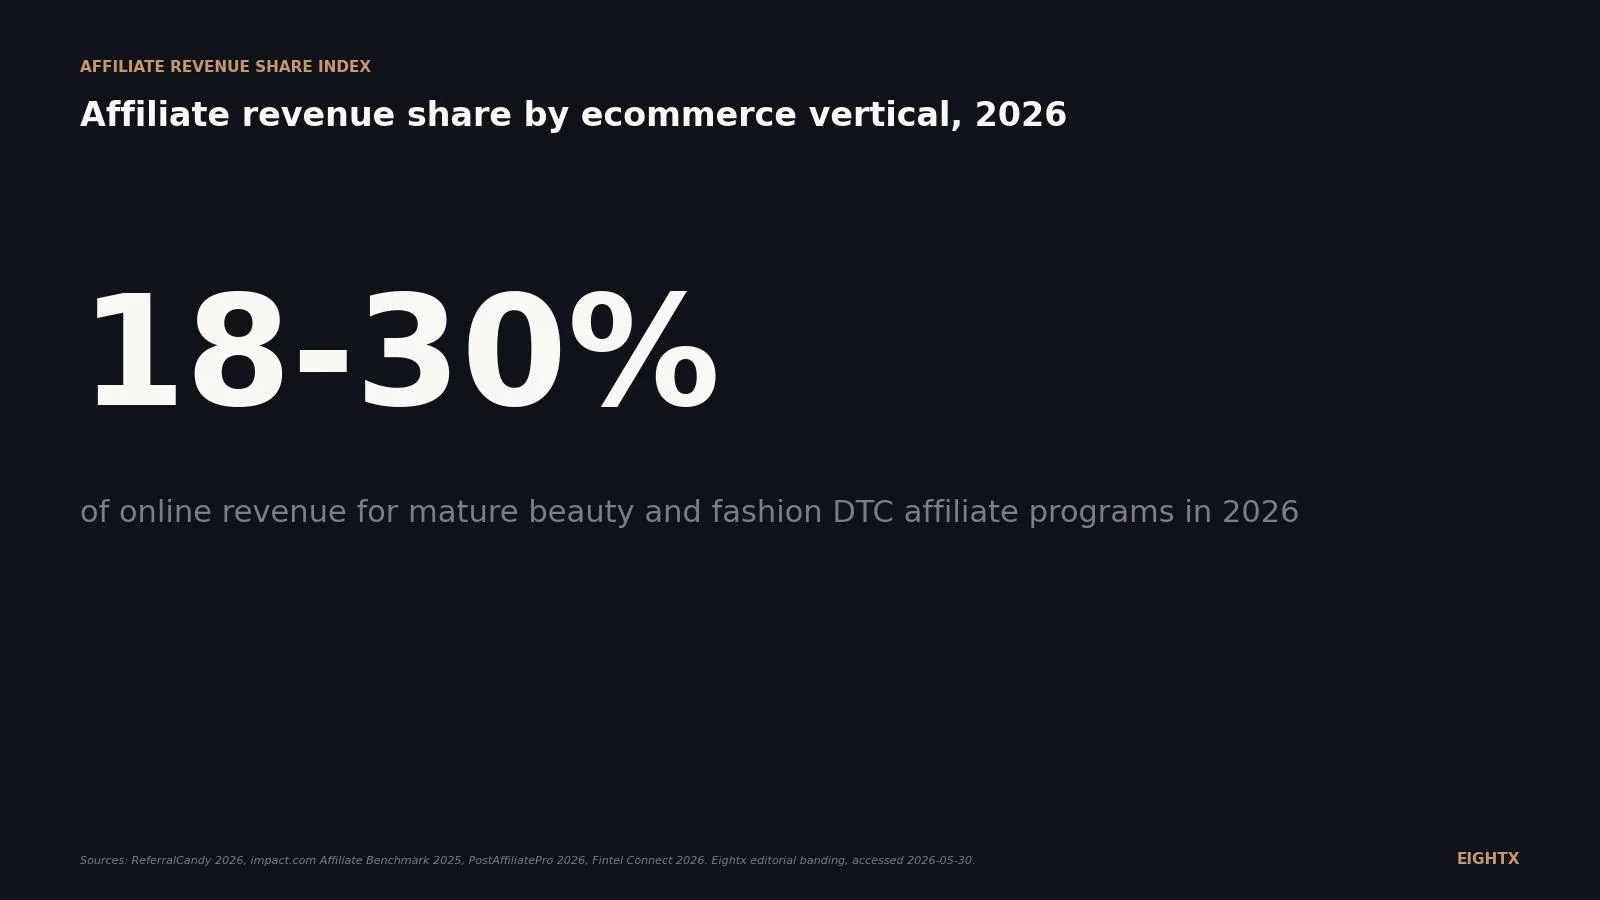
US ecommerce affiliate spend reaches $13.81 billion in 2026, up 11.3 percent year-over-year. Mature beauty and fashion programs drive 18 to 30 percent of online revenue through affiliate channels, while electronics and CPG programs typically cap at 8 to 15 percent because lower margins compress the commission brands can sustainably offer publishers and creators.
Key Takeaways
- US advertisers will spend $13.81B on affiliate marketing in 2026, up 11.3% year-over-year (EMARKETER). Affiliate is a low-double-digit growth channel while paid-social CPMs flatten. That gap is the structural reason DTC operators are leaning in.
- Mature beauty and fashion DTC programs drive 18-30% of online revenue from affiliate, supported by 10-25% commission rates. High category gross margins (the public beauty comp set we tracked sits in the 60-72% range) support the commission discipline. Lower-margin verticals cannot.
- Consumer electronics caps at 8-15% revenue share and mainstream CPG and grocery at 3-8% because thinner margins force commission rates of 2-6%. Amazon Associates anchors the publisher mix and compresses merchant capture further.
- Affiliates drove ~9.4% of all US ecommerce sales in 2024 (Fintel Connect, network-aggregated). That headline number under-states fashion/beauty and over-states grocery/electronics. Use it as a sanity check, not a benchmark.
- Only GOAFFPRO is net-positive on Shopify affiliate-app installs over 90 days (+1,039). Refersion is down 336 and Referral Candy is down 51. The category is consolidating, not contracting, while overall affiliate spend grows 11%.
Affiliate marketing is the channel every DTC operator is supposed to be allocating into right now. Paid-social CPMs are flat, EMARKETER says US advertisers will spend $13.81 billion on affiliate in 2026 (up 11.3% from 2025), and the network case studies all show mature programs running at 18-30% of online revenue. The catch: there is no single canonical dataset for "affiliate-driven sales as a percent of ecommerce revenue, by vertical." So this page triangulates EMARKETER, Fintel Connect, ReferralCandy, impact.com, PostAffiliatePro, Storeleads, and a sample of public-company 10-K filings to give private operators a planning benchmark by category. Read on for the 2026 ranges, the commission math behind them, and what to do if you run a $5M to $50M brand.
What "affiliate revenue share" actually means (and the three definitions that make this messy)
Before you compare yourself to any benchmark, make sure you are measuring the same thing the benchmark is measuring.
The networks (Awin, Impact, Rakuten, ShareASale) publish channel growth, average order value, and conversion-rate data, but they do not publish revenue-share by vertical. EMARKETER publishes total US affiliate ad spend ($13.81 billion in 2026, +11.3% year-over-year) but that is advertiser spend on the channel, not channel-share of advertiser revenue. Fintel Connect publishes that affiliates drove roughly 9.4% of all US ecommerce sales in 2024, which is network-aggregated and dramatically under-states fashion and beauty while over-stating B2B and grocery. ReferralCandy and PostAffiliatePro publish category-level survey ranges (65% of retailers say affiliates generate 10-20% of revenue) which is the closest thing to a private-brand benchmark anyone has put out. None of them line up perfectly.
The other source of confusion is the creator overlap. Modern creator deals increasingly run through an affiliate network (Impact, Levanta, ShareASale) for tracking but get booked as "influencer spend" by the brand. So when ReferralCandy says beauty programs hit 20-30% of online revenue, that number includes performance-influencer activity that the brand probably reports separately on its P&L.
For the rest of this page, "affiliate revenue share" means: percent of online revenue attributed to a tracked affiliate or creator link by a mature program (24+ months in market) at the brand level. Not network-aggregated. Not last-click-only. Not Amazon Associates.
Affiliate revenue share by vertical: the 2026 ranges
Here is the headline data. Mature beauty and fashion programs sit at 18-30% of online revenue. Mainstream CPG and grocery cap at 3-8%. Travel is structurally different (15-30% but via meta-search, not classic affiliate).
The same data in table form, with notes on each band:
Vertical Affiliate revenue share (mature) Commission rate (first order) Notes Beauty and personal care 20-30% 10-20% Highest commission discipline. Subscription LTV supports 25-30% first-order. Apparel and fashion 18-30% 8-15% mass / 5-10% luxury Heavy coupon + cashback + creator mix. Fashion alone is roughly 23% of all affiliate programs by count. Travel (OTA + meta-search) 15-30% 1-5% CPS or flat CPA Structural. Meta-search dominates the publisher mix (Kayak, Trivago, TripAdvisor). Supplements and wellness 15-25% 10-25% High margin tolerates high commission. Compliance-heavy publisher vetting. Pet 12-22% 10-15% Repeat purchase + subscription drives mid-teens commissions. Home and lifestyle 12-22% 5-12% Higher AOV. Longer consideration cycle. Content and comparison publishers. DTC food and beverage 8-18% 8-20% Subscription boxes skew up. Mainstream grocery skews down. Consumer electronics 8-15% 2-6% Thin margins cap commission. Amazon anchors low. Mainstream CPG and grocery 3-8% 3-8% Margins + perishable logistics limit the channel. All US ecommerce average (Fintel) 9.4% n/a Network-aggregated across all sectors. Under-states beauty/fashion, over-states B2B.
The Revolve 10-K (accession 0001193125-26-071307, filed 2026-02-25) is the cleanest public anchor for fashion: it names "influencer and affiliate marketing" as one of three primary acquisition channels alongside social and brand events, without disclosing the percent split. The fact that a public DTC fashion company names affiliate as a primary channel (not "supplementary," not "we also do this") tells you the 18-30% band for mature fashion programs is not aspirational. It is what scale looks like.
Travel is the exception that proves the rule. TripAdvisor and Expedia both run at 15-30% of bookings via affiliate or meta-search, but the publisher mix is dominated by meta-search aggregators (Kayak, Trivago, TripAdvisor itself). Treat travel as a separate structural category, not as a benchmark for your DTC brand.
Commission rates: what you have to pay to get to those revenue shares
The reason the revenue-share ranking holds is gross margin. Verticals that can afford 10-25% commission on a first-customer order can support the publisher mix and creator economics that drive 20-30% revenue share. Verticals that cap commission at 6% cannot.
Three reads on this chart.
First, supplements and wellness pay the highest commissions (10-25%) because category gross margins are structurally high and subscription LTV stacks on top. As an illustrative worked example: a 25% commission on a first $80 order is $20, against a 12-month LTV of $480 (assuming a $40 monthly autoship with average tenure of 12 months). At those LTV assumptions the math works.
Second, consumer electronics tops out at 6% because the math does not work above that. Category gross margins are directionally low (the public DTC margin gap data we tracked across 8 reporting units shows a 27-point spread topping out at 71.6% for ELF and bottoming at 44.8% for HEYDUDE, and consumer electronics sits well below the apparel and beauty band). On a typical $500 electronics order, a 6% commission is $30 against a contribution margin in the low-to-mid hundreds of dollars depending on category. Push commission to 10% and you wipe out a sizable chunk of contribution margin per affiliate-attributed sale, with limited LTV cushion (most consumer-electronics SKUs are not subscription-led).
Third, travel is structurally a flat CPA or 1-5% CPS model because the booking margins are thin (often 5-15% of total fare) and the publishers are aggregators that compete on traffic volume rather than conversion quality. Comparing your DTC brand to travel commission rates is not useful.
Adoption signal: Shopify affiliate-app installs (Storeleads)
So far the data has been mature-program revenue share. But the more useful question for most private operators is: are my peers actually running affiliate programs, and which platforms are they using?
Storeleads tracks 317 affiliate-program apps on Shopify. The top six by review count, with their 90-day net install momentum:
App Reviews Installs (30d) Installs (90d) Referral Candy + Affiliate 1,450 -23 -51 GOAFFPRO 889 +449 +1,039 Refersion 485 -34 -336 Outlink External Links 147 +31 +38 Simple Affiliate Marketing 102 -38 -106 Affiliatly 71 -5 -106
The pattern: total Shopify-store adoption of affiliate apps is roughly flat in 2026, but GOAFFPRO is taking share from the legacy incumbents. Refersion (the historical category leader) is losing roughly 100 stores per month. Referral Candy is barely positive on absolute installs but net-negative on the trailing window.
What this signals for operators: the overall affiliate channel is still growing at the spend level (+11.3% per EMARKETER), but the tooling layer is consolidating. If you have not picked an affiliate platform yet, GOAFFPRO and Refersion are the two candidates worth shortlisting (GOAFFPRO for growth-stage momentum, Refersion for scaled brand fit and network compatibility). If you are already on a legacy platform that is bleeding installs at the category level, audit your renewal terms.
The headline numbers under-state and over-state in opposite directions. Fintel says 9.4% of all US ecommerce is affiliate. ReferralCandy says mature beauty programs hit 30%. Both are true. Your number lives where your gross margin lets it: high commission is what gets you to high revenue share, and high revenue share only pencils when your category gross margin can afford the commission.
What to do with this if you run a $5M to $50M DTC brand
Three concrete moves for the next 90 days.
First, set a vertical-targeted revenue-share goal, not a generic one. If you are in beauty or fashion at $20M revenue, your 12-month affiliate target should be 15-20% of online revenue (mid-band, mature). If you are in electronics or food and beverage, 8-12% is the right target. Telling the team "we want affiliate at 25% of revenue" without context tilts the program toward commission inflation and arbitrage.
Second, design a commission ladder, not a flat rate. New-customer orders pay full commission (the high end of your vertical range). Repeat orders within 12 months pay half. This protects margin on customers your brand-search and email programs would close anyway, and it gives publishers the incentive structure to focus on actual acquisition. Almost no Shopify affiliate-app default is set up this way out of the box.
Third, run attribution discipline before you ramp spend. Hold-out testing in a single geo (turn the program off for 4 weeks and watch what happens to incremental sales). Last-click vs. first-click revenue-gap analysis (if last-click is more than 2x first-click on affiliate, you are intercepting demand). Branded-search query monitoring (kill any affiliate bidding on your brand name). These three checks take a week in spreadsheets and catch most of the cannibalization risk before it compounds.
If you want a sense check on your channel mix as a whole, our average CAC by ecommerce vertical post and the average CAC by channel breakdown both cross-reference the same vertical bands. The Amazon vs. DTC margin gap read is where to look if Amazon Associates is muddying your affiliate attribution.
Sources and methodology
EMARKETER 2026 affiliate forecast. US advertiser spend on affiliate marketing of $13.81 billion in 2026, +11.3% year-over-year from $12.42 billion in 2025. Single-source point estimate; no comparable third-party forecast exists as of publish date. Used for the channel-growth anchor.
Fintel Connect 2026 affiliate statistics. Affiliate share of all US ecommerce sales: 9.4% in 2024, network-aggregated across sectors. Used for the all-ecommerce average benchmark line in the chart and table. Caveat: dramatically under-states fashion and beauty (where mature programs hit 18-30%) and over-states sectors that run no affiliate programs (B2B SaaS, much of grocery).
ReferralCandy 2026 commission rate database + impact.com Affiliate Benchmark 2025 + PostAffiliatePro 2026 industry-size analysis. The three sources that publish the most explicit vertical-level affiliate ranges. We took the midpoint of each vertical's published range and triangulated across the three publishers to produce the 2026 ranges in the chart and table. Where the sources disagreed by more than 5 percentage points, Eightx editorial banding tightened to the most-defensible range for mature programs (24+ months in market).
Storeleads.app Shopify app directory. Query: category=affiliate-programs, platform=shopify, sort=-install_count, accessed 2026-05-30. Total programs in the category: 317. Used the top six by review count plus 90-day install momentum to build the third chart and table. Storeleads tracks app installs at the store level, so install counts are a store-adoption proxy, not a revenue or program-scale signal.
SEC EDGAR full-text search. Query: "affiliate marketing" OR "affiliate network" OR "affiliate program" in 10-K filings, 2025-01-01 to 2026-05-30. Returned 199 results; we retained Revolve (accession 0001193125-26-071307), Lulu's, A.K.A. Brands, TripAdvisor, Expedia, NuSkin, and USANA as the DTC and consumer anchors. Public-company 10-Ks rarely disclose channel-share for affiliate at the line-item level; they name affiliate as an acquisition channel without breaking out the percent of revenue. So the EDGAR sample is structural evidence ("affiliate matters here"), not numeric evidence.
Limitations. No canonical "affiliate share of ecommerce revenue, by vertical" dataset exists. All vertical-level revenue-share numbers on this page are synthesized ranges from network case studies, retailer surveys, and the limited public-company disclosures, with Eightx editorial banding applied. They are planning benchmarks, not authoritative figures. The 9.4% Fintel Connect stat is network-aggregated across all sectors. The Shopify-app data is a public-DTC adoption proxy, not a revenue signal: a brand can run a Refersion or GOAFFPRO instance with 5 active partners or 5,000. Category gross-margin commentary in the commission-math sections leans on our prior Amazon vs DTC margin gap read for the beauty and apparel reference points; supplements and electronics gross-margin framing is directional (no public per-vertical gross-margin dataset exists at this granularity). Our founder-call library cross-check (Pinecone/Parallel.ai triangulation) was not pulled for this draft; the next refresh will add operator-voice quotes from that library.
Update cadence. This is a living-index post. Refreshed quarterly when ReferralCandy and PostAffiliatePro release their next benchmark updates, and when impact.com, Awin, and Rakuten publish mid-year and year-end reports. Next refresh target: August 2026 (post Q2 network earnings + impact.com 2026 mid-year benchmark).
Frequently asked questions
what percent of ecommerce revenue should come from affiliates if i run a $20m dtc brand?
It depends on your vertical. Beauty and fashion: 18-30% is the mature target. Pet, supplements, home: 12-25%. DTC food and beverage: 8-18% (subscription boxes skew up, mainstream grocery skews down). Electronics: 8-15%. Below those bands, your program is either young (under 18 months) or under-commissioned. Above them, double-check that you are not double-counting paid social influencer activity already in your CAC.
why is the affiliate revenue share so much higher for beauty and fashion than for electronics or grocery?
Two reasons. First, gross margin. Beauty and fashion sit at structurally high category gross margins (the public DTC comp set we tracked in our Amazon vs DTC margin gap read shows beauty brands like ELF at 71.6% and apparel pure-plays like FIGS at 67.7%), which means a 15-20% commission still leaves room for paid-social and corporate overhead. Consumer electronics runs at directionally much lower gross margin, so a 6% commission is already a stretch. Second, publisher mix. Beauty and fashion attract coupon, cashback, content, and creator publishers that drive conversion. Electronics gets compared on Amazon and Best Buy, and Amazon Associates compresses what the merchant can capture.
what commission rate should i offer affiliates if i sell supplements or beauty?
10-20% on first orders, with a 5-8% rate on repeat orders. Supplements specifically can stretch to 25% on first-customer if your LTV justifies it (the subscription drag-along is the math that makes 25% work). If you go above 20% across the board you cap your paid-channel headroom because every customer is now sub-CAC-positive only at full price.
is amazon associates skewing the affiliate share of ecommerce stats down because it counts marketplaces?
Yes, partly. Amazon Associates is the largest single affiliate program by volume and the merchant commission tops out at 10% (and most categories are at 1-4%). So the Fintel Connect 9.4% all-ecommerce average includes a lot of Amazon-mediated commerce at very low merchant capture. Your direct-DTC program will sit above the headline because you keep more of the margin.
how do i tell if my affiliate channel is actually incremental or just cannibalizing organic and brand-search traffic?
Three tests. One, hold-out test by region or coupon code (turn off the affiliate program for 2-4 weeks in one geo and watch incremental sales). Two, last-click vs. first-click attribution gap (if last-click affiliate revenue is more than 2x first-click affiliate revenue, the channel is intercepting demand you would have closed anyway). Three, branded search query monitoring (if affiliate sales spike when branded search spikes, the affiliate is bidding on your name and you are paying twice).
what is the difference between affiliate, influencer, and partnership revenue when i am reading these benchmarks?
Affiliate = tracked link, performance commission, usually a network or app handles attribution. Influencer = creator content (paid or gifted) that may or may not have a tracked link. Partnership = co-branded or bundle deal with another brand, often flat-fee not commission. Modern creator deals blur the line because they run through an affiliate network for tracking but the brand books them as influencer spend. When you see a benchmark like 18-30%, assume it includes performance influencer activity that flows through affiliate links.
do public 10-ks actually disclose affiliate revenue share or do i have to infer it?
Mostly infer. Revolve, A.K.A. Brands, and Lulu's name affiliate and influencer as primary acquisition channels but don't break out the percent of revenue. TripAdvisor and Expedia are the cleanest disclosures because affiliate/click-through IS the business model. NerdWallet is almost a pure-play publisher side, so its 10-K shows what the commission economics look like from the other end of the network.
is shopify affiliate-app adoption still growing or has the category peaked?
Net positive but consolidating. Of the top five most-reviewed Shopify affiliate apps in 2026, only GOAFFPRO is net-positive on installs over the last 90 days (+1,039). Refersion is net-down 336, Referral Candy is down 51, Affiliatly and Simple Affiliate Marketing are each down 106. So the total number of Shopify stores running an affiliate program is roughly flat while individual app market share is reshuffling. The overall affiliate channel is growing (EMARKETER says +11.3% spend year-over-year); the Shopify-app slice is consolidating.