
Insights
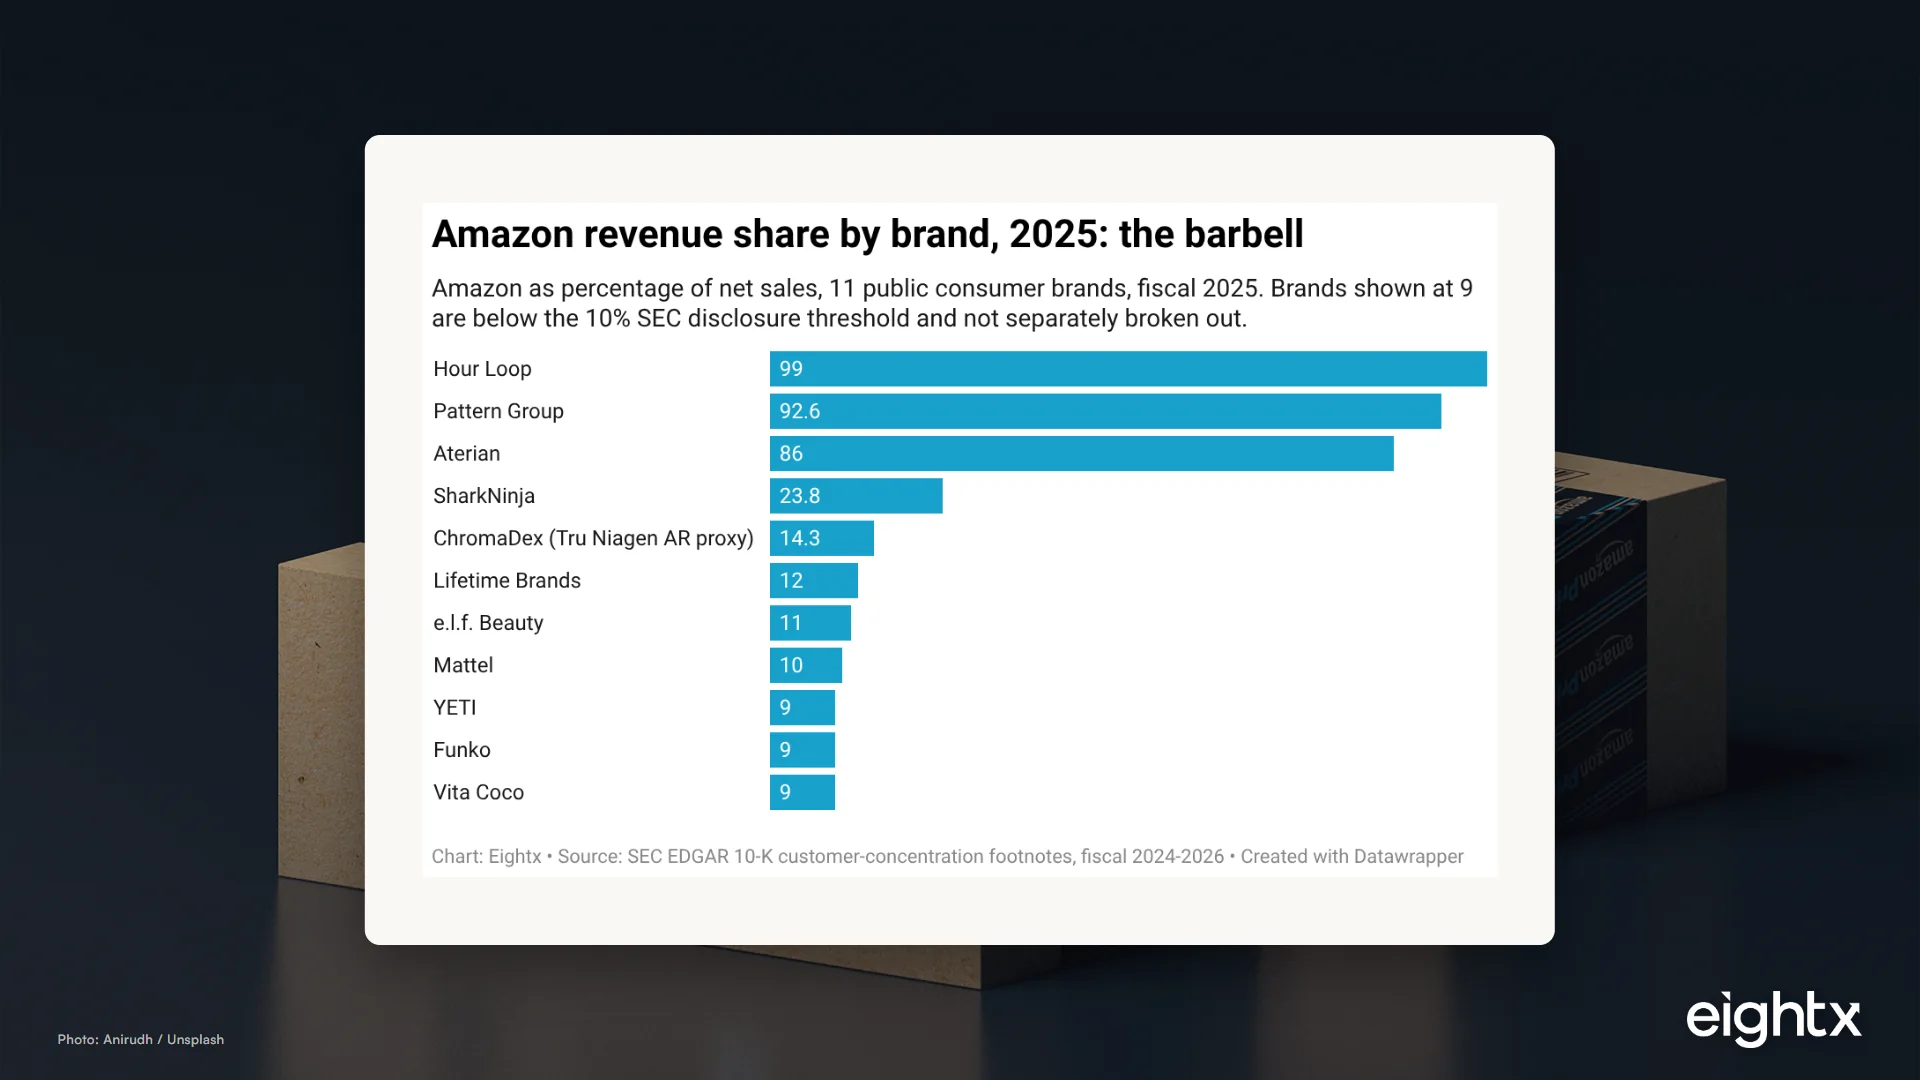
Average Amazon revenue share by ecommerce vertical: 11% at e.l.f. to 99% at Hour Loop (2026 10-K data)
Amazon channel mix ranges from 11% (e.l.f., with strong DTC and retail) to 99% (pure marketplace operators like Hour Loop). Neither extreme is wrong, but both carry specific cash-flow and margin profiles. If Amazon is above 60% of your revenue, your effective gross margin is lower than your P&L suggests once you strip out fees, and your brand equity is renting, not compounding.
Key Takeaways
- Amazon revenue share runs from 11% at e.l.f. to 99% at Hour Loop across the 7 public consumer brands that named Amazon at or above the 10% SEC disclosure threshold (out of 19 brands we sampled). The distribution is a barbell: omnichannel CPG at 10-15%, premium appliance and aggregators in the middle, Amazon-native sellers above 85%. Private DTC brands at $5M-$150M are not in this dataset; the public-brand bands are the closest verifiable benchmark.
- e.l.f. discloses Amazon at 11% of FY26 net sales (down from 12% FY25) alongside Target 18%, Walmart 13%, Sephora 10%. Mattel discloses Amazon at $520M, roughly 10% of consolidated. Lifetime Brands at 12%.
- SharkNinja's largest customer (likely Amazon) sits at 23.8% of net sales 2025, with Amazon, Costco, and Walmart together at 45.7%. SharkNinja is one of fewer than 30 vendors in Amazon's Global Vendor Management (GVM) program.
- Pattern Group hit $2.15B Amazon US plus $0.17B Amazon International of $2.50B total revenue in 2025, or 92.6% Amazon. Amazon US alone grew 78% over two years ($1.21B 2023 to $2.15B 2025).
- Above roughly 30% Amazon concentration, a strategic buyer prices in a multiple discount. The size of the haircut varies by category and deal structure, but the deal-process implication for any private brand running 30%+ Amazon is the same: model the diversification path before you take the meeting, not during it.
Every founder we work with asks the same question at some point: how much of our revenue should run through Amazon. The honest answer is that the cleanest benchmark sits in the customer-concentration footnotes of public-company 10-K filings, where any customer at or above 10% of net sales has to be named. We pulled the most recent annual reports for 19 publicly traded consumer brands across beauty, toys, kitchen, premium appliance, supplements, outdoor, collectibles, beverages, and Amazon-native aggregators. Seven of them named Amazon at 10% or more of net sales; one more (ChromaDex) is included via an accounts-receivable proxy; the remaining 11 sit below the 10% disclosure threshold and so do not break Amazon out individually. One caveat up front: private DTC brands at $5M-$150M revenue (the operators we work with every day) are not in this dataset. Public-brand bands are a starting benchmark, not a one-to-one substitute for private-DTC data. Read the methodology and limitations sections at the bottom before applying any number to your own brand. The pattern in the sample is a barbell. Omnichannel CPG brands cluster at 10-15%. Premium appliance and consumer-tech brands run anywhere from 24% to 86%. Amazon-native aggregators sit above 85%. This page walks through the table, the bands, and what each one implies for a private operator running $5M to $150M in DTC revenue.
What "10% of revenue" actually means on a 10-K
The reason the 10-K is the only verifiable ground truth for public-brand Amazon mix is the SEC's customer-concentration disclosure rule. Regulation S-K Item 101 (Description of Business) and ASC 280 (Segment Reporting) together require any registrant to name a customer that accounts for 10% or more of consolidated net sales. Below 10%, the brand can keep the relationship private. At or above 10%, they have to name the customer and disclose the share.
This is why the data is a barbell, not a smooth curve. Brands sitting just under 10% report Amazon as "a key channel" with no number. Brands sitting at exactly 10% disclose. Brands above 10% disclose with detail. That creates a clean cutoff in the data, and it is also why we cannot get a precise share for YETI, Funko, Vita Coco, Solo Brands, BARK, or any of the seven brands in our sample that sit below the threshold. The MD&A commentary tells you Amazon matters for those brands. It does not tell you by exactly how much.
A second wrinkle: where Amazon shows up in the P&L depends on the brand's classification choice. e.l.f. books Amazon as a wholesale customer, alongside Target and Walmart. YETI, Olaplex, and Crocs put Amazon Marketplace inside their direct-to-consumer (DTC) channel. SharkNinja treats Amazon as one of three top customers via its Global Vendor Management (GVM) program. The classification affects how the marketplace fee hits the income statement and how the brand discusses growth, but it does not change the revenue-share number we are tracking on this page. For more on the gross-margin and contribution-margin implications of those classification choices, see our Amazon vs DTC margin gap analysis.
The barbell: 10-15%, 25-50%, and 85-95%
Here is what the public-brand distribution actually looks like.
Three clear bands.
Band 1: omnichannel CPG at 10-15%. e.l.f. Beauty (11%), Mattel (~10%), Lifetime Brands (12%). These brands sell heavily through physical retail (Target, Walmart, specialty chains) and use Amazon as one channel among many. The 10-15% ceiling reflects a deliberate choice to keep brand presentation and ASP control in physical retail. None of the three is shrinking Amazon. None is racing to grow it faster than the rest of the mix.
Band 2: premium appliance and the curated middle at 20-50%. SharkNinja's largest customer (almost certainly Amazon) sits at 23.8%, with Amazon, Costco, and Walmart combined at 45.7%. This is the zone where Amazon is a strategic channel that the brand is leaning into but not yet dependent on. The premium-appliance category benefits from Amazon's review density and Prime fulfillment, and the brands in this band actively participate in Amazon programs (Vine, GVM, A+ content investment).
Band 3: Amazon-native sellers at 85-99%. Aterian (86%), Pattern Group (93%), Hour Loop (99%). For these businesses, Amazon is the platform on which the business runs. Aterian is the cautionary tale (revenue collapsed from peak, board authorized a strategic-alternatives review in December 2025). Pattern Group is the structurally Amazon-dependent growth story (Amazon US revenue grew from $1.21B in 2023 to $2.15B in 2025, the bulk of which is pre-IPO and surfaced via S-1 historicals restated in Pattern's first 10-K). Hour Loop is the textbook pure-play third-party seller. Concentration risk is the business model.
The operator decision the bands point to: 10-15% is the "healthy diversification" range most omnichannel CPG brands run. 25-50% is "the premium brand being eaten by its own marketplace" zone where the strategic logic is real but the concentration risk is becoming material. Anything above 80% is single-customer concentration risk that gates valuation in any sale process, full stop.
Brand-by-brand: the 10-K table
The full sourced table, with the verbatim 10-K disclosure for each brand we pulled.
Brand Ticker Vertical Fiscal year Amazon share of net sales Source e.l.f. Beauty ELF Beauty FY26 (ended Mar 31 2026) 11% 10-K filed 2026-05-21 e.l.f. Beauty ELF Beauty FY25 12% 10-K filed 2025-05-29 Mattel MAT Toys FY25 ~10% ($520M of consolidated) 10-K filed 2026-02-23 Mattel MAT Toys FY24 ~10% ($510M of consolidated) 10-K filed 2025-02-26 Lifetime Brands LCUT Housewares & kitchen FY25 12% 10-K filed 2026-03-12 Lifetime Brands LCUT Housewares & kitchen FY24 13% 10-K filed 2025-03-13 Lifetime Brands LCUT Housewares & kitchen FY23 11% 10-K filed 2024 SharkNinja SN Premium small appliance FY25 ~24% (Amazon/Costco/Walmart aggregate 45.7%) 10-K filed 2026-03-02 Aterian ATER Home & small appliance FY25 86% 10-K filed 2026-03-23 Aterian ATER Home & small appliance FY24 92% 10-K filed 2026-03-23 Pattern Group PTRN Multi-vertical (Amazon aggregator) FY25 ~93% (Amazon US $2.15B + Amazon Intl $0.17B of $2.50B) 10-K filed 2026-03-06 Hour Loop HOUR Multi-vertical (third-party Amazon) FY25 ~99% ("practically all" of $142.4M) 10-K filed 2026-03-24 ChromaDex (Tru Niagen) CDXC Supplements FY24 14.3% of consumer-products AR (revenue proxy) 10-K filed 2025-03-04 YETI YETI Outdoor drinkware FY25 <10% (Amazon Marketplace inside 60% DTC channel) 10-K filed 2026-02-27 Funko FNKO Collectibles FY25 <10% (Amazon a named key retailer, not broken out) 10-K filed 2026-03-12 Vita Coco COCO Beverages FY25 <10% (Amazon not named in customer concentration) 10-K filed 2026-02-18 Solo Brands DTC Outdoor FY24 <10% (Amazon a third-party DTC supplement) 10-K filed 2025-03-12 BARK BARK Pet FY25 <10% (Amazon + Chewy named partners; commerce segment 14.1%) 10-K filed 2025-06-04 Children's Place PLCE Children's apparel FY25 not material individually 10-K filed 2026-04-10
What is moving: 2023 to 2025 trends in three verticals
Lining up the brands that disclosed Amazon for multiple years tells you which categories are seeing Amazon's share rise and which are seeing it fall.
Three things to notice in the trend.
Amazon is gaining in toys and supplements. Mattel's Amazon dollars grew $10M while Walmart and Target both shrank. ChromaDex's Amazon accounts-receivable proxy moved from 12.2% to 14.3%. The mass-retail-shrinks-while-Amazon-grows pattern is structural in categories where physical-store traffic is in slow decline.
Amazon is steady in beauty. e.l.f. moved from 12% to 11% year over year (essentially flat, customer-mix noise rather than a strategic move). Sephora, Target, and Walmart all grew in absolute terms in e.l.f.'s FY26 disclosure. Amazon is not losing share, but it is also not winning it from physical retail in the beauty category yet.
Amazon is falling in Amazon-native businesses. Aterian went from 92% to 86% as it intentionally diversified into Walmart and other marketplaces during its strategic review. This is the only direction the dependency-ratio number moves voluntarily, and it usually moves slowly.
The implication, within the brands we sampled: Amazon's share is rising in the categories where the public mass-retail anchor is contracting (Mattel in toys, ChromaDex in supplements) and steady-to-down where physical-retail is still growing (e.l.f. in beauty). This is a two-to-three-data-point read, not a category-wide claim. We are not pulling Circana toys or NielsenIQ beauty data here. The operator takeaway is still useful: your category's Amazon-share trend tends to track what is happening to your physical retail comp more than what is happening on your Amazon team.
Mattel's customer-mix shift is the playbook
The Mattel 2024 to 2025 disclosure deserves its own look because it shows how Amazon "wins" without growing in absolute terms.
Walmart fell $90M. Target fell $50M. Amazon grew $10M. Net change across the top three customers: -$130M. But Amazon's relative share inside the top three rose from 21.6% to 23.3% because everyone else fell faster than Amazon held flat. The company described the year as "approximately 42% of worldwide consolidated net sales" running through the top three, down from approximately 44% in 2024.
Read this as the macro story for any brand that sells into both Amazon and big-box retail right now. You do not have to grow on Amazon to gain Amazon share. You just have to not shrink as fast as your physical-retail accounts. That makes the Amazon channel structurally important even when its absolute dollars are flat, and it explains why every founder we talk to feels like Amazon "keeps getting bigger" even when their own Amazon team is delivering flat year-over-year results.
The corollary: if you are flat on Amazon and shrinking at Target, your CFO model needs to reweight Amazon's contribution to free cash flow in next year's plan. The dollars did not change. The dependency did.
What this means for your business at $5M to $150M
Three operator decisions follow directly from the public-brand bands.
Pick your band before you pick your tactics. If you run an omnichannel CPG brand at $20M to $100M, the public-brand evidence says you should aim for 10-15% Amazon. If you run a premium-appliance or consumer-tech brand at the same revenue band, 25-40% is the realistic ceiling before concentration risk starts pricing into your valuation. If you are pure-play Amazon (you do not run your own Shopify store at scale, or you do not own retail relationships), you are in the 80%+ band by default and the play is to extend runway by diversifying into Walmart Marketplace, your own DTC site, or wholesale.
Push diversification when Amazon contribution margin drops below your owned-DTC contribution margin by 15+ points. That is the financial signal that the Amazon channel is gross-margin dilutive. Most brands we work with do not realize this gap exists because they book Amazon referral fees, FBA fees, and PPC inside cost-of-sales, which obscures the channel comparison. Fix the chart of accounts first. Then make the call. See our breakdown of how Amazon and DTC channel margins differ in public 10-K disclosure for the accounting-level fix.
Above 30% Amazon, model the deal-process implications now, not later. A private-equity or strategic buyer in 2026 prices in a multiple discount for Amazon concentration above 30%. The size of the haircut varies by category, growth rate, and deal structure, so we will not quote a single multiple here. The buyer is not penalizing Amazon. They are penalizing single-customer risk under a contract Amazon can change unilaterally. The 18-to-24-month diversification path (Walmart Marketplace, owned DTC growth, retail door count, international Amazon, B2B wholesale) is what brings the multiple back. Start the work two years before you take the meeting.
The public-brand data points to a barbell, not a smooth curve. 10-15% is the omnichannel CPG band. 25-50% is the premium-channel band where the strategic logic is real but the concentration risk is becoming material. Above 80% is the Amazon-native band where the business model and the concentration risk are the same thing. Know your band, run the math, and pick the diversification path two years before you need it.
For the full picture of how Amazon channel economics translate into the P&L line by line, see our Amazon vs DTC margin gap analysis and our overview of interim CFO services for the kind of channel-mix work we run with private DTC operators every week.
Sources and methodology
SEC EDGAR 10-K filings reviewed. e.l.f. Beauty (ELF) 10-K filed 2026-05-21 for fiscal year ended March 31, 2026, customer-concentration footnote: "Target 18%, Walmart 13%, Amazon 11%, Sephora 10%" for FY26 versus "Target 23%, Walmart 16%, Amazon 12%, Ulta 12%" for FY25. Mattel (MAT) 10-K filed 2026-02-23 for FY ended December 31, 2025: "During 2025, Mattel's three largest customers (Walmart at $1.08 billion, Target at $0.63 billion, and Amazon at $0.52 billion) accounted for approximately 42% of worldwide consolidated net sales." Lifetime Brands (LCUT) 10-K filed 2026-03-12 for FY ended December 31, 2025: "sales to Amazon accounted for 12%, 13% and 11% of consolidated net sales [in 2025, 2024, 2023]." SharkNinja (SN) 10-K filed 2026-03-02: "largest customer representing 23.8% of net sales ... Amazon, Costco and Walmart, each of which accounted for more than 10% of our net sales, and together made up 45.7% ... We are one of fewer than 30 vendors selected to be part of the Amazon Global Vendor Management (GVM) program."
Amazon-native businesses. Aterian (ATER) 10-K filed 2026-03-23: "In 2025 and 2024, approximately 86% and 92% of our revenue was through the Amazon sales platform, respectively." Pattern Group (PTRN) 10-K filed 2026-03-06, revenue-disaggregation table: Amazon.com $2,147.186M plus Amazon Marketplaces International $170.758M of total revenue $2,501.315M, or 92.6% Amazon. Hour Loop (HOUR) 10-K filed 2026-03-24: "we have generated practically all of our revenue as a third-party seller on Amazon ... net sales grew from $0 to $142,440,236" from 2013 to 2025. Pattern Group is a recent IPO (2025), so the 10-K is the first one; the multi-year trend lines for Pattern come from S-1 historicals re-stated in this filing.
Below-threshold brands. YETI (YETI) 10-K filed 2026-02-27: "No single customer accounted for 10% or more of our gross sales in 2025 ... DTC channel net sales increased $40.2 million, or 4%, ... primarily driven by growth in our Amazon Marketplace business." Funko (FNKO) 10-K filed 2026-03-12 names Amazon as the #1 US retail partner alongside Hot Topic, Walmart, Target, and GameStop, but does not break it out at or above 10%. Vita Coco (COCO) 10-K filed 2026-02-18 does not name Amazon in customer concentration. ChromaDex (CDXC) 10-K filed 2025-03-04 discloses A.S. Watson Group at 12.5% of net sales and Amazon Marketplaces at 14.3% of consumer-products accounts receivable (used here as a revenue-share proxy because direct disclosure is not provided).
Search methodology. SEC EDGAR full-text search via MCP for "Amazon" "percentage of net sales" and "Amazon" "of our net" "revenue" filtered to form 10-K, date range 2025-01-01 through 2026-05-29. 116 results for the first query, 545 for the second. Sorted by relevance score. Top 20 across both result sets were pulled and filtered to brands fitting the consumer-products profile.
Limitations. Public-company filings only disclose Amazon when it is at or above 10% of consolidated net sales. Seven of the 19 brands we sampled sit below that threshold and are included in the table as "<10%" with no precise number available. Private DTC brands ($5M-$150M revenue) are not in this dataset at all. ChromaDex's 14.3% is an accounts-receivable proxy, not a direct revenue disclosure, and may differ by a few hundred basis points from the true revenue share. SharkNinja does not name its largest customer explicitly; the 23.8% figure is widely understood by analysts to be Amazon based on context but is not confirmed in the filing text. Pattern Group's IPO-related restatements may differ slightly from prior privately reported numbers.
Update cadence. Refreshed quarterly as new 10-K and 10-Q filings land. Next update target: August 2026 (FY2026 H1 filings).
Frequently asked questions
what percent of revenue should come from amazon if i run a dtc brand?
There is no single right number, but the public-brand data points to three bands. Omnichannel CPG brands hold Amazon to 10-15% (e.l.f. 11%, Lifetime 12%, Mattel 10%). Premium appliance and curated marketplaces run 20-50% (SharkNinja 24%). Amazon-native businesses sit at 85-99% (Aterian 86%, Pattern 93%, Hour Loop 99%). Pick the band that matches your category and your willingness to accept concentration risk at exit.
is 30% amazon too much for a $20m apparel brand?
It is at the edge. 30% concentration in a single customer is the level where a private-equity or strategic buyer starts pricing in a multiple discount because the platform can change fees or terms unilaterally. If you are above 30% and building toward a sale in the next 2-3 years, the diversification work should start now. If you are not selling, 30% is workable but you should know your unit economics on the channel cold.
how do i tell if my brand is over-indexed on amazon?
Three signals. Concentration: Amazon over 30% of revenue. Profitability: Amazon contribution margin below your owned-DTC contribution margin by more than 15 points. Customer file: if 60%+ of your repeat customers buy on Amazon instead of your website, you do not own the relationship even if you booked the first sale. Any two of the three and you are over-indexed.
why do beauty brands like elf cap amazon at 10-15%?
Because brand presentation and merchandising still matter in beauty, and the mass retailers (Target, Walmart, Sephora, Ulta) carry the brand at full-price ASP with controlled merchandising. Amazon takes share but cannot displace the physical-retail discovery loop. e.l.f.'s FY26 disclosure shows Target at 18%, Walmart at 13%, Sephora at 10%, Amazon at 11%. The mix is by design, not accident.
how does pattern group make 92% of revenue from amazon and stay alive?
Pattern Group's business is being the Amazon channel operator for brands that do not want to run their own seller team. Amazon dependency is the product, not a risk. The 10-K still flags it as a Risk Factor (any Amazon policy change is existential) but the equity story is built on Amazon US growing from $1.21B to $2.15B in two years. Pattern survives by being indispensable to enough brands that Amazon will not displace it without breaking thousands of vendor relationships.
what amazon concentration kills a sale process to a strategic buyer?
Above 50% you have a single-customer-risk problem that most strategic buyers will not underwrite without a major multiple haircut or seller-financed structure. Between 30% and 50% you can still close a deal, but the buyer will discount the multiple; how much depends on category, growth rate, and deal structure. Below 30% Amazon concentration stops being the lead diligence question. Plan the diversification path 18 to 24 months ahead of any process.
how do i reduce amazon dependency without tanking topline?
Three plays that work in private DTC. First, build an email and SMS file off your Amazon shipments using package inserts pointing to a useful destination (warranty registration, exclusive flavor, refill subscription). Second, launch a Shopify-exclusive SKU or bundle so the catalog itself differs. Third, push retail door count if you have product-market fit at mass. None of these moves Amazon to zero. They move the dependency ratio while topline grows.
how do mattel walmart target and amazon shares actually move year to year?
Mattel's 2024 to 2025 disclosure is the cleanest example. Walmart shrank from $1.17B to $1.08B (-$90M). Target shrank from $0.68B to $0.63B (-$50M). Amazon grew from $0.51B to $0.52B (+$10M). Amazon's share of Mattel went up by holding while peers shrank, not by absolute growth. That is the pattern across the three multi-year disclosures we have (Mattel in toys, ChromaDex in supplements, e.l.f. in beauty): inside the brands we sampled, Amazon is gaining share by holding while peers shrink, not by category-wide growth.