
Insights
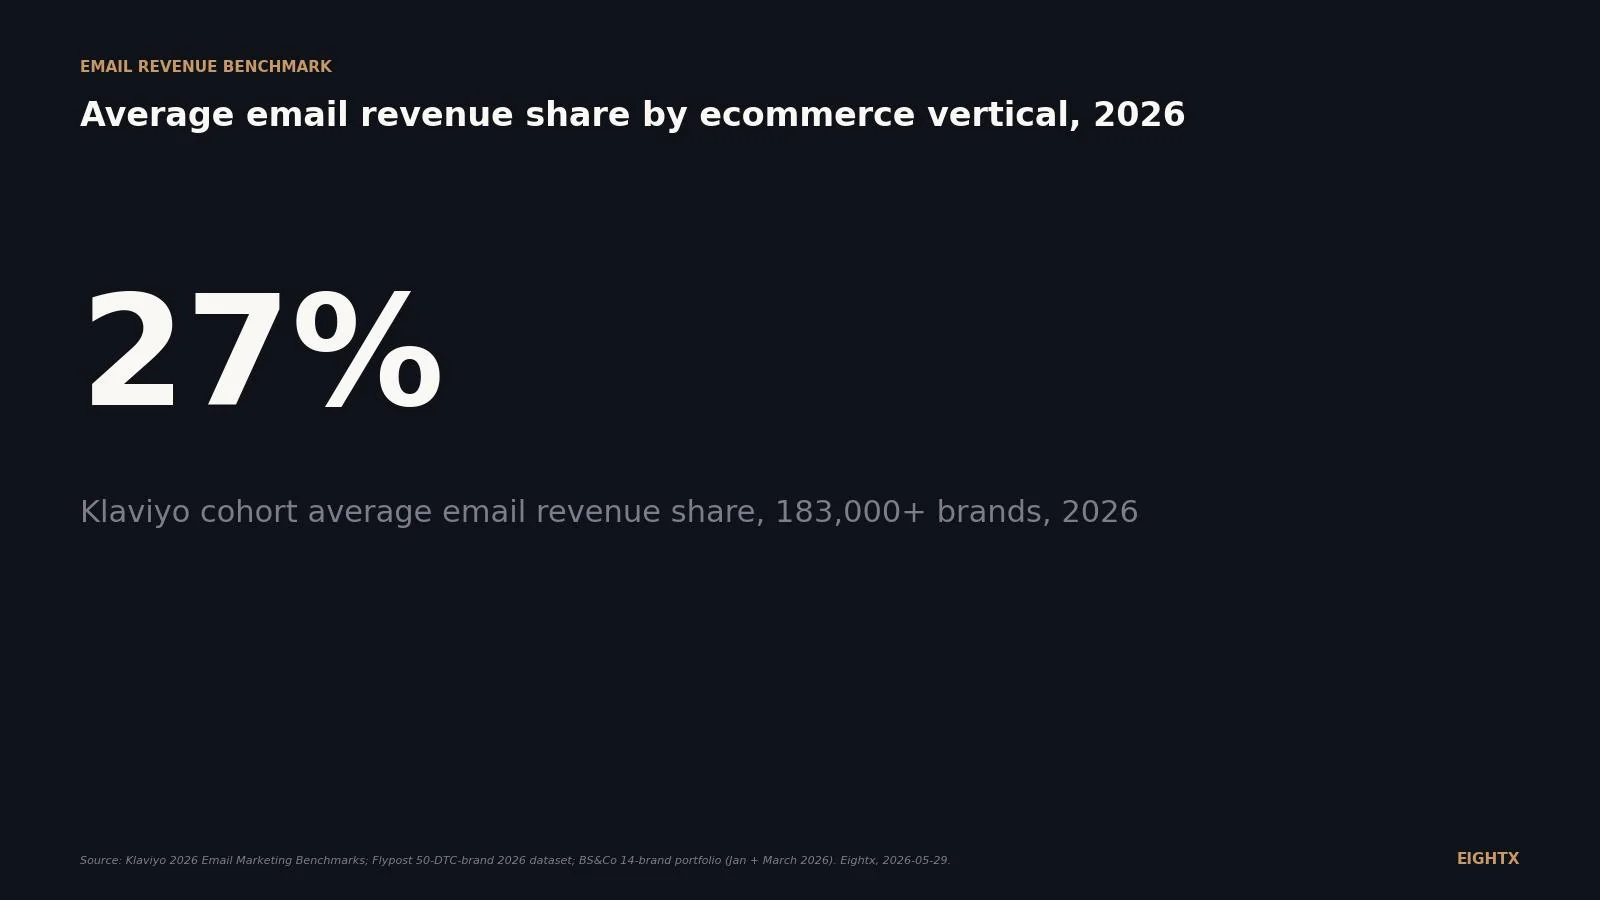
Average email revenue share by ecommerce vertical, 2026: Klaviyo says 27% across the cohort. Your number is probably lower.
Klaviyo's 27% cohort average is skewed toward mature senders with large lists. Most brands under $10M are closer to 15 to 20%. The gap usually comes from list size, send frequency, or flow coverage, not deliverability. Knowing your vertical's benchmark tells you how much upside is actually on the table.
Key Takeaways
- Klaviyo's 2026 benchmark puts email at 27% of total store revenue across its 183,000+ customer cohort. That number is the all-vertical aggregate, not your benchmark. The realistic ceiling for any individual brand is set by your vertical, your program maturity, and your AOV/repeat economics.
- The vertical you operate in caps the realistic ceiling. High-repeat consumables (supplements, beauty, food, pet) can sustain 30-45%. Apparel tops out 20-35%. High-AOV durables (home, jewelry, sporting goods) sit 15-30%. Electronics and automotive cap at 12-25% because purchase frequency is lower and discovery skews paid and search.
- Flows are 5.3% of sends but ~41% of email revenue. Average flow revenue per recipient (RPR) is roughly 18 times higher than campaign RPR in Klaviyo's 2026 dataset. BS&Co's 14-brand portfolio measures the gap at 26x ($1.58 vs $0.06).
- BS&Co's 14-brand Klaviyo agency portfolio averages 33.7% of total store revenue from email, six points above Klaviyo's all-cohort number. The gap is the no-program tail. Curated portfolios exclude the brands that haven't built flows yet.
- If you're below 20% in a high-repeat vertical, the gap is almost always flow coverage, not list size or ESP. A $5M apparel brand below 20% can usually add 8-12 points of email revenue share by closing welcome, abandoned cart, browse abandonment, post-purchase, and win-back flows. Volume isn't the lever.
Every founder we work with eventually asks: how much of our revenue should come from email. The clean answer sits in Klaviyo's 2026 benchmark, which reports that email drives approximately 27% of total store revenue across its 183,000+ customer cohort. That is the most-citable single number in the data, but it hides a five-times spread between brands that built flows and brands that didn't, and the vertical you operate in caps the realistic ceiling. This page puts the 27% headline in context, breaks the realistic ranges down by vertical, and explains why a $5M apparel brand sitting below 20% should not buy a new ESP (email service provider) until it audits its flows. The cluster pairs with our Klaviyo vs Attentive vs Mailchimp adoption analysis. This post is about revenue contribution. The Klaviyo adoption post is about platform share. Different question, same audience.
The 2026 read in one paragraph
Klaviyo's published 2026 cohort sits at about 27% of total store revenue from email. The cohort is 183,000+ Klaviyo customers reporting through Klaviyo's benchmark tool, growing to 196,000+ total customers at Q1 2026 per the company's SEC filings. That cohort skews toward brands with mature enough analytics to opt into the benchmark, so the true Shopify-wide population mean is likely lower. Across the agencies and portfolios that publish their own numbers, curated samples skew higher: BS&Co's 14-brand Klaviyo agency portfolio reports 33.7% for March 2026. Flypost's 50-DTC-brand 2026 dataset shows the same shape with a five-tier maturity curve from no-program (0-8%) through elite (40%+). The single most actionable read for a private operator: anchor on your vertical's typical range, not the 27% headline.
The Klaviyo benchmark number, in context
The 27% all-cohort figure is published on Klaviyo's marketing-resources benchmarks page and reflects last-click email-attributed revenue (campaigns plus flows) as a share of total store revenue, calendar-year average across the cohort. Klaviyo is the dominant ESP on Shopify (429,249 Shopify installs indexed by Storeleads as of May 2026), so the denominator credibility is real. Klaviyo's FY2025 revenue was $1.234B (+32% year-over-year) on 196,000+ customers at Q1 2026, with 4,175 customers above $50K ARR per the Q1 2026 8-K. The benchmark is the platform-wide aggregate. It is not a per-vertical revenue-share number. Klaviyo publishes per-vertical engagement (open rate, click rate, placed-order rate) but does not publish per-vertical revenue-share. The vertical bands in the chart and table on this page are synthesized from Klaviyo's per-vertical engagement signal, Flypost's per-vertical examples, and BS&Co's portfolio mix. Read the methodology section before applying any single number to your own brand.
By vertical: where the realistic ceiling lives
High-repeat consumables sit at the top of the range. Supplements, beauty, food and beverage, and pet brands can sustain 30-45% of total store revenue from email because subscribe-and-save replenishment, predictable repurchase cycles, and product education content all favor owned channels. Apparel typically tops out 20-35%, driven by seasonal launches and post-purchase flows but capped by discovery economics. High-AOV durables (home and garden, jewelry, sporting goods, hardware and home improvement) sit 15-30%, where the lower purchase frequency limits the email program's repeat-revenue ceiling. Electronics and automotive cap at 12-25% because discovery skews paid and search, and the once-every-two-years purchase cycle keeps email from compounding. Klaviyo's per-vertical engagement table cross-references these bands: apparel sits at the top of the open-rate spread (33.1%, with jewelry and home and garden close behind at 32.5%) and posts the highest published campaign placed-order rate at 0.17%, while electronics and automotive sit at the lower end of the open-rate range (29.3% and 29.4%; automotive's published placed-order rate is 0.14% and Klaviyo does not publish one for electronics).
Vertical Open rate (campaigns) Click rate (campaigns) Placed-order rate (campaigns) Typical email % of revenue Strong / top-quartile target Clothing & accessories (apparel) 33.1% 1.83% 0.17% 20-30% 28-35% Health & beauty 30.5% 1.24% n/a 25-35% 35-45% Food & beverage 31.2% 1.70% n/a 25-35% 35-45% Supplements (subset of health & beauty) 30.5% 1.24% n/a 30-40% 40-50% Jewelry 32.5% 1.60% 0.08% 18-28% 30-32% Home & garden 32.5% 1.78% 0.13% 15-25% 25-30% Hardware & home improvement 30.9% 1.84% n/a 15-22% 25-28% Sporting goods 31.9% 1.90% 0.16% 18-25% 25-30% Electronics 29.3% 1.85% n/a 12-22% 20-25% Automotive 29.4% 1.83% 0.14% 12-20% 20-25% All verticals (Klaviyo cohort average) 31.0% 1.69% 0.16% / flows 2.11% ~27% 30-40%
Why the 27% hides a five-times maturity spread
Flypost's 50-DTC-brand 2026 dataset shows program maturity drives more revenue-share variance than vertical does. No-program brands sit at 0-8% (basic welcome flow only or nothing). Average brands at 12-20% (welcome plus abandoned cart, weekly campaigns, basic segmentation). Strong programs hit 20-30% (full lifecycle: welcome, cart, browse, post-purchase, win-back, with segmentation and A/B testing). Top-quartile operators reach 30-40% (predictive segments, advanced flow logic, list hygiene). Elite programs run 40-55% or higher (email as primary growth and retention channel, with subscription or replenishment flows and cross-channel orchestration). The Klaviyo cohort average of 27% sits between Strong and Top-quartile. The practical implication: a $5M apparel brand below 20% has a flow coverage problem, not a list size or ESP problem. The next 8-12 points of revenue share come from building the five core flows, not from sending more campaigns.
Flows vs campaigns: the asymmetry that defines mature programs
Flows are 5.3% of email send volume and roughly 41% of email revenue in Klaviyo's 2026 all-cohort dataset. Average flow revenue per recipient (RPR) runs about 18 times higher than campaign RPR. BS&Co's 14-brand Klaviyo agency portfolio measures the gap wider at 26 times ($1.58 flow RPR vs $0.06 campaign RPR, March 2026). That asymmetry defines what a mature program looks like: most of the revenue comes from automations triggered by behavior, not from manual blasts. The placed-order rate confirms it: campaigns convert at 0.16% and flows at 2.11% across the Klaviyo cohort, a 13-times gap.
Metric Flows Campaigns Source Share of send volume 5.3% 94.7% Klaviyo 2026 benchmark Share of email revenue ~41% ~59% Klaviyo 2026 benchmark Revenue per recipient $1.58 $0.06 BS&Co March 2026 (14-brand portfolio) Placed-order rate 2.11% 0.16% Klaviyo 2026 benchmark Revenue multiplier vs campaigns ~18x (Klaviyo cohort) / ~26x (BS&Co) baseline Klaviyo + BS&Co 2026
If you are below the band for your vertical, the gap is almost always flow coverage, not list size or ESP. Klaviyo's cohort sits at 27% because most brands haven't built welcome, abandoned cart, browse abandonment, post-purchase, and win-back yet. Those five flows alone close most of the gap between average (12-20%) and strong (20-30%).
What to do this week if your number is below the band
Three moves. Pull your Klaviyo revenue percentage report for the trailing 90 days and divide by Shopify total revenue for the same window. That is your benchmark number. Compare to the typical range for your vertical above, not the 27% headline. Audit your flow coverage. If welcome, abandoned cart, browse abandonment, post-purchase, and win-back are not all live with at least three emails each, the campaign-volume conversation is the wrong one. Close that coverage before doing anything else. Check your flow vs campaign revenue split. If campaigns are driving more than 70% of your email revenue, the program is under-built on automations regardless of how many campaigns you send. The benchmark to target is 40% flows / 60% campaigns on the way to mature, then 50/50 as predictive segments and post-purchase journeys mature.
For more on how channel mix interacts with overall DTC unit economics, see our Amazon vs DTC margin gap analysis and the broader Klaviyo vs Attentive vs Mailchimp Shopify Plus comparison.
Sources and methodology
Klaviyo 2026 Email Marketing Benchmarks by Industry. Klaviyo's published benchmark page covers per-vertical campaign engagement (open rate, click rate, placed-order rate, revenue per recipient) across 13 ecommerce verticals: clothing and accessories, health and beauty, food and beverage, jewelry, home and garden, hardware and home improvement, electronics, sporting goods, automotive, office supplies, mass merchant, specialty, and toys and hobbies. The cohort is reported as 183,000+ Klaviyo customers as of the FY2025 reporting cycle, growing to 196,000+ at Q1 2026 per Klaviyo's SEC filings. Source: https://www.klaviyo.com/products/email-marketing/benchmarks.
Klaviyo Ecommerce Benchmark Report. Klaviyo's marketing-resources benchmark page reports the all-cohort average of approximately 27% of total store revenue from email. Same cohort, aggregated revenue-share view. Source: https://www.klaviyo.com/marketing-resources/ecommerce-benchmarks. The per-vertical revenue-share table does not exist as a Klaviyo publication. The vertical bands in Chart 1 and Table 1 are synthesized from the per-vertical engagement signal plus Flypost and BS&Co data.
Flypost 50-DTC-brand 2026 dataset. Independent benchmark of 50 DTC brands across apparel, beauty, supplements, and consumables. Source for the 5-tier maturity framework (no-program 0-8% through elite 40%+) and the per-vertical strong-program ranges used in Chart 1 and Table 1. Source: https://www.flypost.agency/blog/email-marketing-revenue-benchmarks-for-ecommerce-real-data-from-50-dtc-brands-2026.
BS&Co Q1 2026 14-brand Klaviyo portfolio. Agency-curated benchmark reporting 33.7% email revenue share, $1.58 flow RPR, and $0.06 campaign RPR across 14 Klaviyo-managed brands for January and March 2026. Source: https://bsandco.us/blog-post/ecommerce-email-marketing-benchmarks-january-2026 and https://bsandco.us/blog-post/ecommerce-email-marketing-benchmarks-march-2026. Used as second-source validation that operator-curated portfolios skew higher than Klaviyo's all-cohort number.
Klaviyo SEC filings. Q4 2025 Supplemental and Q1 2026 8-K (CIK 0001835830, filed 2026-05-05). Source for FY2025 revenue $1.234B (+32% year-over-year), 196,000+ total customers at Q1 2026, customer cohort above $50K ARR growing to 4,175. Confirms the live denominator the benchmark cohort sits on. Source: SEC EDGAR https://www.sec.gov/cgi-bin/browse-edgar?action=getcompany&CIK=0001835830&type=10-K.
Storeleads Klaviyo Shopify install count. 429,249 active Klaviyo Shopify installs indexed by Storeleads as of May 2026. Source: Storeleads API technology query, accessed 2026-05-29.
Limitations. Klaviyo's 27% is last-click email-attributed revenue inside Klaviyo. Cross-channel attribution models like GA4 will typically show lower email contribution because Klaviyo's last-click model captures email-touched conversions that GA4 might assign to direct or organic. Klaviyo's cohort is brand-self-reported via the Klaviyo benchmark tool and skews toward brands with mature analytics, so the true population mean across all Shopify brands is likely lower than 27%. The 5-tier maturity framework comes from a 50-brand third-party dataset, not Klaviyo, and should be read as directional guidance, not certified Klaviyo benchmark. The vertical taxonomy collapses some categories (supplements as a high-repeat subset of health and beauty; CPG food rolled into food and beverage) for operator readability.
Update cadence. Klaviyo updates the benchmark report annually with quarterly engagement-page refreshes. BS&Co publishes monthly. Flypost is a one-shot 2026 dataset. This post is marked for quarterly refresh; next target update is mid-August 2026 after Klaviyo's Q2 2026 8-K and BS&Co's July or August portfolio benchmark.
Frequently asked questions
what percent of my ecom revenue should come from email in 2026?
Use your vertical as the anchor, not the 27% cohort headline. Supplements, beauty, food and beverage, and pet can sustain 30-45% of total store revenue from email. Apparel runs 20-35%. Home, jewelry, sporting goods, and hardware sit 15-30%. Electronics and automotive cap at 12-25% because purchase frequency is lower. If you are below the bottom of your vertical's band, the gap is almost always flow coverage.
why does klaviyo say 27% when my agency keeps telling me 30-40%?
Different denominator. Klaviyo's 27% is the all-cohort average across 183,000+ brands, including a long tail of no-program and basic-program stores that drag the number down. Agency portfolios like BS&Co (14 brands, 33.7%) curate for operators that actually built flows, which is why they skew higher. Both numbers are correct. They just measure different populations.
what's the typical email revenue share for apparel vs beauty vs supplements?
Apparel typically lands 20-30% with strong programs hitting 28-35%. Beauty and health and beauty run 25-35% typical, 35-45% strong. Supplements and nutraceuticals push higher (30-40% typical, 40-50% strong) because subscribe-and-save replenishment economics structurally favor email. The vertical difference is repeat-purchase frequency, not creative.
should flows or campaigns be a bigger share of my email revenue?
Flows should drive roughly 40% of email revenue from 5% of sends. That is Klaviyo's all-cohort 2026 number, and BS&Co's portfolio reports the same shape (flow RPR $1.58 vs campaign RPR $0.06). If campaigns are doing more than 70% of your email revenue, you are under-built on automations, not under-sending campaigns. Build coverage on welcome, abandoned cart, browse abandonment, post-purchase, and win-back before adding campaign volume.
what does it mean if my email is doing less than 15% of total revenue?
Almost always one of three things: missing or weak flows (most common), a brand-new list with insufficient size and segmentation depth, or you are in a structurally low-share vertical like high-AOV electronics. Audit your flow coverage first. A welcome series, abandoned cart, browse abandonment, post-purchase, and win-back set should be live before you change anything else. ESP swap and more campaign sends are the wrong first move.
is the klaviyo 27% number based on last-click attribution?
Yes. Klaviyo's revenue share is last-click email-attributed revenue as reported inside Klaviyo. Cross-channel attribution like GA4 model comparison will typically show a lower email contribution because Klaviyo's model captures email-touched conversions that GA4 might assign to direct or organic. When you compare your number to the benchmark, use Klaviyo's number, not GA4. Different denominators give different answers.
how do i compare my klaviyo number to the benchmark properly?
Same period, same denominator. Use Klaviyo's revenue percentage report for a 30 or 90-day window and your Shopify total revenue for the same window. Include flows and campaigns. Exclude SMS unless you are benchmarking the combined Klaviyo number. The 27% is a calendar-year average across the cohort, so a single-month comparison can swing 5-10 points either way without meaning much.
does sms cannibalize email revenue or add to it?
Mostly add, partly cannibalize, depending on overlap. Operators with both channels typically see SMS add 5-15% incremental revenue on top of email, not steal from it, because the audiences and intents differ (SMS is shorter, more transactional, more time-sensitive). The cannibalization risk is real on broadcast sends to the same window. Audit the overlap by checking how much of your SMS-attributed revenue came from subscribers who also clicked email in the prior 7 days.