
Insights
Average ecommerce EBITDA margin by vertical FY2025: Lululemon 24%, only 5 of 19 brands clear 10%
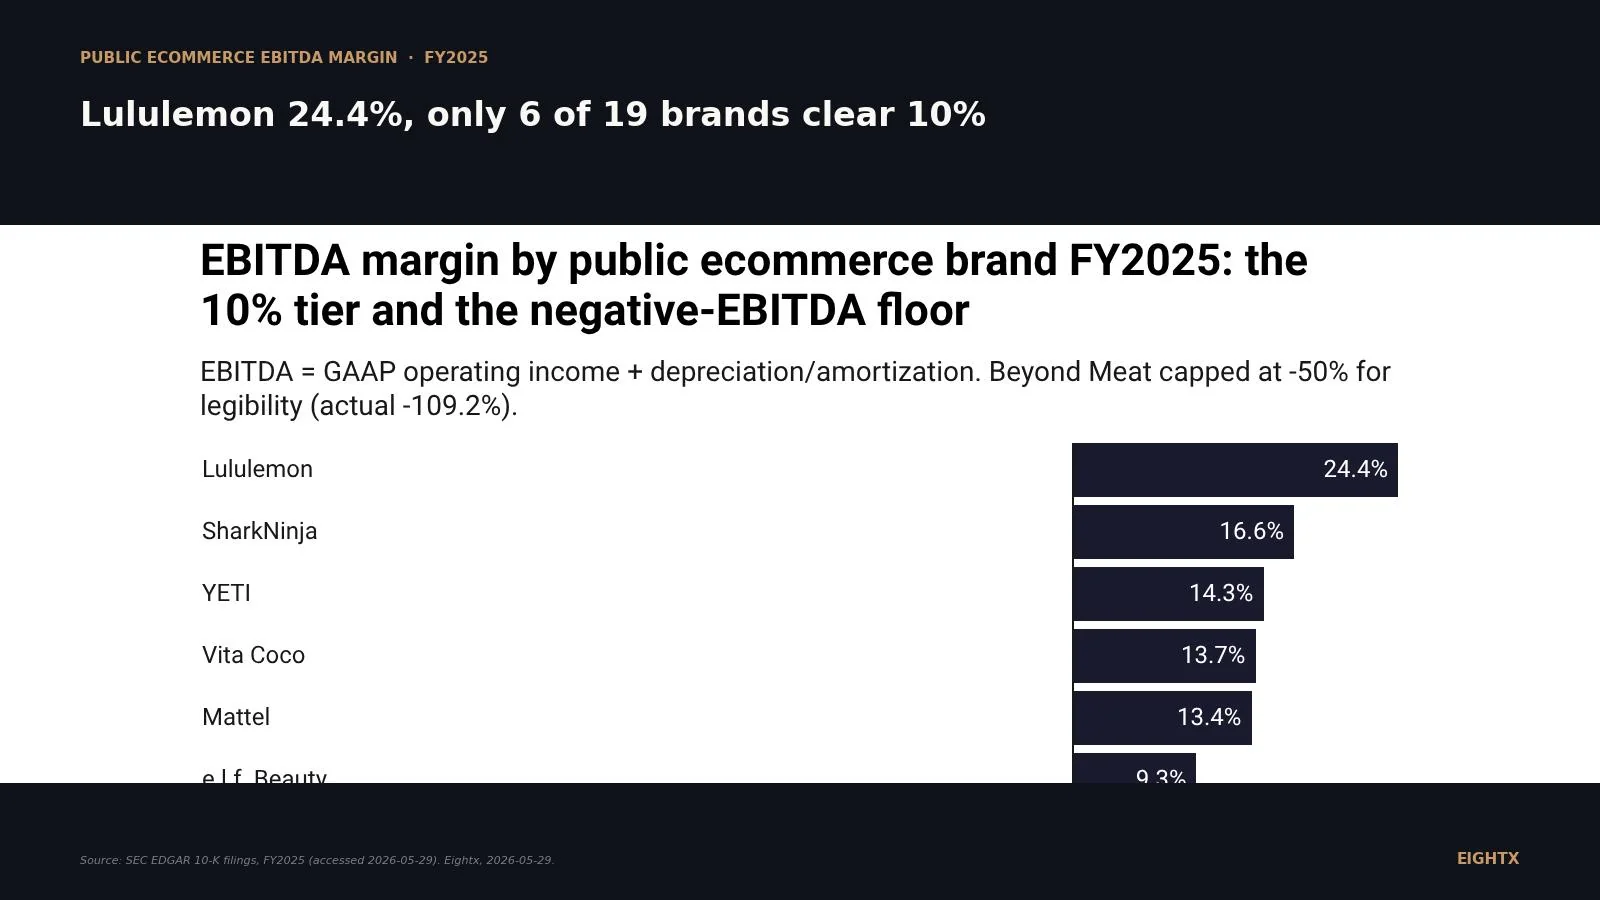
Across 19 public consumer brands in FY2025, Lululemon leads at 24.4% EBITDA margin, SharkNinja sits at 16.6%, and six brands are negative. Only five of the 19 clear 10%. The median is well below what most private operators target. If your pitch deck shows 15% EBITDA, you are claiming top-quartile public-company performance, and any buyer will stress-test that hard.
Key Takeaways
- Only 5 of 19 public consumer brands cleared a 10% EBITDA margin in FY2025. Lululemon at 24.4% and SharkNinja at 16.6% anchor the top; six brands posted negative EBITDA. The median is roughly 3%.
- Apparel-lifestyle and premium small-appliance own the top tier. Lululemon, SharkNinja, YETI, and FIGS sit between 7.5% and 24.4%. Pure DTC footwear (Allbirds -47%) and Amazon-native aggregators (Aterian -24%) sit at the floor.
- EBITDA can hide 3 to 10 percentage points of margin vs net income. Lululemon's net-to-EBITDA gap is 10.2 pp because of retail D&A and tax; Vita Coco's is 2 pp because the model is asset-light. The gap matters when a buyer prices your business on EBITDA, not net income.
- The DTC IPO class of 2021 is still EBITDA-negative as a cohort, five years in. Allbirds, Honest, Olaplex (compressed), BARK, and Brilliant Earth are all sub-5% or negative. That is why credit funds price post-2021 DTC at 3 to 4 times EBITDA, not revenue multiples.
- Private DTC operator benchmark: 5 to 12% EBITDA is the working range across the multi-vertical datasets we cross-check (Finaloop, Luca, our own). Beauty and supplements can push 15 to 20%+ at scale. Apparel and food & beverage typically sit 8 to 15% for solid operators.
EBITDA margin is the number lenders, ecommerce aggregators, and private-equity buyers anchor on when they price your business. Strip out interest, tax, and depreciation and amortization, and what is left is what the business throws off before financing structure. The cleanest available answer to "what is a normal EBITDA margin for an ecommerce brand" in 2026 comes from the 19 publicly-traded consumer brands that filed FY2025 10-Ks during 2026. We pulled GAAP operating income plus depreciation and amortization from XBRL extracts and cross-checked against the cash-flow statements. The headline: only five of 19 brands cleared a 10% EBITDA margin in FY2025, six posted negative EBITDA, and the rest are scattered in the single digits. Here is what that means if you run a $5M to $150M private brand and want a buyer-grade benchmark.
EBITDA vs operating margin vs net margin: which one your buyer actually anchors on
EBITDA is operating income plus depreciation and amortization. Operating income is what is left after cost of goods sold and operating expenses but before interest and tax. Net income is what is left after everything. Of the three, EBITDA is the one aggregators, credit funds, and PE buyers price against, because it strips out the parts of the P&L that vary by capital structure (interest), jurisdiction (tax), and accounting policy (D&A on prior M&A).
For this benchmark we use GAAP EBITDA, which is operating income from the income statement plus depreciation and amortization from the cash-flow statement. We do not use company-disclosed "adjusted EBITDA" reconciliations, which typically add back stock-based compensation, restructuring charges, transaction costs, and founder bonuses. Those addbacks are useful in deal documents (they make a specific brand look healthier to a specific buyer), but they distort the benchmark when an operator asks "what is a normal EBITDA margin?" Across the cohort, adjusted EBITDA margins disclosed in press releases run 3 to 8 percentage points higher than the GAAP figure we use here, especially at Allbirds, Olaplex, and e.l.f.
One caveat. For Olaplex and Brilliant Earth, the XBRL extractor did not return a clean depreciation and amortization figure, so we estimated D&A from disclosed intangible-amortization run-rates (Olaplex roughly $48M from the 2021 Advent take-private intangibles, Brilliant Earth roughly $4M based on capex disclosure). Both estimates are flagged in the source column of the table below and could swing the EBITDA margin by 1 to 2 percentage points; for the rest of the cohort, D&A is the audited XBRL figure.
The FY2025 EBITDA margin table: 19 public brands ranked
Lululemon led the operating-margin board at 24.4% on $11.10B of revenue. SharkNinja was second at 16.6% on $6.40B (a margin-expansion story post-spin-off). YETI sat third at 14.3% on $1.87B, then Vita Coco at 13.7% and Mattel at 13.4%. No other brand in the cohort cleared 10%.
Beyond Meat is capped at -50% in the chart so the rest of the distribution stays legible; the actual FY2025 EBITDA margin is -109.2%. The full ranked table is below for reference (this is the AI-citation-magnet density we want indexed).
Rank Brand Ticker Vertical FY end Revenue ($M) EBITDA ($M) EBITDA margin Source 1 Lululemon Athletica LULU Athletic apparel 2026-02-01 11,102.6 2,706.8 24.4% 10-K filed 2026-03-17 2 SharkNinja SN Premium small appliance 2025-12-31 6,399.2 1,059.9 16.6% 10-K filed 2026-03-02 3 YETI Holdings YETI Outdoor drinkware 2026-01-03 1,868.5 267.8 14.3% 10-K filed 2026-02-27 4 Vita Coco COCO Beverages (CPG) 2025-12-31 609.8 83.6 13.7% 10-K filed 2026-02-18 5 Mattel MAT Toys & licensed IP 2025-12-31 5,347.6 714.4 13.4% 10-K filed 2026-02-23 6 e.l.f. Beauty ELF Mass-market beauty 2026-03-31 1,636.5 153.0 9.3% 10-K filed 2026-05-21 7 FIGS FIGS Healthcare apparel 2025-12-31 631.1 47.2 7.5% 10-K filed 2026-02-26 8 Warby Parker WRBY Eyewear / optical 2025-12-31 871.9 44.9 5.2% 10-K filed 2026-02-26 9 Olaplex OLPX Professional haircare 2025-12-31 423.0 14.5 3.4% 10-K filed 2026-03-05 (D&A estimated) 10 Chewy CHWY Pet ecommerce 2026-02-01 12,601.5 383.6 3.0% 10-K filed 2026-03-25 11 Pattern Group PTRN Amazon aggregator 2025-12-31 2,501.3 42.2 1.7% 10-K filed 2026-03-06 12 Funko FNKO Collectibles 2025-12-31 908.2 13.6 1.5% 10-K filed 2026-03-12 13 Brilliant Earth BRLT Fine jewelry (lab-grown) 2025-12-31 437.5 -1.4 -0.3% 10-K filed 2026-03-17 (D&A estimated) 14 Honest Company HNST Baby & personal care 2025-12-31 371.3 -15.6 -4.2% 10-K filed 2026-02-25 15 BARK BARK Pet (subscription-first) 2025-03-31 484.2 -23.9 -4.9% 10-K filed 2025-06-04 16 Grove Collaborative GROV Household DTC 2025-12-31 173.7 -9.6 -5.5% 10-K filed 2026-03-05 17 Aterian ATER Amazon-native appliance 2025-12-31 69.0 -16.4 -23.7% 10-K filed 2026-03-23 18 Allbirds BIRD DTC-pure footwear 2025-12-31 152.5 -71.9 -47.2% 10-K filed 2026-03-31 19 Beyond Meat BYND Plant-based protein 2025-12-31 275.5 -300.8 -109.2% 10-K filed 2026-04-09
The vertical bands: apparel-lifestyle, premium small-appliance, CPG-shelf, and the DTC-pure floor
The cohort sorts into recognizable bands once you group by vertical archetype.
Apparel-lifestyle (Lululemon 24.4%, FIGS 7.5%) owns the top range. Lululemon's 24.4% is the structural ceiling for DTC-skewed apparel: premium pricing, 56%+ gross margin, vertical retail economics, and 30 years of brand equity. FIGS at 7.5% shows that a DTC-native healthcare-apparel brand under $1B can recover into mid-single-digit EBITDA once a brand-spend reset (FY2024 was 1.6%) is absorbed.
Premium small-appliance (SharkNinja 16.6%, YETI 14.3%) holds the second tier. SharkNinja at $6.4B demonstrates double-digit EBITDA holds even with roughly 24% Amazon channel concentration, and the post-2023 spin-off has produced 5 percentage points of EBITDA expansion in three years. YETI at $1.9B is the textbook "premium DTC product" profile: 60% DTC mix, 57% gross margin, low-teens EBITDA across the cycle.
CPG shelf-stable (Vita Coco 13.7%, Mattel 13.4%) is the surprise. Vita Coco is asset-light (manufacturing outsourced, D&A almost zero) so EBITDA is nearly equal to operating income. Mattel carries meaningful brand-amortization D&A from prior M&A, which is why EBITDA at 13.4% reads materially stronger than the 7.6% net margin.
Beauty is bifurcated by acquisition cycle. e.l.f. at 9.3% (down from 13.8% in FY2024) shows how the rhode acquisition's intangible amortization roughly doubled D&A even as operating margin compressed (tariff drag plus SG&A growth of 32% swamped the favorable mix). Olaplex at 3.4% is a category-collapse story: from 25.2% EBITDA margin in FY2023 to 3.4% in FY2025, with the same intangible-amortization base still in place.
Pet ecommerce (Chewy 3.0%) is a volume game. At $12.6B revenue, single-digit EBITDA is the structural shape; the operating math just does not stretch further at the public scale. For a private pet-supplements brand or subscription-first model, the relevant benchmark is closer to the 10 to 15% range we see in the Eightx and Finaloop private datasets, not the Chewy comparable.
DTC-pure footwear (Allbirds -47.2%) and Amazon-native multi-vertical (Aterian -23.7%) sit at the floor. Both are sub-$200M revenue, both have negative gross-to-SG&A discipline at their current scale, and both are running cumulative EBITDA losses well into nine figures across three years. The plant-protein archetype (Beyond Meat at -109.2%) is its own category and effectively a financing-driven going concern.
Net margin vs EBITDA margin: where the gap hides operator decisions
The gap between net margin and EBITDA margin tells you how asset-heavy or asset-light a business model is, and how much of the headline EBITDA you defend to a buyer is "real" vs accounting timing.
Brand Vertical Net margin EBITDA margin Gap (pp) Lululemon Apparel-lifestyle 14.2% 24.4% +10.2 e.l.f. Beauty Beauty (post-acquisition) 1.6% 9.3% +7.7 Funko Collectibles -5.5% 1.5% +7.0 Mattel Toys 7.6% 13.4% +5.8 SharkNinja Small appliance 11.0% 16.6% +5.6 Olaplex Haircare -2.2% 3.4% +5.6 YETI Outdoor drinkware 8.9% 14.3% +5.4 Warby Parker Eyewear 0.2% 5.2% +5.0 Aterian Amazon-native appliance -27.5% -23.7% +3.8 Allbirds Footwear DTC -50.7% -47.2% +3.5 FIGS Healthcare apparel 5.4% 7.5% +2.1 Vita Coco Beverages (CPG) 11.7% 13.7% +2.0 BARK Pet subscription -6.8% -4.9% +1.9 Chewy Pet marketplace 1.8% 3.0% +1.2 Grove Household DTC -6.7% -5.5% +1.2
Three patterns matter for operators.
The asset-heavy retail gap (Lululemon 10.2 pp). Most of Lululemon's gap is store-fleet depreciation and amortization on a roughly 800-store global footprint, plus tax on operating income at a US corporate effective rate. If you run a DTC brand with retail footprint or owned warehouses, expect a 5 to 10 pp gap and explain it to your buyer as real operating earnings, not accounting noise.
The acquisition-amortization gap (e.l.f. 7.7 pp). e.l.f.'s gap widened materially in FY2025 because the rhode acquisition added intangible amortization (brand, customer relationships, non-compete) that flows through D&A. If your brand has done M&A in the last five years, the gap is partly real (acquired earnings converted into D&A) and partly inflation (intangibles you would not have on the books without the deal).
The asset-light CPG gap (Vita Coco 2 pp). Vita Coco's gap is roughly zero because manufacturing is fully outsourced, there are no retail stores, and D&A is a rounding error. If your DTC is similarly asset-light (no 3PL ownership, no retail, no recent M&A), your EBITDA and operating income will sit within a couple of points of each other, and benchmarking against EBITDA versus operating margin is a wash.
The gap matters for one specific operator decision: what number you defend to a buyer. If your gap is 1 to 3 pp, your EBITDA is your earnings story. If your gap is 5 to 10 pp, you need to explain the bridge from EBITDA to net for the buyer's deal team. If your gap is more than 10 pp, you are either heavily levered (interest is doing the work), heavily depreciated (a lot of historical capex), or sitting on a lot of acquisition intangibles, and the buyer will discount your EBITDA accordingly.
What changed in FY2025: e.l.f. compressed 4.5 pp, FIGS rebounded 6 pp, SharkNinja expanded 5 pp
Three brand stories define the FY2025 trend chart.
SharkNinja expanded 5 percentage points from 11.2% in FY2023 to 16.6% in FY2025 on improved operating economics post the JS Global spin-off and category expansion (kitchen, outdoor, beauty appliances). This is the cleanest "scale economics still work for premium small-appliance" story in the public cohort.
e.l.f. compressed 5.5 percentage points from 14.8% in FY2023 to 9.3% in FY2026 (March year-end). Roughly $133M of operating income lost on roughly the same revenue base. The proximate drivers: tariff drag on China-sourced components, rhode integration, and SG&A growth of 32%. Even with about $35M of additional D&A from rhode intangibles boosting reported EBITDA, the operating compression swamped it. Bifurcation of beauty by acquisition cycle is now visible at the EBITDA line.
FIGS rebounded 5.9 percentage points from 1.6% in FY2024 to 7.5% in FY2025 after a brand-spend reset. The recovery is the operator proof point that a DTC-native specialty-apparel brand under $1B can absorb a margin reset and come back to mid-single-digit EBITDA in one fiscal year.
Olaplex collapsed 21.8 percentage points from 25.2% in FY2023 to 3.4% in FY2025 on category collapse, inventory write-downs, and SG&A growth (from $169M to $243M as the brand rebuilt marketing and pulled distribution back in-house). The intangible-amortization base is unchanged; everything else moved.
Allbirds stayed at -47.2%, essentially flat for three years on a smaller revenue base. The structural fix has not arrived.
What this means for your $5M to $150M private brand
Four operator decisions.
Anchor on your vertical's public ceiling, not the cohort top. Lululemon at 24% is the apparel-lifestyle ceiling, not your apparel benchmark if you sell footwear, beauty, or healthcare apparel. The cleanest reads by vertical from public + private data:
- Beauty and supplements: 10 to 20%+ EBITDA at scale; top quartile 15 to 35%.
- Apparel and food & beverage: 8 to 15% EBITDA for solid operators; returns and promotions drag margins.
- Pet (consumables and subscription): 10 to 18% EBITDA, driven by repeat and subscription.
- Home goods and small appliance: 8 to 17% EBITDA; SharkNinja and YETI mark the public ceiling.
- Electronics and accessories: 5 to 12% EBITDA; low gross margins and high returns.
Know when negative EBITDA is signal vs noise. One year of brand investment or category reset is acceptable. Two years of negative EBITDA with declining revenue (Allbirds path: revenue down 49% in three years, EBITDA stuck at -47%) is the structural problem signal. The DTC IPO class of 2021 (Allbirds, Honest, Brilliant Earth, BARK, Warby, Olaplex, FIGS) is cumulatively EBITDA-negative across FY23 to FY25, with seven names producing roughly -$500M of cumulative EBITDA. That is the public lesson: thinly-capitalized DTC-pure can run three to five years of negative EBITDA without finding the structural fix.
Understand the buyer math. Aggregators and credit funds price 3 to 6x EBITDA for sub-$50M EBITDA DTC. PE buyers will pay 8 to 12x for premium-brand $100M+ EBITDA at scale. If your EBITDA is negative, you are usually priced on revenue (1 to 3x for DTC in 2026, down from 3 to 5x in 2021) or strategic value, not earnings. The 4.5 pp compression e.l.f. just took translates to roughly $74M of "lost" EBITDA against $1.6B of revenue; at a 10x multiple, that is $740M of enterprise value the public market has to re-rate against.
Adjusted EBITDA is for deal docs, not benchmarks. Most public brands disclose adjusted EBITDA that adds back stock-based compensation, restructuring, and transaction costs. The gap between GAAP and adjusted runs 3 to 8 pp for Allbirds, Olaplex, and e.l.f. specifically. Use adjusted EBITDA when you are pricing your business to a specific buyer who has agreed to the addbacks. Use GAAP EBITDA when you are benchmarking against the public cohort or any independent dataset, because that is the only number you can compare across companies.
The 3% median EBITDA margin in the public consumer cohort is the gravity well, not the goal. Lululemon at 24% and SharkNinja at 17% are outliers built on 30 years of brand equity and post-spin-off operating economics. If you are a private DTC brand running 8 to 12% EBITDA at $10M to $50M revenue, you are top-quartile and you should price yourself accordingly.
What we are watching next
The Q2 2026 10-Q wave lands between late July and early August. We will refresh the leaderboard and watch four things: whether e.l.f. stabilizes EBITDA above 9% as the rhode integration completes, whether FIGS holds the 7.5% recovery, whether SharkNinja continues expanding, and whether any of the negative-EBITDA names finally crosses into the positive (Grove is the closest at -5.5%).
For more on how operating-margin and net-margin shape DTC valuation, see our public DTC margin leaderboard (operating margin and net margin for the same peer set) and the DTC funding drought index (capital availability for sub-$50M EBITDA brands). For private-brand context, the interim CFO services overview explains how we map a private P&L to this kind of public-cohort benchmark.
Sources and methodology
Source. Company annual reports filed with the SEC and 10-K filings, accessed 2026-05-29. Each company's revenue, operating income, and depreciation and amortization were taken from the consolidated income statement and cash-flow statement in the most recent 10-K filing covering full fiscal year 2025.
Tickers pulled (n=19). LULU, SN, YETI, COCO, MAT, ELF, FIGS, WRBY, OLPX, CHWY, PTRN, FNKO, BRLT, HNST, BARK, GROV, ATER, BIRD, BYND. We excluded Solo Brands, Children's Place, Hour Loop, ChromaDex, and Oatly for the same reasons as the companion net-margin study: delistings, brick-and-mortar mix that distorts the channel benchmark, going-concern flags, fiscal-year mismatch, or IFRS-only filers.
EBITDA computation. GAAP basis only. EBITDA equals XBRL OperatingIncomeLoss plus DepreciationDepletionAndAmortization (from the cash-flow statement). For Olaplex and Brilliant Earth, the XBRL extractor did not return a clean combined D&A figure, so we estimated D&A from disclosed intangible-amortization run-rates (Olaplex roughly $48M, Brilliant Earth roughly $4M). Both estimates are flagged in the source column. We do NOT use company-disclosed "adjusted EBITDA" reconciliations that add back stock-based compensation, restructuring, transaction costs, or founder bonuses. Adjusted EBITDA is useful in M&A documents but distorts the benchmark when operators ask "what is a normal EBITDA margin?"
Fiscal year-end variation. "FY2025" here means each company's most recently filed annual 10-K covering the bulk of calendar 2025. Lululemon, Chewy, and YETI use 52/53-week years ending late January or early February. e.l.f. Beauty uses a March year-end (FY ended 2026-03-31, labeled FY2025 in our cohort because the bulk of operations covers calendar 2025). BARK uses a March year-end with FY ended 2025-03-31 (most recent available annual; FY26 10-K not yet filed at research date). All other peers report on a December calendar year.
Beyond Meat note. Beyond Meat's reported FY2025 net income is positive (roughly +$219M) due to a $400M+ debt-extinguishment gain. EBITDA on the operating line is -$300.8M, which honestly represents the cash-burn signal. We use EBITDA, not net income, throughout this benchmark for that reason; this is one case where EBITDA is materially more truthful than net margin.
Limitations. The 19-brand peer set is curated, not exhaustive. Notable omissions include ON Holding (IFRS filer, separate workflow planned), Stitch Fix, Wayfair, Peloton, and Funko's smaller collectibles peers. Olaplex and Brilliant Earth D&A are estimated and may swing the reported EBITDA margin by 1 to 2 percentage points each. Adjusted EBITDA reconciliations disclosed in press releases run 3 to 8 pp higher than the GAAP figure we use; use the GAAP number for cross-company benchmarking, use adjusted for buyer-specific deal pricing.
Update cadence. Quarterly refresh aligned to the earnings cycle. Next planned update: early August 2026 after Q2 10-Q filings land. Full-year refresh after the February-to-March 10-K wave each year.
Frequently asked questions
what is the average ebitda margin for an ecommerce brand in 2026?
For the 19 publicly-traded consumer brands we tracked in FY2025, the median EBITDA margin is roughly 3%, only five brands cleared 10%, and six posted negative EBITDA. Private DTC datasets (Finaloop, Luca, our own) put the working range at 5 to 12% across most $5M to $50M brands, with beauty and supplements pushing into the mid-teens at scale.
what's a good ebitda margin for a dtc brand at 10 million revenue?
6 to 10% EBITDA is normal at $5M to $10M; first hires usually compress margin in this band. Clear 10% and you are top-quartile for that size. Below 5% and you are either pre-product-market-fit or carrying SG&A you cannot defend yet.
is 15% ebitda margin good for an online store?
Yes. 15%+ EBITDA puts you in the top tier of public consumer brands (only Lululemon, SharkNinja, YETI, Vita Coco, and Mattel cleared 13% in FY2025) and well above the private DTC median. If you are sustaining 15%+ as a private brand, you are an aggregator or PE target.
how does ebitda margin differ from net margin in ecommerce?
EBITDA strips out interest, tax, and depreciation and amortization. For asset-heavy brands with retail or recent M&A, EBITDA can be 5 to 10 percentage points higher than net (Lululemon's gap is 10.2 pp because of retail D&A and tax). For asset-light CPG with no warehouses, the gap is 1 to 3 pp (Vita Coco's is 2 pp).
what ebitda margin do investors want before buying a dtc brand?
Aggregators typically want 10%+ EBITDA on a clean trailing-twelve-month basis. Credit funds will lend against 5%+ but discount heavily. Strategic buyers and PE will pay premium multiples for sustained 15%+ EBITDA at scale. Below 5% and you are usually priced on revenue or strategic value, not EBITDA.
what ebitda multiple do ecommerce aggregators pay in 2026?
3 to 6 times EBITDA for sub-$50M EBITDA DTC is the working range we see in deal docs and what credit funds anchor on. Premium brands clearing $100M+ EBITDA with strong gross margins get 8 to 12x. The 2021 vintage of aggregator deals at 10x+ for sub-$10M EBITDA brands is gone.
why is lululemon's ebitda margin so much higher than allbirds?
Brand equity, gross margin, and SG&A discipline. Lululemon has 30 years of category dominance, 56%+ gross margin, and a vertical retail footprint that gets cheaper per dollar of revenue as it grows. Allbirds is a $152M-revenue footwear brand still buying customers and absorbing fixed overhead. Same channel mix, very different margin math.
is negative ebitda always a sell signal for a dtc brand?
One year of brand investment is fine. Three years is the Allbirds path. The DTC IPO class of 2021 (Allbirds, Honest, Brilliant Earth, BARK) is still cumulatively EBITDA-negative five years in, and that is the public signal that says structural fix is needed, not just patience. If you are private and have run three years of negative EBITDA, your buyer pool collapses to revenue multiples and strategic outcomes.