
Inventory
How to Forecast Demand Without Over-Ordering
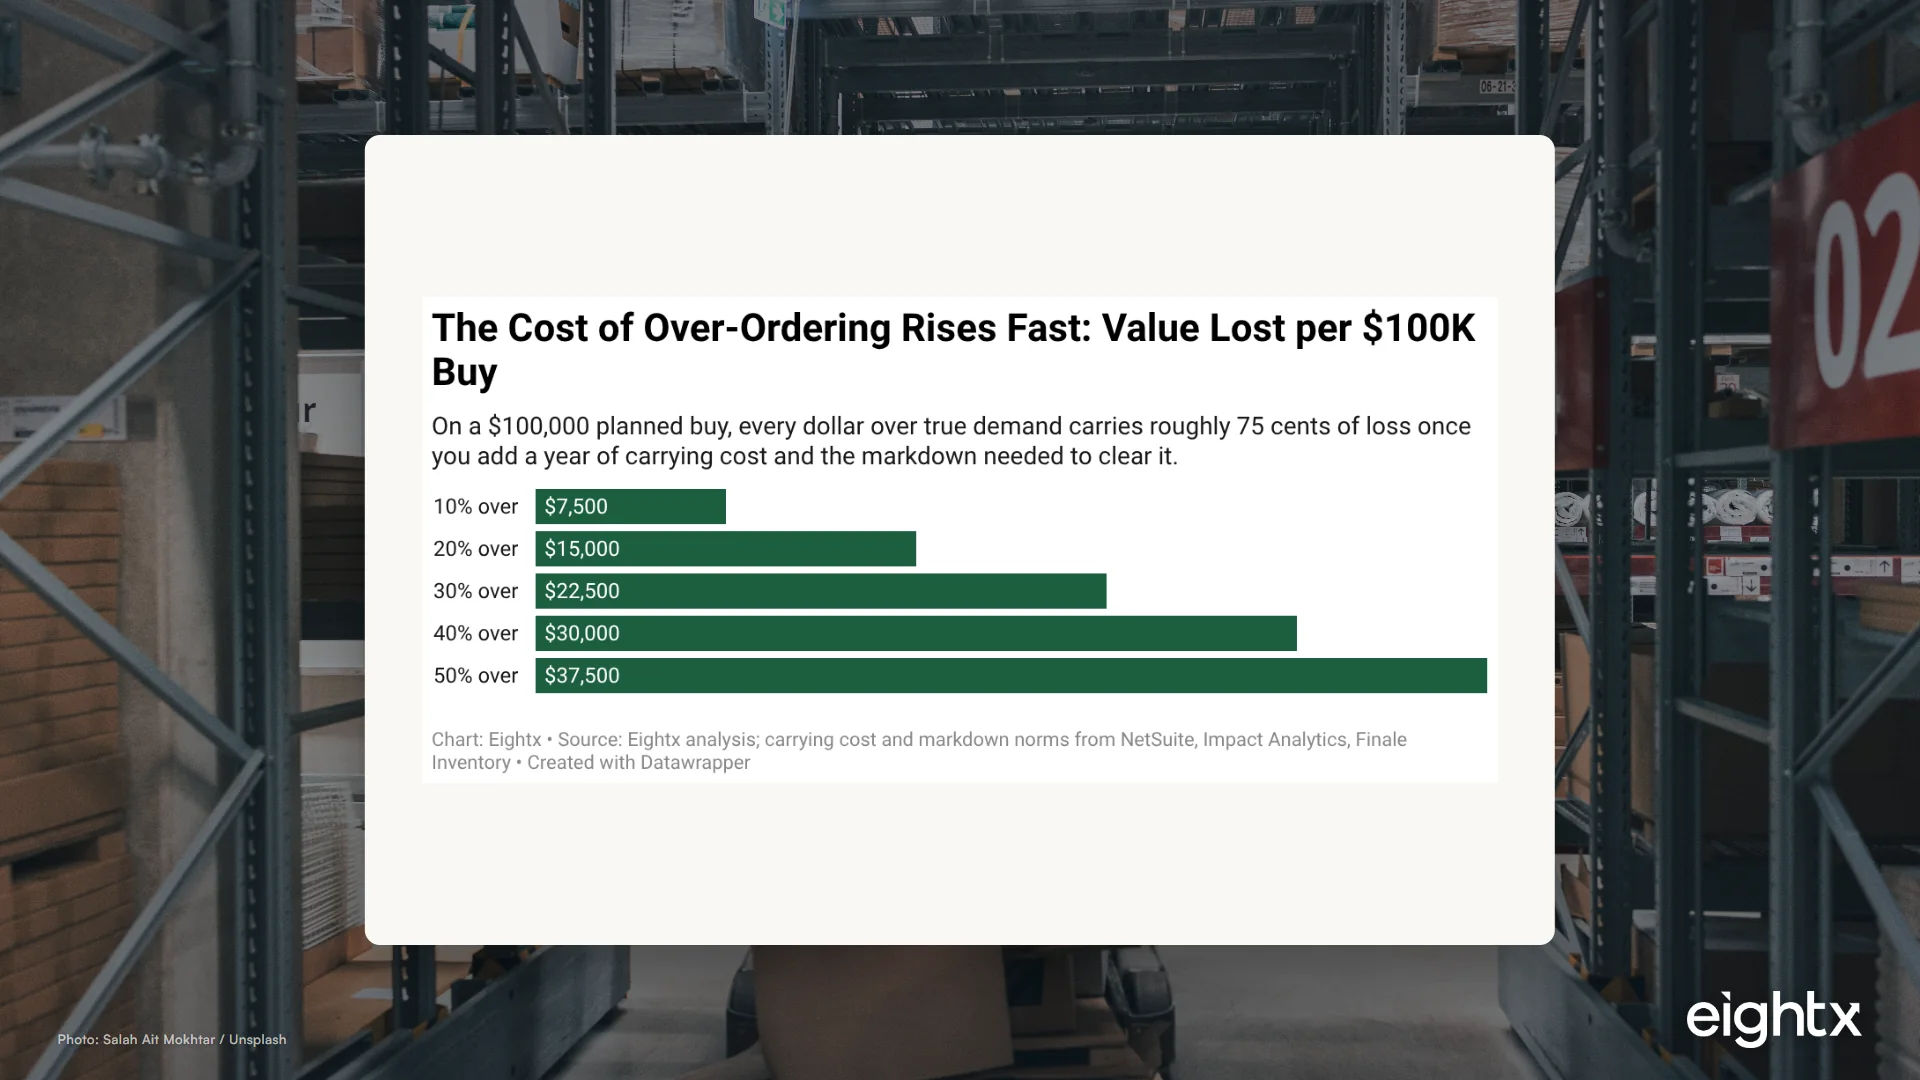
Blend base velocity, seasonality, promo lift, and lead time, then add a confidence buffer sized to your forecast error instead of a gut round-up, and cap the order at a turn target. Over-ordering is costly: every excess dollar loses roughly 75 cents once you add carrying cost plus the markdown to clear it.
Key Takeaways
- Over-ordering loses about 75 cents on the dollar: a $10,000 over-buy costs roughly $7,500 once you add carrying cost and the markdown needed to clear it.
- Build the forecast from four inputs: base velocity, seasonality, promo lift, and lead time. The gut round-up is where the cash leak starts.
- Set a confidence buffer sized to your forecast error (often 20 to 35 percent MAPE in DTC), not a flat 'add a month to be safe.'
- Tie the order quantity to a turn target so the buy is capped by how fast the SKU actually sells, not by how much the factory wants to ship.
- Inventory carrying cost runs 20 to 30 percent of inventory value per year, so excess stock bleeds cash every month it sits, not just at markdown time.
Most over-ordering does not start with bad math. It starts with a good forecast and a bad last step: the gut round-up. You build a reasonable number, then you look at it, get nervous about stocking out, and order 30 percent more "to be safe." That round-up feels free. It is not. On a $100,000 buy, every dollar you order past true demand costs you roughly 75 cents by the time the excess is carried for a year and marked down to clear.
This is the most common cash leak I see on inventory diagnostics, and it is entirely self-inflicted. When I talk to founders running a brand this size, the pattern is almost always the same: one of them was sitting on more than 200 days of stock on core SKUs, not because demand collapsed, but because two rounds of "add 30 percent to be safe" had stacked on top of a container MOQ. The forecast was fine. The last step was not. The fix is not a fancier forecasting tool. It is a disciplined four-part forecast, a buffer sized to your actual error instead of your nerves, and an order quantity capped by a turn target. Here is how to run it, and what the over-buy actually costs when you do not.
Why the over-buy is so expensive
The reason founders round up is that stocking out is visible and over-ordering is not. A stockout shows up immediately as a lost sale and an angry customer. Over-ordering just sits quietly on a shelf, and the damage only surfaces months later at markdown time. So the round-up feels like cheap insurance. The cost says otherwise.
Two numbers drive it. First, inventory carrying cost runs 20 to 30 percent of inventory value per year for DTC brands, covering 3PL storage, capital cost, insurance, shrink, and obsolescence. Second, truly excess stock does not clear at full price. It clears at a 40 to 60 percent markdown, which means you give back roughly half the value of every excess unit just to get it off the shelf. Stack a year of carrying on top of a 50 percent markdown and you lose about 75 cents on every dollar of over-order, which is why a $10,000 over-buy commonly costs about $7,500 by the time it is gone.
Scale this and it stops being a rounding error. A brand over-ordering 10 percent on a $5M annual COGS base is sitting on roughly $500,000 of excess inventory, and at 75 cents on the dollar that is $300,000 to $400,000 of value erosion. The problem is not unique to DTC. The retail analysts at IHL Group put global inventory distortion (the combined cost of overstock and stockouts) at roughly $1.7 to $2.0 trillion a year, of which overstock alone is about $554 to $758 billion. The point is not that stocking out is fine. It is that the over-buy you reach for to avoid a stockout is itself a large, quiet expense, and at scale it is one of the biggest single line items in retail.
Build the forecast from four inputs, not one gut number
A defensible demand forecast for a SKU is a blend of four things. Build each one explicitly so you can see where the number comes from and argue with it. The reason to make it auditable is not neatness. The pattern we see again and again is buying that has quietly disconnected from demand: an inventory planner ordering to a budget set at the start of the year while the real run-rate moved somewhere else, so the brand way over-purchases simply because the buyer and the growth team never compared notes. A four-input forecast that anyone can read is how you catch that drift before it becomes 200 days of stock.
- Base velocity. Start with clean, recent run-rate. We recommend moving off a 30-day sales number to a 12-week weighted average: units per week over the last 8 to 12 weeks when the SKU was in stock and not on promotion. Stockout and markdown weeks distort the signal, so strip them out. This is your spine.
- Seasonality. Apply the SKU's seasonal index. If the trailing weeks are a low season and you are buying into Q4, multiply up; if you just came off a peak, multiply down. Use last year's same-period shape, not a flat annualization of the last month. For a genuinely uncertain Q4, a sane upper bound is roughly 2x the units you did the same period last year, then size the buy conservatively from there.
- Promo lift. Layer in any planned promotions, launches, or campaigns in the coverage window, sized from what comparable promos actually lifted, not from the optimistic plan. A promo you have run before has a measured lift. Use that number. If you have not measured it, haircut the optimistic plan by half before you build it into the buy.
- Lead-time coverage. Multiply the blended weekly demand by the number of weeks you need to cover: production lead time plus transit plus your reorder interval. This is the input that quietly forces over-ordering on long-lead SKUs. When everyone is buying from China, they place an order, pay a deposit, wait six months, and have to forecast both when they will run out and how much to cover for the next six months. A short domestic lead time is a cheat code precisely because it shrinks this number, and with it the buffer.
The output is a coverage forecast: the units you genuinely expect to sell between now and the arrival of your next PO. That is the number the buffer attaches to, and it is far harder to inflate than a single gut estimate.
Set a confidence buffer, not a gut round-up
The buffer exists for one reason: your forecast will be wrong, and your lead time will sometimes slip. The mistake is sizing it to fear ("add a month") instead of to your actual error.
Most DTC brands run a forecast error of 20 to 35 percent at the SKU level (in forecasting terms, a MAPE, or mean absolute percentage error, of 20 to 35 percent, which is 65 to 80 percent accuracy). Where a SKU sits in that band is fairly predictable from how steady it is.
Stable, subscription-driven consumables forecast tighter, often 15 to 25 percent error. Fast fashion and heavily seasonal lines routinely exceed 30 percent. One caveat: MAPE is misleading for low-volume, intermittent SKUs, where a small absolute miss reads as a huge percentage error. For those, weighted MAPE (WMAPE) is the fairer metric. Either way, your buffer should reflect where your SKU actually sits:
- Noisy SKU, long and variable lead time? A larger buffer is justified. The cost of a stockout is real and the forecast is genuinely uncertain.
- Steady seller, short reliable lead time? A small buffer. A flat round-up here is pure waste, because you can reorder before you run out.
There is a second lever most founders skip: order more often. If you could pick a forecast and know you would hit it, this would be easy. Since you cannot, the most reliable way to shrink the buffer is to shorten the interval it has to cover. Moving from quarterly to monthly POs, or monthly to weekly, is a real time cost, but one founder who did this well decided to stop chasing the price break on big orders and instead bring the amount on hand down, running near-weekly orders all year to hold a low balance he could adjust as demand moved. The discipline is to set the buffer per SKU from its own variability, not to apply one comfort multiple across the catalog. The flat "add 30 percent to everything" approach over-buffers your reliable sellers and under-buffers your volatile ones, so you get the worst of both: excess cash tied up and stockouts you did not prevent.
Cap the order at a turn target
The forecast plus buffer tells you what you need. The turn target tells you what you can afford to hold. The final order quantity is the lower of the two unless you have a deliberate reason to override.
Pick a target turns number for the SKU. Healthy blended DTC turns sit at 6 to 10 a year; a fast consumable might target 12, a slower considered-purchase SKU might target 5. A clean way to decide which SKUs even deserve to be held is to rank the catalog A/B/C by volume and margin: keep the C movers on drop-ship, hold maybe eight weeks of the B's, and twelve weeks of the A's. For each SKU you do hold, convert the turn target to a unit ceiling: annual forecast demand divided by target turns gives you the average inventory you should hold, and roughly twice that is your maximum order quantity for a single buy. The 2x comes from the sawtooth: when you receive a full order and draw it down to near zero before the next one lands, your average on-hand is about half the order size, so to hold a given average you can buy about double it.
| Step | What you calculate | Worked example |
|---|---|---|
| Annual forecast demand | Base velocity x seasonality x 52 | 24,000 units |
| Target turns | Chosen for the SKU velocity | 8 turns |
| Target average inventory | Annual demand / target turns | 3,000 units |
| Order quantity ceiling | About 2x target average inventory | ~6,000 units |
When I talk to founders this size, the failure mode is almost always a hero SKU where a container MOQ got filled without ever being checked against a turn ceiling. Picture a buy that lands at roughly 3 turns a year against a 6-turn target: it leaves about $120,000 of inventory parked where $60,000 would have covered demand, and at a 25 percent carrying cost that extra $60,000 is bleeding about $15,000 a year before a single unit hits markdown. If your economic order quantity or your factory MOQ pushes the order above the ceiling, you are knowingly buying your turns down, and that is a real decision with a real carrying cost. Sometimes it is the right call (a genuine MOQ, a tariff-driven pre-buy, a container fill). But now you are pricing the extra carrying cost consciously instead of stumbling into 200 days of stock because the round-up and the MOQ quietly stacked on top of each other. That stacking is exactly how the 2022 inventory bullwhip happened: forecasts anchored on a demand surge, orders rounded up for safety, and pooled median inventory days more than doubled from 75 in FY2020 to 178 in FY2022 before brands spent years clearing it.
The over-buy is the most expensive line in your inventory plan precisely because it never appears as a line. Carrying cost drips out monthly and the markdown lands once, quietly, quarters later. Make the over-buy a conscious, priced decision instead of a default that stacks on top of an MOQ, and you turn a 75-cents-on-the-dollar leak back into cash.
If you want a fuller reference on how each SKU type tends to behave, this table pairs the realistic error bands with the accuracy they imply.
| SKU type | Typical forecast error (MAPE) | Implied accuracy |
|---|---|---|
| Subscription consumable | 15 to 25% | 75 to 85% |
| Core replenishment | 20 to 30% | 70 to 80% |
| Blended DTC catalog | 20 to 35% | 65 to 80% |
| Seasonal / fast fashion | 30%+ | under 70% |
What to do about it
- Rebuild your top 20 SKUs' forecasts from the four inputs this week. Base velocity, seasonality, promo lift, lead-time coverage. Write each component down so the number is auditable.
- Kill the flat round-up. Replace your one comfort multiple with a per-SKU buffer sized to that SKU's forecast error and lead-time reliability.
- Set a turn target per SKU and compute the order ceiling. Annual demand divided by target turns, doubled, is your single-buy max.
- Flag every PO that breaches the ceiling. When EOQ or MOQ forces you above it, write down the extra carrying cost in dollars before you sign. Make the over-buy a decision, not a default.
- Watch inventory days monthly, not quarterly. If days are climbing while revenue is flat, you are funding a forecasting mistake. Catch it early, while a small markdown still clears it.
Methodology
Carrying cost (20 to 30 percent of inventory value per year), forecast error (20 to 35 percent MAPE at SKU level), clearance markdowns (40 to 60 percent), and the roughly 75 percent value erosion on over-ordered stock are triangulated from NetSuite, Impact Analytics, Fishbowl Inventory, attn Agency, SoftServe, ToolsGroup, EasyReplenish, Yotpo, and McKinsey markdown research, cross-referenced with Eightx's own EOQ and inventory analyses. These bands are industry and vendor estimates, not peer-reviewed or government data, so treat them as ranges to calibrate against your own numbers. The global inventory-distortion figure (roughly $1.7 to $2.0 trillion a year, with overstock alone about $554 to $758 billion) is from IHL Group's "True Cost of Out-of-Stocks and Overstocks." Turnover and inventory-days benchmarks are from Eightx analysis of public 10-K filings via SEC EDGAR, in our inventory turnover by vertical and DTC inventory days trend posts; the FY2021 point is omitted from the chart to avoid an interpolated value. The cost chart and the turn-target example are illustrative models; run them on your own velocity, carrying cost, and markdown depth. For the broader framework on sizing buys and holding the right level of stock, see our ecommerce inventory management guide, and pair this with setting reorder points and preseason inventory buying.
Frequently Asked Questions
how do you forecast demand without over-ordering?
Build the forecast from four inputs: base velocity, seasonality, promo lift, and lead-time coverage. Then add a confidence buffer sized to your actual forecast error rather than a gut round-up, and cap the final order quantity at a turn target so the buy is limited by how fast the SKU sells. Over-ordering loses roughly 75 cents on the dollar once you add carrying cost and markdowns.
what does over-ordering inventory actually cost?
Roughly 75 cents per dollar of excess. Carrying cost runs 20 to 30 percent of inventory value per year, and truly excess stock usually clears at a 40 to 60 percent markdown. Combine the two and a $10,000 over-buy commonly costs about $7,500 by the time it is gone. None of it shows on the P&L until markdown time, but it ties up cash from the day it lands.
what is a realistic demand forecast accuracy for a dtc brand?
At the SKU level, most DTC brands run 20 to 35 percent forecast error (MAPE), which is 65 to 80 percent accuracy. Stable, subscription-driven consumables forecast tighter, around 15 to 25 percent error. Fast fashion and heavily seasonal lines often exceed 30 percent error. Mature systems can hit 10 to 20 percent, but treat that as the ceiling, not the expectation.
how big should my inventory safety buffer be?
Size it to demand and lead-time variability, not to fear. Set the buffer from your forecast error and your lead time: the longer and more variable the lead time, and the noisier the SKU, the larger the buffer. A flat "add a month to be safe" over-buffers your steady sellers and under-buffers your volatile ones.
how do you tie order quantity to inventory turns?
Pick a target turns number for the SKU, for example 8 turns a year, which is about 45 days of stock. Convert that to a unit ceiling by dividing annual forecast demand by target turns, then roughly double it for a single buy. If the EOQ or factory MOQ pushes you above that ceiling, you are knowingly buying down your turns, so price the extra carrying cost before you commit.
is over-ordering or stocking out worse?
Both are expensive and you want to reduce total error, not just one side. Per unit, a stockout on a fast, high-margin SKU usually costs more in lost sales and customer lifetime value than the carrying-plus-markdown cost of the same dollar of overstock. But over-ordering is more pervasive and quietly drains cash every month. The goal is a tighter forecast, not a permanent over-buy as insurance.
how much extra inventory should i order for a sale or product launch?
Size it from a measured lift, not the optimistic plan. If you have run a comparable promo or launch before, use the lift you actually saw and apply it to clean base velocity. If you have not, haircut the optimistic plan by about half before you build it into the buy. The downside of guessing high here is the same 75-cents-on-the-dollar leak as any other over-order.