
Insights
Ecommerce share of retail in 2026: UK 27.3%, US 16.9%, AU 12.7%, Canada 5.7% (and why the EU number you cite is wrong)
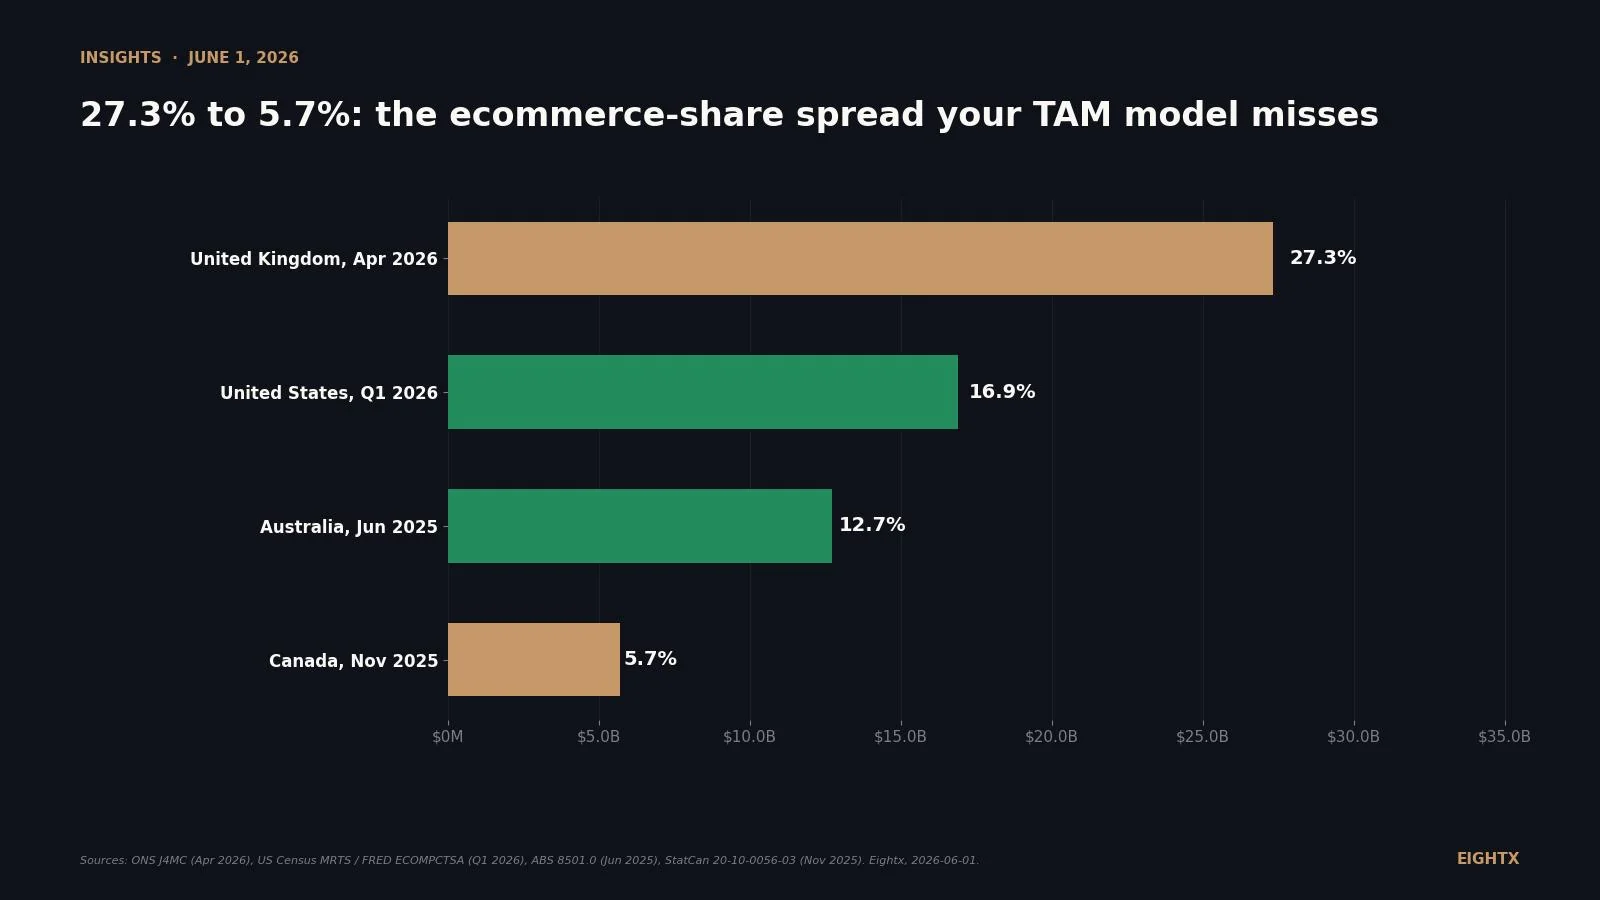
UK ecommerce runs at 27.3% of total retail (ONS J4MC, April 2026), the US at 16.9% (Census MRTS, Q1 2026), Australia at 12.7% (ABS, June 2025), and Canada at 5.7% (StatCan, November 2025), a 4.8x spread across four comparable government series. The EU does not publish a retail-share figure equivalent to these four. If you model multi-geo channel share at a single 15% assumption, you mis-size at least three of the five markets.
Key Takeaways
- The UK runs ecommerce at 27.3% of total retail (ONS J4MC, April 2026). The US sits at 16.9% (Census MRTS, Q1 2026). Australia is 12.7% (ABS 8501.0, June 2025). Canada is 5.7% (StatCan 20-10-0056-03, November 2025). The spread across four directly comparable government series is 4.8x.
- The EU does not publish what most operators think it publishes. Eurostat's tin00110 series is 19.5% but covers B2B + B2C enterprise turnover across all sectors, not retail. EuroCommerce estimates the retail-share figure at 14.8% to 18.8% depending on denominator. The single most common ecommerce-penetration citation in deck templates is methodologically broken.
- The UK has run roughly 1.5x to 2x the US for the post-2014 period, settling near 1.6x since 2017. Both series use comparable methodologies (national statistical office, share of total retail). The structural gap is sticky: higher UK retail rents per square metre, Royal Mail density, and smaller geography all favour online over store-side.
- The pandemic spike unwound differently in each market. US peaked at 16.3% in Q2 2020 then sat flat for 7 quarters before resuming the grind. UK peaked at 36.2% in Q1 2021 (the January-March 2021 lockdown) and gave back roughly 8 percentage points of that spike. Both are now well above pre-2020 baselines.
- If you model multi-geo channel share at 15% across markets, you mis-size three of the five. UK is 1.8x your assumption, Canada is one-third of it. The country-specific number belongs in your TAM build, not the US default.
Every multi-geo expansion plan we see starts with the same slide: a row of country flags, a percentage next to each, and a TAM number that gets rolled up into a board-deck addressable-market chart. The percentages are almost always wrong. Not because the founders are sloppy, but because the official series each country publishes use different methodologies, the EU does not publish what the slide says it does, and most operators default to a "15% feels right" assumption that breaks across at least three of the five markets covered here.
This page collects the latest official ecommerce share of retail figures for the US, UK, EU, Australia, and Canada from each country's primary government statistical series. We refresh it each quarter as new data lands. Below: what each country actually measures, where the numbers diverge, and the operator read for sizing a 2026 to 2027 channel-share assumption that won't blow up your unit economics.
The four-country scorecard, latest reading (and why the EU sits in its own section)
The four countries that publish directly comparable government series come out to a 4.8x spread between the highest and lowest. Headline chart first.
The UK leads at 27.3% (ONS J4MC, April 2026). The US sits at 16.9% (Census MRTS via FRED ECOMPCTSA, Q1 2026). Australia is 12.7% (ABS 8501.0, June 2025). Canada is 5.7% (StatCan 20-10-0056-03, November 2025). Each number comes from the national statistical office's monthly or quarterly retail-share series; each uses retailer-side ecommerce revenue divided by total retail trade.
We deliberately left the EU off this chart. The closest Eurostat series, tin00110, reads 19.5% but covers enterprise turnover from e-sales across all sectors (B2B and B2C, manufacturing and services), not retail. Putting it next to the four retail-only series would imply apples-to-apples comparison the data does not support. The EU has its own section below.
The reporting periods are not identical across the four. US is Q1 2026 (90-day lag). UK is April 2026 (3-week lag, monthly). Australia is June 2025 (the ABS supplementary table publishes semi-annually). Canada is November 2025 (StatCan switched table IDs in 2025 from 20-10-0072-01 to 20-10-0056-03, so the consistent series is short). Treat the snapshot as "latest available," not "synchronised quarter."
Why the UK runs 1.5x to 2x the US (and the gap is sticky)
The UK has been running ecommerce share at roughly 1.5 to 2 times the US share for the entire post-2014 window. The ratio was wider in 2014-2016 (2.0x to 2.7x in the earliest quarters, when US share was still in single digits) and has settled near 1.6x since roughly 2017. Both series use comparable methodologies. The gap is structural.
Two notes on the methodology before reading the chart. Both series are retailer-side share-of-total-retail measures from the national statistical office, but the UK ONS J4MC series excludes auto-fuel and is non-seasonally adjusted, while the US Census MRTS series is quarterly seasonally adjusted and includes auto-fuel. That is why we use the latest non-peak UK month (April 2026) and a synchronised Q1 US print for the headline comparison, and why November appears as a UK seasonal peak in the time series.
Three things drive the structural premium. First, UK retail rents per square metre rank among the highest in the world, especially in central London and the home counties. That pushes brands to build online channels earlier and lean on them harder. Second, the UK is geographically small with dense Royal Mail and parcel-network coverage. Next-day delivery is economic in places that would be uneconomic across the US interior. Third, the UK retail base is more concentrated. The top-10 grocers and the top-20 general merchandisers account for a larger slice of total retail than their US analogs, and those big chains rolled out click-and-collect and online ordering aggressively from 2010 onward.
The pandemic spike pattern is also different. The US peaked at 16.3% in Q2 2020, dropped back to 14.9% by Q3 2020, then sat in a 14.4 to 14.6% band for seven straight quarters. The UK peaked at 36.2% in Q1 2021 (the January-March 2021 lockdown), then unwound roughly 8 percentage points but stayed well above its pre-2020 ~20% baseline. Both markets retained meaningful share gains; the UK retained more.
The forward read: if you are a US-based DTC operator modelling the UK as "more digital than home," the answer is yes, by roughly 60% (27.3 / 16.9 = 1.62). If you are modelling the gap closing in a five-year horizon, the answer is no. The structural drivers (rent, geography, retail concentration) do not reverse on a five-year timeframe.
The EU does not publish what you think it does
Every operator briefing we have seen this year cites a single "EU ecommerce is X% of retail" number. The number changes by deck. We have seen 13%, 16%, 17%, 19.5%, and 77% all used as the "EU ecommerce share." All five come from a real Eurostat or industry source. None of them measure what the brand operator thinks they measure.
The three candidate Eurostat-adjacent figures:
Source Latest figure What it actually measures Eurostat tin00110 19.5% (2024) Share of EU-27 enterprises' total turnover from e-sales. Includes B2B and B2C, all sectors (manufacturing, services, retail combined). EuroCommerce European E-commerce Report 2025 ~14.8% to 18.8% (2024 est.) Industry-association estimate of B2C ecommerce share of retail, triangulated from national associations. Range depends on whether services are included in the denominator. Eurostat isoc_ec_ibuy 77% of internet users (2024) Demand-side household adoption: percentage of EU-27 internet users who bought goods or services online in the past 12 months. Not a retail-share figure at all.
The operator implication is simple: when you cite an EU ecommerce-share number, pick one of the three above, name the series, and note the denominator. The 19.5% Eurostat figure is the one that gets quoted most often, but it is also the one furthest from what a DTC operator actually wants to know (retail-only B2C share), because it includes B2B manufacturing transactions that have nothing to do with your channel-share assumption. Our soft estimate for EU-27 B2C retail-only ecommerce share is the EuroCommerce 14.8% to 18.8% range. Treat that as a range, not a point estimate.
The other thing the EU number hides: country-level dispersion inside the EU is wide. National statistical offices publish their own retail-ecommerce series with different methodologies, and they do not cluster around the EU-27 aggregate. A "the EU is X%" line in a TAM deck averages across markets that move on different trajectories. If your EU expansion plan is country-specific (most are), the EU aggregate is the wrong unit to size against. Pull the specific country's national stats office series and size against that.
One more disclosure: the EU-wide 14.8% to 18.8% range is the lowest-confidence estimate on this page. The four headline countries (US, UK, AU, Canada) each have a single national statistical office series with a defined methodology. The EU range is triangulated across Eurostat tin00110, EuroCommerce industry data, and methodological adjustments to back out B2B and services. Treat the four government series as point estimates with stated lag; treat the EU range as a range, and weight it lower in any model.
Australia and Canada: the two non-headline markets
Australia at 12.7% and Canada at 5.7% are the two non-headline countries in the four-country set. Both publish their data through their national statistical office. Australia is growing year-over-year on the ABS series; Canada is flat to slightly down on the new StatCan series.
Australia sits at 12.7% in June 2025, up from 11.6% in June 2024 on the same ABS 8501.0 series, a +1.1 percentage point year-over-year gain. The ABS supplementary table now publishes the online-share figure semi-annually with the June and December releases. A separate measure, the NAB Online Retail Sales Index, reads 14.9% over the 12 months to September 2025. The gap between ABS and NAB is the denominator: NAB uses the ABS Monthly Household Spending Indicator for retail trade (series 5682), which is broader than the ABS 8501.0 retailer-side number. Both are valid; the question is what you want to size.
Canada sits at 5.7% in November 2025, down from 6.0% in October on the same StatCan 20-10-0056-03 series. The November 2025 figure was 4.0 billion in ecommerce sales against 70.4 billion in total retail trade. The series itself is short and noisy because StatCan retired Table 20-10-0072-01 in 2025 and rebuilt the series under 20-10-0056-03; historical comparisons need careful splicing and we do not back-fit a pre-2025 baseline here. The structural drag on Canadian ecommerce share is real: a population spread thinly across a continent-sized geography pushes last-mile cost up and limits next-day-delivery viability. The methodological drag is also real: the StatCan series captures only Canada-domiciled retailer ecommerce, so cross-border purchases Canadians make from US-based sellers do not count toward the share.
The practical read for operators sizing an Australia or Canada expansion: if you assume "ecommerce is roughly 15% everywhere," you over-size both. Australia is meaningfully lower than the US on the official measure; Canada is one-third of the US. The Canada number in particular should be modelled as a soft 6 to 9% range depending on whether your business shows up in StatCan's retailer-side count or in the cross-border consumer channel.
What this means if you are planning a 2026 to 2027 expansion
The arithmetic is straightforward; the inputs are what most decks get wrong. Per-country multiplier vs the US baseline:
Country Ecommerce share Multiplier vs US baseline (16.9%) Multiplier vs a default 15% assumption United Kingdom 27.3% 1.62x 1.82x EU-27 (B2C est.) 14.8% to 18.8% 0.88x to 1.11x 0.99x to 1.25x United States 16.9% 1.00x 1.13x Australia 12.7% 0.75x 0.85x Canada 5.7% 0.34x 0.38x
A DTC brand modelling channel share at 15% across markets will under-size the UK opportunity by 1.8x and over-size the Canada opportunity by 2.6x. We see this in client TAM models routinely. The fix is to drop the single-percentage default and plug country-specific figures into a single column of your model.
Three operator decisions follow from this data:
Sequence UK first if you are a US DTC brand. The UK has the biggest ecommerce share among the non-US English-speaking markets and the biggest addressable online retail base in absolute terms (27.3% of a ~£450B total retail base), the same language (no localisation cost), and a Royal Mail / parcel infrastructure that supports next-day delivery economics. The structural read favours UK over AU or CA on addressable-online-retail size. The category-specific read can flip this (some verticals face heavier UK regulatory load, for example supplements under FSA / MHRA rules); confirm category fit before locking sequence.
Treat the EU as a stack of countries, not an aggregate. The 14.8% to 18.8% EU-wide range averages across markets with very different digital-retail maturity. Pick your three to five priority EU countries, pull each one's national statistical office retail-ecommerce series, and size each independently. The EU aggregate is the wrong unit for an expansion plan that ships into specific countries.
Build the Canada model around a soft 6 to 9% range. The 5.7% StatCan number is the floor (Canada-domiciled retailer ecommerce only). Total Canadian consumer online spend, including cross-border purchases from US sellers, runs meaningfully higher. If you are a US brand shipping to Canadian addresses, your addressable channel sits above the StatCan headline number. Build to the range, disclose the assumption in the model, and stress-test against both endpoints.
The "ecommerce is 15% of retail everywhere" assumption is the single most common TAM-modelling error we see in expansion decks. The actual range across the five markets covered here is 5.7% to 27.3%, a factor of 4.8x. Plug the country-specific number into your model and you will size three of the five differently before you fund the launch.
What we are watching next
The next round of releases lands across June through August 2026. US Census MRTS publishes Q2 2026 in mid-August (we expect 17.0 to 17.2%). UK ONS J4MC publishes May and June 2026 monthly in late June and late July (we expect 26 to 28%, non-peak months). ABS 8501.0 June 2026 lands in late July. Statistics Canada Table 20-10-0056-03 updates monthly with a six-week lag. We will refresh this page after the Q2 US release and the ABS June 2026 print, targeting an October 2026 refresh.
If you want the methodology stress-test on your specific category and geography, the interim CFO services overview is where to start. For the AU-specific view that triangulates ABS, Australia Post, and NAB, see our AU online retail share post. For the US category-level breakdown (where the 16.9% headline hides nonstore retailers at 70% and food at 3%), see our ecommerce penetration by category post.
Sources and methodology
US Census Bureau, Monthly Retail Trade Survey (Quarterly E-Commerce Sales Report). The headline US series is FRED ECOMPCTSA, "E-Commerce Retail Sales as a Percent of Total Sales," seasonally adjusted, quarterly. Source is the US Census Bureau's quarterly retail e-commerce release. We pulled the full series Q1 2014 through Q1 2026 (49 quarterly observations). Latest value: 16.9% (Q1 2026, released mid-May 2026).
Office for National Statistics (UK), Retail Sales Index series J4MC. "Internet sales as a percentage of total retail sales (ratio)," monthly. Pulled January 2018 through April 2026 (100 monthly observations). Latest non-peak value: 27.3% (April 2026). Note the seasonal pattern: November is always the highest month (Black Friday volume); we use the latest non-peak month for cross-country comparison.
Australian Bureau of Statistics, Retail Trade Australia (catalogue 8501.0). The supplementary table "Online sales as a proportion of total retail turnover" publishes semi-annually with the June and December retail trade releases. Latest value: 12.7% (June 2025, original terms, not seasonally adjusted). Up from 11.6% in June 2024.
NAB Online Retail Sales Index, September 2025 release. Auxiliary AU figure of 14.9% over the 12 months to September 2025. NAB uses the ABS Monthly Household Spending Indicator (series 5682) for retail trade as the denominator, which is broader than the ABS 8501.0 retailer-side denominator. Both figures are valid; they answer different questions.
Statistics Canada Table 20-10-0056-03, Monthly retail trade e-commerce sales. Replaces the now-inactive Table 20-10-0072-01. Pulled the most recent six months of data; latest value: 5.7% (November 2025, seasonally adjusted), against 4.0 billion in ecommerce sales on 70.4 billion in total retail trade. Note that historical splicing from 20-10-0072-01 to 20-10-0056-03 introduces methodological breaks; we use the 20-10-0056-03 series as published without back-fitting.
Eurostat tin00110 and isoc_ec_ibuy. Annual EU-27 figures. tin00110 measures enterprise-side e-sales share of total enterprise turnover (19.5% in 2024); isoc_ec_ibuy measures the percentage of internet users who bought online in the past 12 months (77% in 2024). Neither directly answers the "retail-share" question, which is why we triangulate the EU figure to the 14.8% to 18.8% EuroCommerce range.
EuroCommerce European E-commerce Report 2025. Industry-association estimate of EU-27 B2C ecommerce turnover at 660 billion EUR in 2024, +8% YoY. The implied retail share is roughly 14.8% to 18.8% depending on which denominator is used for total EU-27 retail. We cite this as a soft range rather than a point estimate because the methodology differs from the four government series above.
Limitations. Reporting periods are not synchronised across the four primary series (US Q1 2026, UK April 2026, AU June 2025, Canada November 2025). The UK ONS J4MC series excludes auto-fuel and is non-seasonally adjusted; the US Census MRTS series includes auto-fuel and is seasonally adjusted, which is why we use latest non-peak UK months for cross-country comparison. The EU has no directly comparable retail-share figure; the 14.8% to 18.8% range we use is a triangulated EuroCommerce estimate. The AU and Canada figures are not seasonally adjusted with the same methodology as the US series. Use the country-specific number as your point estimate and the range as the stress test, not the other way around.
Refresh cadence. This page refreshes quarterly. Next scheduled refresh: October 2026, after the Q2 2026 US Census release and the ABS June 2026 retail trade print.
Frequently asked questions
what percent of us retail is ecommerce in 2026?
16.9% in Q1 2026, seasonally adjusted (US Census Monthly Retail Trade Survey, published in the FRED series ECOMPCTSA). That is up from 16.0% in Q1 2025, a gain of 0.9 percentage points year-over-year. The series resumed its upward grind in 2023 after sitting flat in a 14.4 to 14.6% band for seven quarters post-pandemic.
what percent of uk retail is online in 2026?
27.3% in April 2026 (ONS series J4MC, internet sales as a percentage of total retail sales). The UK number swings seasonally and hit 32.4% in November 2025 because of Black Friday volume. Use the latest non-peak month for cross-country comparison, not the November print.
why is uk ecommerce share so much higher than the us?
Two structural reasons. First, UK retail rents per square metre are among the highest in the world, which pushes brands to invest in online channels earlier and harder. Second, the UK is geographically small with dense Royal Mail and parcel-network coverage, so next-day delivery economics work in places that would be uneconomic in the US interior. The gap has run roughly 1.5x to 2x across the post-2014 window (wider in 2014-2016 when US share was still in single digits) and has settled near 1.6x since roughly 2017.
what is canada's ecommerce share of retail and why is it so low?
5.7% as of November 2025 (Statistics Canada Table 20-10-0056-03, the replacement for the now-inactive Table 20-10-0072-01). Three reasons drive the low number: lower population density outside the major metros pushes last-mile cost higher, retailer-side reporting excludes purchases Canadians make from US-domiciled ecommerce sellers, and the methodology counts only domestic-retailer ecommerce sales rather than total household online spend. The 5.7% figure is the floor for Canada-domiciled retail, not the ceiling for Canadian consumer ecommerce behaviour.
does the eu publish an ecommerce share of retail like the us census does?
No, not directly. The closest official series is Eurostat tin00110 at 19.5% for 2024, but that measures enterprise turnover from e-sales across all sectors (B2B and B2C, manufacturing and services), not retail only. EuroCommerce triangulates the retail-share figure at roughly 14.8% to 18.8% depending on which denominator you use. Any deck slide that quotes a single "EU ecommerce is X% of retail" number is comparing apples to a different fruit.
if i'm a us dtc brand expanding into the uk, what channel share should i model?
Model channel share at the country-specific number, not the US default. For the UK that means roughly 27 to 29% of your category's total retail goes online versus 16 to 17% in the US. The practical read: a US brand pulling 60% of revenue from DTC and 40% from wholesale in the US should expect a UK launch to skew even more DTC-heavy because the addressable online retail base is structurally bigger relative to total retail. Size the wholesale channel down and the direct channel up.
is the us ecommerce share still growing or has it plateaued?
Still growing, just slower than the 2014 to 2019 trend line suggested. The post-pandemic period saw seven quarters of essentially flat share (14.4 to 14.6%) while the wholesale and store-side recovered. From 2023 onward the upward grind resumed at roughly 0.7 to 1.0 percentage points per year. At that pace the US crosses 20% around 2029 to 2031.
what is the current ecommerce share in australia and is the abs figure the right one to use?
12.7% in June 2025 (ABS catalogue 8501.0, original terms). That is the official retailer-side figure and the right one to use for retail-share TAM sizing. A separate measure, the NAB Online Retail Sales Index, reads 14.9% over the 12 months to September 2025 using a broader household-spending denominator. Both are valid, but they answer different questions: ABS tells you how much of Australian retailer revenue is online; NAB tells you how much of Australian household retail spending happens online including offshore sellers. Pick the one that matches your modelling question.