
Insights
Euro-area energy prices vs DTC margins: HICP Energy back to 110 in April 2026
Euro-area HICP Energy hit 110.24 in April 2026, up 11.6% from the December 2025 trough in four months and within 7 points of the October 2022 crisis peak. Gas is the driver, not electricity. The HICP Electricity series sits flat at 98.16 while the combined basket climbs to 102.28. Candiani Denim reports energy at 30% of factory cost and bills 3.5 times 2021 levels, pointing to 2 to 6 gross-margin points of compression on EU-sourced hero SKUs.
Key Takeaways
- Euro-area HICP Energy hit 110.24 in April 2026 (Eurostat, Index 2025=100), the highest reading since the post-2022 plateau and within 7 points of the October 2022 crisis peak of 117.75. That is a +11.6% rise off the December 2025 trough in just four months.
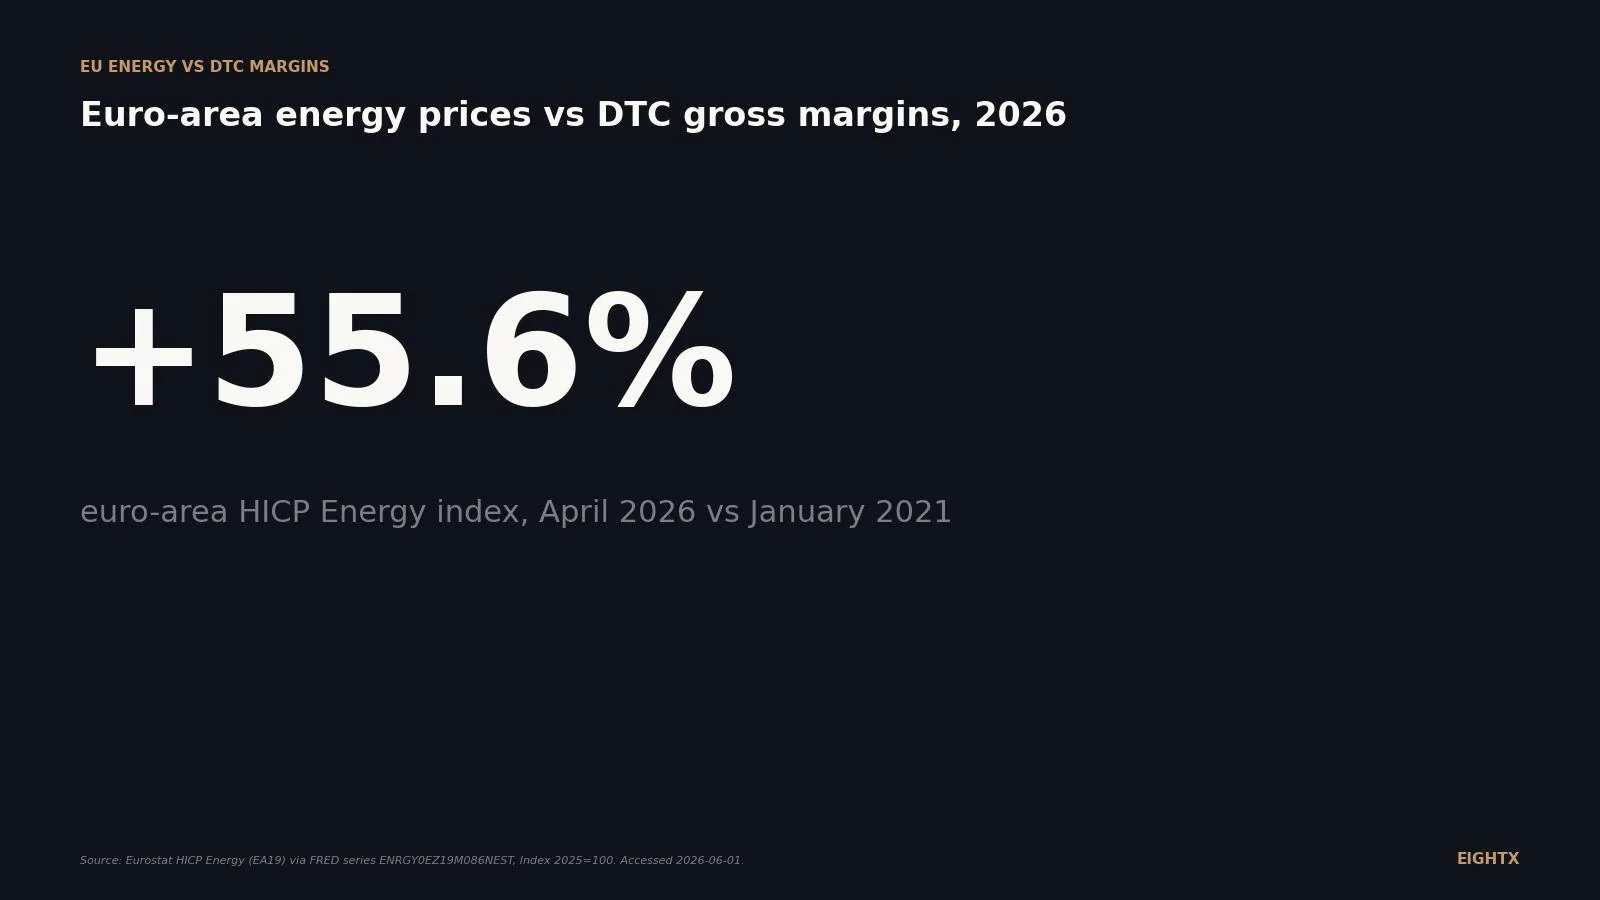
- April 2026 is +55.6% above the January 2021 baseline of 70.87. EU households and industrial users are paying roughly 1.56 times what they paid pre-energy-crisis for energy in nominal index terms.
- Industrial energy PPI in the euro area swung from -7.7% YoY in December 2025 to +4.2% YoY in March 2026, with a single-month +11.1% MoM jump. That is the producer-side signal your EU supplier's next invoice will reflect.
- Gas is the marginal mover, not electricity. The HICP Electricity-only series sits roughly flat at 98.16, while the combined Electricity + Gas + Other Fuels series climbs to 102.28. Suppliers with heavy gas exposure (ceramics, glass, denim finishing) get hit first.
- Candiani Denim reports energy at 30% of factory cost vs less than 10% pre-2022, with bills 3.5 times 2021 levels and a 40% wholesale price increase passed to brand customers. Plan for 2 to 6 points of gross-margin compression on EU-sourced hero SKUs unless you reprice.
If your DTC brand sources from Italy, Germany, France or Portugal, your supplier's energy bill just turned the wrong way again. After two years of grinding lower, euro-area energy prices reversed in Q1 2026. The Eurostat HICP Energy index for the EA19 hit 110.24 in April 2026 (Index 2025=100), up from a December 2025 trough of 98.74. That is +11.6% in four months and the highest reading since the post-Russia-invasion plateau. For brands holding 60 to 70% gross margin on EU-made hero SKUs, this is the lead indicator for the next round of factory price increase letters.
What the latest Eurostat data shows
The headline number is straightforward. HICP Energy for the euro area (EA19) climbed from 70.87 in January 2021 to a peak of 117.75 in October 2022, drifted back down to 98.74 by December 2025, then re-accelerated to 110.24 by April 2026. That is +55.6% above the January 2021 baseline and within 7 points of the 2022 crisis peak.
The re-acceleration is not a one-month blip. The index moved 99.53 in January 2026, 100.11 in February, 107.12 in March, and 110.24 in April. Four consecutive months in one direction, with the pace accelerating through March. That trajectory matches the producer-side data: euro-area industrial energy PPI swung from -7.7% YoY in December 2025 to +4.2% YoY in March 2026, with a single-month +11.1% MoM jump. When consumer and producer indices move together for four months, that is a real cost shift, not a noise band.
The per-month detail behind the chart is below.
Month HICP Energy index (EA19) vs Jan 2021 Jan 2021 70.87 baseline Jan 2022 91.27 +28.8% Oct 2022 (peak) 117.75 +66.2% Jan 2023 108.54 +53.2% Jan 2024 101.85 +43.7% Jan 2025 103.73 +46.4% Dec 2025 (trough) 98.74 +39.3% Feb 2026 100.11 +41.3% Mar 2026 107.12 +51.2% Apr 2026 (latest) 110.24 +55.6%
Why energy is back: gas, not electricity, is the marginal mover
Splitting the basket matters. The HICP Electricity-only series (EA20) sits at 98.16 in April 2026, essentially flat over the last 18 months. The combined Electricity + Gas + Other Fuels series (EA19) climbs to 102.28 over the same window. That divergence tells you the entire move is on the gas-and-heating side, not the kilowatt side.
The driver is Dutch TTF natural gas, which sat around 47 EUR per MWh in late May 2026, up roughly 39% year-on-year. TTF is the European wholesale gas benchmark and it filters into HICP with a one- to three-month lag through household gas tariffs, industrial gas contracts, and the gas-fired marginal power generation that still sets EU wholesale electricity prices in much of the year. When TTF moves, your supplier's next quarterly contract reset moves with it.
For your supplier portfolio this matters because process heat matters more than electricity in three categories: denim and textile finishing (steam-heavy dyeing and washing), ceramics and glassware (kiln firing), and beauty filling lines that run sterilisation cycles. A supplier whose energy bill is 70% gas and 30% electricity is getting hit twice as hard right now as a supplier whose mix is reversed.
What this does to your EU factory's cost base
The clearest public number on EU factory energy exposure comes from Candiani Denim, the Italian denim mill that supplies premium DTC brands across Europe and North America. Candiani's CEO Alberto Candiani has stated publicly that energy was less than 10% of factory cost pre-2022 and rose to roughly 30% by 2024, with energy bills 3.5 times 2021 levels. Candiani has passed a 40% wholesale price increase to brand customers since 2022 in response.
That trajectory is not unique to denim. EURATEX (the EU textile and apparel federation) reports that energy share of variable cost rose from 5% to 20-25% peak for textile finishing and dye houses, and ceramics and glassware producers hit 30 to 35% energy share at peak. Light apparel cut-and-sew operations (which mostly burn electricity for sewing machines and lighting) barely moved, sitting at 3 to 5%.
For DTC operators, this is the rule of thumb: the more heat, water and processing your EU supplier's factory needs to make your product, the more your next supplier price letter will hurt. A natural-fiber denim brand sourcing from Italy is more exposed than a Lisbon cut-and-sew shop assembling cotton tees. A Portuguese ceramic tableware supplier is more exposed than a French perfume filler running a low-temperature line.
The DTC margin math
Walk through one worked example. You sell a Made in Italy hero SKU at 120 EUR retail with a 50 EUR landed COGS, for a 58% gross margin (70 EUR contribution per unit). Your Italian supplier sends you a letter saying their energy costs are up 11% year-on-year and they need to pass through a 12% wholesale price increase. Your landed COGS goes from 50 to 56 EUR.
If you hold the 120 EUR retail price, your contribution drops from 70 to 64 EUR and your gross margin compresses from 58.3% to 53.3%, a 5 point hit. If you reprice 6% (120 to 127 EUR), contribution returns to 71 EUR and gross margin recovers to 55.9%. You absorb 2.4 points of margin and protect the gross profit dollar. The decision is whether that 6% retail price move costs you more in volume than the 2.4 points of margin protect in dollars.
Pricing actions are widespread across the EU DTC peer set right now, with most hero SKU repricing in the 5 to 12% band. If your hero SKU pricing is more than 18 months stale, you are likely absorbing energy pass-through your peers have already passed on.
Operator playbook for Q3 2026
Five moves to run this quarter.
Get supplier energy cost transparency in writing. Ask your top three EU factories to share what percent of their factory cost base is energy today, what percent it was in 2021, and what their next contract reset is priced at. If they will not share, that is a signal. The suppliers who are confident in their cost structure will share; the ones who are scrambling will not.
Reprice your energy-heavy EU hero SKUs. Not your whole catalog. Identify the SKUs where (a) the factory process is gas-heavy, (b) the brand story is Made in Europe (so you have pricing power), and (c) the SKU is not in heavy promotional discounting. Reprice 4 to 8% in Q3 2026 before the Q4 contract reset wave hits.
Push for PPAs or fixed-price energy contracts at your key factories. If you have a strategic supplier relationship (three or more years, mid-to-high volume), you can co-fund or co-negotiate a power purchase agreement (PPA) that fixes their energy cost for two to three years. This locks your supplier's energy line and your COGS. Mostly viable at suppliers doing 50M EUR+ revenue. Worth asking.
Rebalance the sourcing portfolio at the SKU level. Run a two-column analysis: SKUs where Made in Italy/Portugal is the brand vs SKUs where the customer does not see the country label. The first column stays in Europe regardless of energy. The second column gets a Turkey or Morocco quote this quarter. You will not move all of column two, but you will move some, and the option value of having quotes alone strengthens your EU supplier negotiation.
Shift the internal metric from gross margin percent to gross profit dollar. In an energy-volatile environment, defending gross margin percentage forces you to overprice and lose volume. Defending gross profit dollar lets you absorb a couple of points to protect demand. Make sure your CFO conversations, your monthly P&L reviews, and your team's bonus structure are all aligned on the dollar metric for the next four quarters.
Euro-area energy is not back at crisis levels. But it has reversed direction, and it has done so on the gas side where your EU factory is most exposed. The window to reprice hero SKUs and renegotiate sourcing is open right now. It closes when the Q4 contract reset letters hit your inbox in October.
What we're watching next
The next Eurostat HICP release covering May 2026 lands in mid-June. We are watching for whether the +11.1% March PPI energy print sustains into April (which would confirm the re-acceleration is broad-based) or moderates (which would signal a one-month gas-driven spike).
On the corporate side, the Q2 2026 European earnings season runs through August. We will track named brand commentary on EU supplier energy pass-through in apparel, beauty packaging, and home-goods earnings calls.
For more on how supplier cost pressure interacts with DTC unit economics, see our fractional CFO services overview and the DTC gross-margin benchmarks by vertical.
Sources and methodology
Eurostat HICP via FRED. Primary series pulled: ENRGY0EZ19M086NEST (HICP Energy, EA19, monthly, Index 2025=100, NSA) covering January 2021 through April 2026 inclusive, 64 observations. Companion series CP0451MI15EA20M086NEST (HICP Electricity, EA20) and CP0450EZ19M086NEST (HICP Electricity, Gas and Other Fuels, EA19) cover January 2024 through April 2026 for the divergence chart. All series last updated by Eurostat on 2026-05-20. Index base period rebased to 2025=100 in line with Eurostat's current methodology.
Eurostat industrial producer price releases. Two euro-indicator news releases sourced for PPI energy figures: release 4-06052026-AP "Industrial producer prices up by 3.4% in the euro area" (March 2026 data, source for +11.1% MoM and +4.2% YoY energy PPI) and ddn-20260212-2 "Producer prices for energy decline gradually in 2025" (source for December 2025 -7.7% YoY and the cumulative January 2021 to December 2025 +66.3% energy PPI calculation). The native PPI dataset family is sts_inppd_m on the Eurostat API; values quoted here match the press release headline figures.
Brand-level energy share figures. Candiani Denim's 30% energy share of factory cost and 3.5 times 2021 bill level are taken from public statements by CEO Alberto Candiani reported by Business of Fashion and Supply Chain Brain. The EURATEX figures for textile finishing and dye houses come from EURATEX sector reports through 2025. The category ranges for ceramics, beauty filling and light apparel are indicative cross-supplier ranges sourced from EURATEX and Supply Chain Brain, not a single dataset.
Dutch TTF natural gas reference. The 47 EUR per MWh and +39% YoY figures for late May 2026 are from Trading Economics commodity dashboards. No FRED equivalent series exists for Dutch TTF spot.
Limitations. HICP Energy is rebased to Index 2025=100, so all "% versus 2021" calculations in this post anchor to January 2021 = 70.87 and compute deltas from that point. This is methodologically distinct from the Eurostat industrial PPI series, which uses 2021 as its base period; the +66.3% figure for 2021-2025 PPI cumulative is a clean apples-to-apples cumulative from the PPI base. The 2 to 6 point DTC gross-margin compression range is derived from supplier pass-through math (12% wholesale increase, no retail repricing scenario), not a surveyed actual. Treat it as a planning range, not a measurement.
Update cadence. This tracker is refreshed quarterly when each Eurostat HICP and industrial PPI release lands. Next update target: September 2026 (covering July 2026 data). If a single monthly release shows a +5% or larger month-on-month move in headline HICP Energy, we update sooner.
Frequently asked questions
how much are euro-area energy prices up in 2026 vs 2021?
The Eurostat HICP Energy index for the euro area sits at 110.24 in April 2026 versus 70.87 in January 2021, a +55.6% nominal rise. That is the broadest energy basket (electricity, gas, fuels, heating) for euro-area consumers and is the cleanest single number for benchmarking your EU supplier energy pass-through.
is the 2026 spike a new crisis or a temporary blip?
Not a new crisis, but not a blip either. The April 2026 reading is still 7 points below the October 2022 peak of 117.75, so it is not a Russia-invasion-style shock. But the producer-side data (+11.1% month-on-month in March) shows it is broad-based at the factory gate, not a one-month spot price wobble. Plan for elevated EU energy costs through at least Q3 2026.
why are EU industrial electricity prices still so high vs the US in 2026?
EU industrial electricity averaged 0.199 EUR per kWh in 2024, which at the 2024 average FX rate of roughly 1.08 USD per EUR is about 0.215 USD per kWh, versus roughly 0.07 to 0.10 USD per kWh in the US. On a common-currency basis that is a 2 to 3 times structural premium that has not closed. Reasons: EU power mix is more gas-dependent, carbon pricing is higher (ETS), and the post-Russia LNG import bill is now baked into the wholesale market. Even with the 2024-2025 cooling, the gap is bigger than it was in 2019.
how much of a typical EU clothing factory's cost base is energy in 2026?
It depends on the process. Candiani Denim (Italian denim mill) reports energy at 30% of factory cost in 2024 versus less than 10% pre-2022. EU textile finishing and dye houses sit around 20 to 25%. Ceramics and glassware can hit 30 to 35%. Light apparel cut-and-sew (low energy intensity) is still 3 to 5%. Ask your supplier directly; the spread is too wide to assume.
should I move production from Italy or Portugal to Turkey because of energy costs?
Not as a default. Energy is one cost line; logistics, MOQ flexibility, brand story, and tariff exposure are the others. Turkey and Morocco have a 2 to 3 times energy cost advantage on industrial electricity but you pay it back in longer lead times and weaker EU sustainability claims. Run the math per SKU. For hero SKUs where Made in Italy is the brand, stay. For volume basics where the customer does not see the label, the Turkey/Morocco math may now work.
how much should I raise prices to offset EU supplier energy pass-through?
If your supplier passes through a 10 to 15% factory price increase (typical for energy-heavy categories in 2026), holding gross margin percentage means roughly a 6 to 10% retail price increase. Holding gross profit dollars requires less. We usually recommend protecting dollars, not percent, on hero SKUs in volatile cost environments. Reprice 4 to 6%, absorb 1 to 2 points of margin, and protect the price ladder.
what's the dutch ttf doing and why does it matter?
Dutch TTF is the European natural gas benchmark and sat around 47 EUR per MWh in late May 2026, +39% YoY. It matters because EU power prices, ceramics-glass-textile factory heating, and the gas component of HICP all track TTF with a 1 to 3 month lag. When TTF moves up, your gas-heavy EU supplier's next invoice moves up six to twelve weeks later.
how often will this page be updated?
Quarterly. Eurostat publishes HICP monthly with a roughly two-week lag, so we refresh this tracker on the back of each March, June, September and December release. If a single release shows a +5% or larger month-on-month move in the headline HICP Energy index, we update sooner.