
Fundraising
How to Build a Fundraising Financial Model That Survives Diligence (2026)
A fundraising financial model investors trust is driver-based and three-statement: revenue built from units, AOV and repeat rate, costs from CAC and cost per order, all flowing into P&L, balance sheet and cash. It shows unit economics, cohort retention, a milestone-mapped use of funds, and base, upside and downside scenarios.
Key Takeaways
- Build driver-based, not percent-of-revenue: revenue comes from units times AOV times repeat rate so an investor can change one input and watch the whole model respond.
- Anchor the raise on the DTC-adjusted curve. A clean 2026 Series A for a $5M to $20M DTC brand is a $10M to $15M check at $40M to $60M post-money, not the $19.6M all-sector median.
- Model 18 to 24 months of runway with a milestone-mapped use of funds. Only about 20% of DTC seed cohorts (2022 vintage) graduate to a Series A inside two years.
- Show cohort retention and contribution margin after CAC. Diligence dies on a model that cannot prove the next dollar of growth pays back.
- Run base, upside and downside cases off shared drivers. If the downside breaks the company, the round is too small or the plan is too aggressive.
Most fundraising models I see from founders are a hockey-stick revenue line with costs pegged as a percent of it. They look impressive in a deck and they die in the first diligence call, because the investor's first move is to change one assumption and watch the whole thing fall apart. A percent-of-revenue model cannot survive that.
The model that survives is boring in the best way: driver-based, three-statement, internally consistent, and honest about the downside. It does not promise a bigger number than the market will fund. It shows the investor exactly how a dollar of capital turns into a unit sold, a customer retained, and cash on the balance sheet. Here is how to build one for a DTC or CPG raise in 2026.
Start with the right structure: driver-based and three-statement
Investors expect a driver-based model linked to all three financial statements. That means revenue is not a guess. It is built from inputs: units times average order value times repeat rate. Marketing is paid spend you control, an input, not a percent of revenue that magically appears. Fulfillment is orders times cost per order. Payroll is headcount times cost per hire.
Then those operating drivers flow into a P&L, a balance sheet, and a cash flow statement that reconcile with each other. The cash statement is the one investors live in, because it answers the only question that funds the round: when do you run out of money, and what have you accomplished before then. If you have never built the cash layer, our 13-week cash flow forecasting guide is the foundation it sits on.
When we build these for brands heading into a raise, we run them five years out, by month, with the P&L, cash flow, and balance sheet all linked. The three-statement build is more work, but it catches errors faster: if the balance sheet goes out of whack, we know something is wrong with the forecast before an investor finds it. A model that only has a P&L can hide a broken assumption for months. A linked one cannot.
The payoff of building it this way is testability. When a partner asks what happens if CAC rises 20% or AOV grows five dollars, you change one cell and the entire model responds in front of them. That moment is what separates a model that earns a term sheet from one that gets a polite pass.
Get the unit economics and cohort retention right
Before an investor cares about your Year 3 revenue, they want to know whether the next dollar of growth pays for itself. That is unit economics: gross margin, CAC, contribution margin after CAC, and payback period. For a 2026 DTC Series A, the bar is concrete. Most consumer investors want gross margin at or above 60% (70% to 85% in beauty), an LTV to CAC ratio of at least 3 to 1, and CAC payback inside 12 months on a contribution-margin basis, with the term-sheet winners landing payback in 3 to 9 months, per the 2026 funding benchmarks and consumer-fund metric guides. One note on definitions: a first-purchase payback of 9 to 12 months can be fine, but make clear in the model whether each payback number is first-purchase or contribution-margin, because investors increasingly index on the latter. Brands that clear these bars get the upper half of the valuation range. Brands relying on paid-social arbitrage alone take the bottom or go home.
| Metric | Fundable floor | Strong, wins term sheets |
|---|---|---|
| Gross margin | 60% | 70%+ (80% to 85% beauty) |
| LTV to CAC | 3 to 1 | 5 to 1 |
| CAC payback (contribution-margin) | within 12 months | 3 to 9 months |
| Contribution margin | positive | 20%+ at scale |
| Runway raised per round | 18 to 24 months | 24 to 30 months |
Cohort retention is the other half. A revenue line that grows only because you keep buying new customers is a leaky bucket an investor will spot immediately. The way we show this to founders is a cohort multiplier: every cohort starts at one in its first month, so a cohort that bought $10,000 in April is a multiplier of one, and you then track the cumulative revenue that same cohort produces over its lifetime. When that multiplier climbs past two and three over the following year, the model is proving that growth compounds instead of churning out the back. This is the single most common thing missing from founder models, and it is the thing diligence probes hardest.
Size the raise against the DTC curve, not the headline
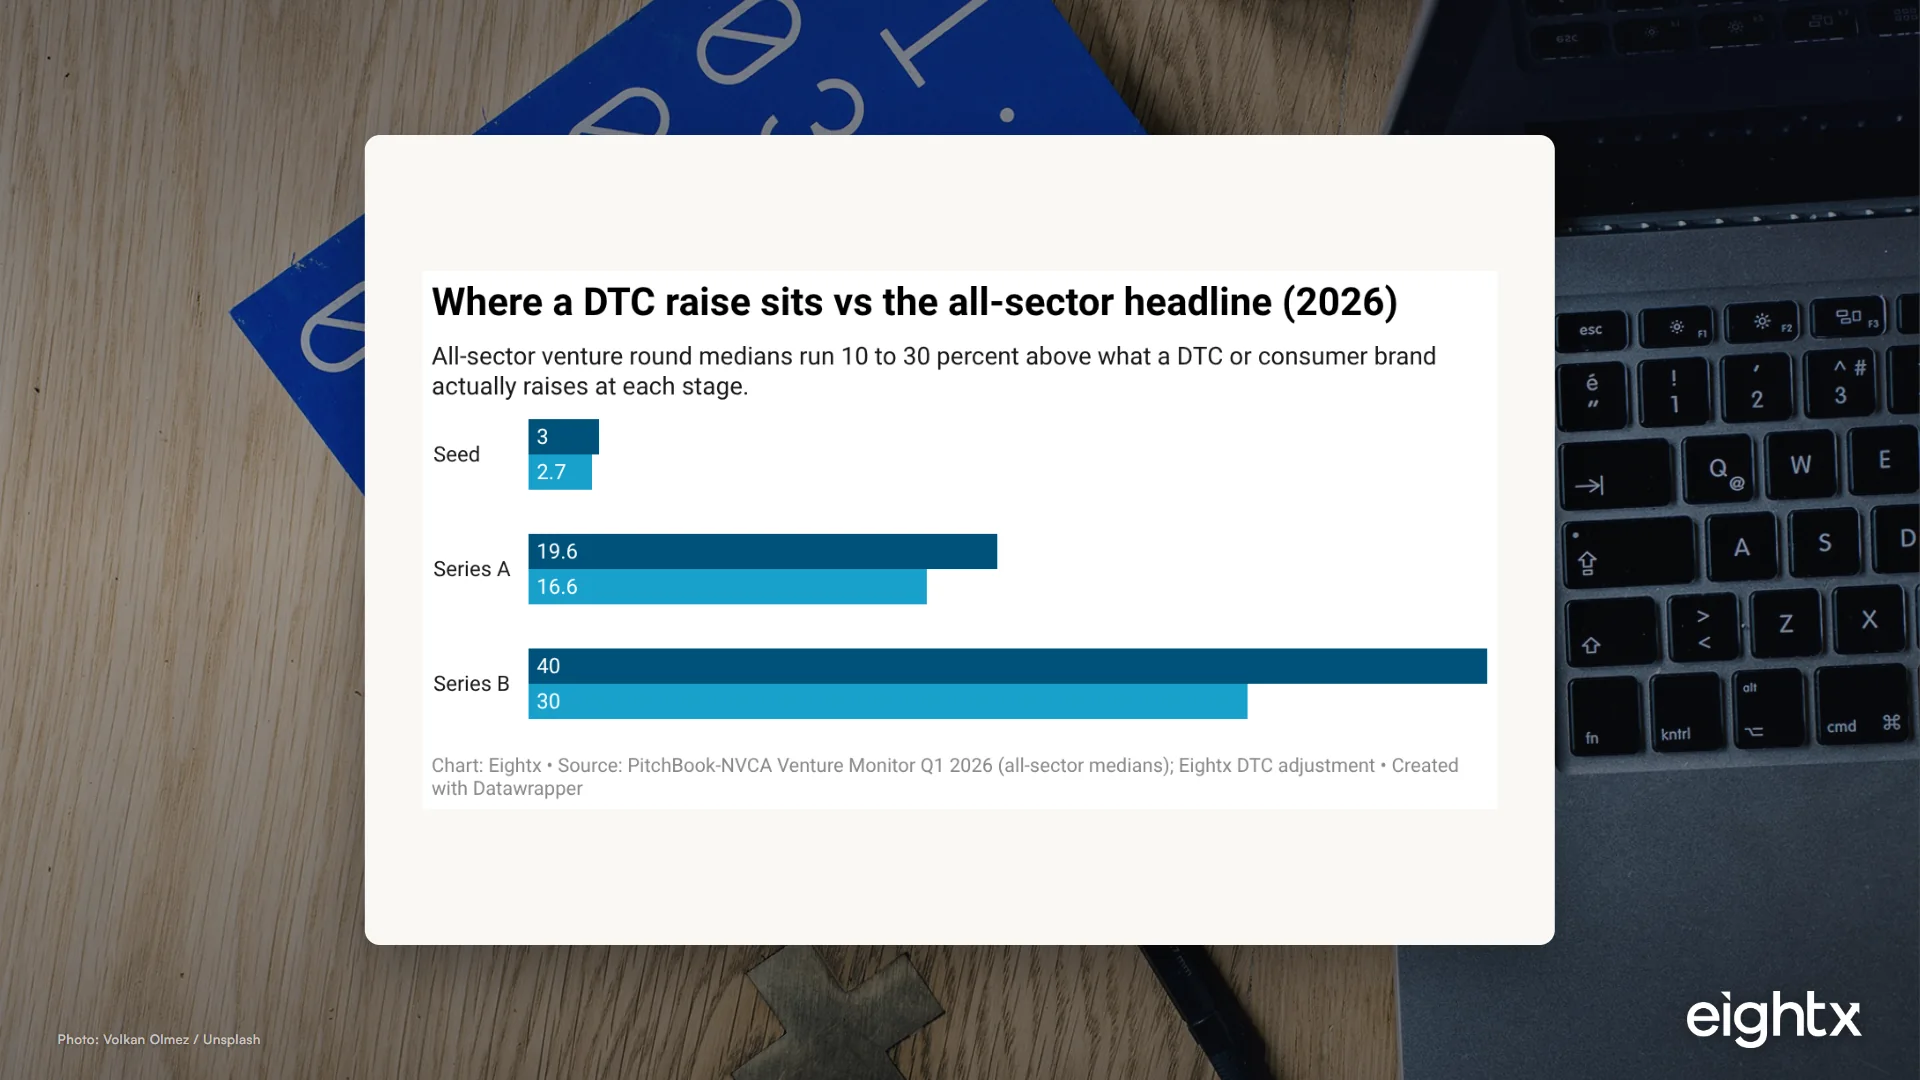
Here is where most founders set the wrong expectation. The PitchBook-NVCA Q1 2026 all-sector Series A median is $19.6M at roughly $62M pre-money, but that number is inflated by mega-AI deals. DTC and consumer brands raise 10% to 30% below the all-sector figure (an Eightx adjustment, not a published third-party discount). A clean 2026 Series A for a $5M to $20M revenue DTC brand is a $10M to $15M check at roughly $40M to $60M post-money, per our funding round size analysis. Modeling your raise against $19.6M misaligns your board, your existing investors, and your spend plan. The chart below shows how far the DTC-adjusted number sits below the all-sector headline at each stage.
Round size also has to match runway. Plan for 18 to 24 months between rounds, the historical gap, while knowing investors increasingly prefer you raise 24 to 30 months of cushion. Only about 20% of DTC seed cohorts (the 2022 vintage, per Crunchbase) graduate to a Series A inside two years, so your model should show you hitting the milestones that lead into the next round before the cash runs out, with a buffer. Sizing and runway are tied together, which is why a dedicated how much to raise calculation should drive the number, not the other way around.
| Benchmark | All-sector (NVCA Q1 2026) | DTC-adjusted working number |
|---|---|---|
| Series A round size | $19.6M | $10M to $15M |
| Series A post-money | ~$62M pre-money | $40M to $60M post |
| Median Series A dilution | 17.9% (Carta Q1 2025; ~20.9% a year earlier) | 15% to 25% |
| Runway to model | n/a | 18 to 24 months |
| Seed to Series A graduation | ~25.6% all-market within 24 months | ~20% DTC (2022 cohort) |
Map the use of funds to milestones
A use of funds is not a pie chart of spend categories. It is a bridge from this round to the next, and every dollar should map to a milestone that raises your value or de-risks the business: a revenue target, a contribution-margin level, a new channel proven, a key hire. The investor is underwriting whether this capital gets you to a fundable Series B, not whether you can spend it.
Be explicit. If $5M goes to paid acquisition, the model should show the units, the CAC, the payback, and the contribution margin that spend produces, with the resulting revenue and retention. If $2M goes to inventory, show the turn and the working-capital cycle. A use of funds that does not tie to drivers is the fastest way to signal you do not understand your own model.
And decide honestly whether equity is even the right capital. When we talk founders through this, the line we keep coming back to is that the path of least resistance is usually not equity, it is debt. Equity is nice because you never pay it back, but you also take a significant amount of dilution at a lower valuation than you will carry later. If the round funds working capital or ad-spend smoothing rather than durable growth, bank debt or revenue-based financing is often cleaner and cheaper on a fully diluted basis. The other pre-signing job is dilution modeling: if you are raising on a SAFE or a convertible, model what your holdings look like under each conversion scenario before you sign, because that is the math you will live with for years.
Build base, upside and downside off the same engine
Scenarios are not three separate spreadsheets. They are the same driver-based engine with different inputs. The framing we give every founder is simple: any one model is going to be wrong, it just is, so we build three. A best estimate, a worst case, and a best case. Do that correctly and reality lands somewhere between them, and you can check your actuals each month to see which path you are on. Base case uses your honest current trends. Upside flexes demand up and CAC down. Downside models slower growth, higher CAC, and delayed cash collection. The chart below shows Year 2 outputs for an illustrative $12M-revenue DTC brand raising a $12M Series A, with the same use of funds across all three cases. Only the demand and CAC drivers move.
The single test that decides a model is the downside. If your worst case still reaches the next-round milestone with cash to spare, you are fundable. If it runs you dry before then, the round is too small or the plan is too aggressive, and an investor will find that out faster than you will.
The test that matters is the downside. If the downside case runs you out of cash before you reach the milestones that lead into the next round, the round is too small or the plan is too aggressive. A model that only works in the base case is not a plan, it is a hope. Investors fund the founder whose downside still gets them to the next raise, because that is the one who will not be back asking for an emergency bridge in 14 months. The metrics that keep the downside alive are the same ones investors index on, covered in our sibling post on the metrics investors want from DTC brands.
What to do about it
If you are building a model for a raise in the next 6 to 12 months, do it in this order.
- Build the driver tab first. Units, AOV, repeat rate, traffic, conversion, CAC, cost per order, headcount. Every other tab references these. No hard-coded revenue.
- Link the three statements and prove they tie. P&L to balance sheet to cash, with no broken links. If they do not reconcile, you have a bug an investor will find.
- Layer in cohort retention. Revenue retention by monthly cohort, so growth is shown to compound rather than churn.
- Anchor the ask on the DTC curve. Size a $10M to $15M Series A, not the $19.6M headline, and map it to 18 to 24 months of runway.
- Write the use of funds as a milestone bridge. Every dollar tied to a driver and a milestone that gets you to a fundable next round.
- Stress the downside until it hurts, then make sure it survives. Slower growth, higher CAC, delayed cash. If it breaks, fix the round size or the plan before an investor does.
This is the exact build our team runs for brands heading into a raise: the driver engine, the unit-economics and cohort story, and the scenario layer that holds up in a data room. It is part of the broader capital strategy we cover in our guide to funding an ecommerce brand.
Methodology
This is a private-market and operating-norm question, not a government time series, so there is no single BLS or Census feed that answers "what a DTC fundraising model should contain." The authoritative primary sources are the venture deal-points data published by PitchBook-NVCA and Carta, plus investor and operator benchmark write-ups for the unit-economics bars. We triangulated those against Eightx's own sibling research.
Round size and pre-money are from the PitchBook-NVCA Venture Monitor Q1 2026: an all-sector Series A median of $19.6M at roughly $62M pre-money, with the all-sector average ($39.6M) dragged up by mega-AI rounds, which is why the median is the wrong yardstick for a consumer brand. The granular stage medians live in the gated full report, so a reader without PitchBook access cannot independently verify the exact table.
Dilution is from Carta's State of Private Markets Q1 2025: the median Series A round involved 17.9% dilution, down from about 20.9% a year earlier, with the cross-stage seed-through-Series-C median falling from roughly 18% to 16% across 2025. The graduation figure, about 20% of the 2022 DTC seed cohort reaching a Series A by mid-2025, is from Crunchbase via our time-between-rounds analysis; the broader all-market within-24-months benchmark is roughly 25.6%.
The unit-economics bars (gross margin 60%+, 70% to 85% in beauty, LTV to CAC at least 3 to 1, and CAC payback inside 12 months on a contribution-margin basis) are triangulated from consumer-fund metric guides and 2026 DTC benchmark write-ups. The 10% to 30% DTC discount to the all-sector headlines is an Eightx adjustment, not an independently published series; no third party publishes a DTC-specific discount, so treat it as our triangulation.
The driver-based structure follows our driver-based forecast definition and the cash layer follows our 13-week cash flow framework. Operator-voice passages are drawn from anonymized Eightx founder calls; no client is named. Scenario figures in the chart are illustrative for a brand entering the raise at roughly $12M net revenue and are not a forecast for any specific company.
Frequently Asked Questions
what should a fundraising financial model include?
A driver-based three-statement model: revenue built from units, AOV and repeat rate, costs from CAC and cost per order, all flowing into P&L, balance sheet and cash. Plus unit economics, cohort retention, an explicit use of funds tied to milestones, and base, upside and downside scenarios.
how many years should a startup fundraising model project?
Three to five years, with monthly detail for the first 18 to 24 months (your runway window) and quarterly or annual after that. Investors care most about when cash runs out and which milestones you hit before the next raise, so the near-term months need to be granular.
what is a driver-based model and why do investors want one?
A model where each line is built from an operational driver rather than a percent of revenue. Revenue is units times AOV times repeat rate; fulfillment is orders times cost per order. It lets an investor change one assumption, like CAC up 20%, and see the whole model respond, which is exactly what diligence does.
how much runway should i raise for?
Plan for 18 to 24 months between rounds, though investors increasingly prefer you raise 24 to 30 months of runway. Only about 20% of DTC seed cohorts (the 2022 vintage, per Crunchbase) graduate to a Series A inside two years, so your model should show you hitting the milestones that lead into the next round before cash runs out, with a buffer.
what are base, upside and downside scenarios in a fundraising model?
Three versions driven off the same engine. Base uses your honest current trends. Upside flexes demand up and CAC down. Downside models slower growth, higher CAC and delayed cash. The test is simple: if the downside runs you out of cash before the next raise, the round is too small or the plan is too aggressive.
why do fundraising models fail diligence?
Broken links between the statements, percent-of-revenue assumptions an investor cannot test, unit economics that do not pay back, missing cohort retention, and a use of funds that does not map to milestones. The fix is a clean driver-based build where every output traces back to a defensible input.
what gross margin and cac payback do investors want from a dtc brand?
For a 2026 Series A, most consumer investors want gross margin at or above 60% (70% to 85% in beauty), LTV to CAC of at least 3 to 1, and CAC payback inside 12 months on a contribution-margin basis. Term-sheet winners land payback in 3 to 9 months and stay contribution-margin positive.
what dilution should i expect on a series a?
The median Series A dilution was 17.9% in Carta's Q1 2025 data, down from about 20.9% a year earlier. A working DTC band is 15% to 25% depending on round size and valuation. Model your fully diluted cap table, including any SAFEs or convertibles, before you sign.