
Cash Flow
The Metrics Investors Want Before a Raise (2026 DTC Readiness Check)
Before a raise, a DTC brand needs seven numbers ready: gross margin at 50% or higher, positive contribution margin, CAC payback under six months, LTV:CAC of at least 3 to 1, real cohort retention, year-over-year growth near 50%, and a burn multiple under 1.5x. Clear those and you are fundable.
Key Takeaways
- Gross margin sets the ceiling: 50% is the fundable floor for consumer brands, 60% is what wins term sheets. Real 10-K data shows brands above ~54% are near breakeven; those below ~41% are burning.
- CAC payback under 6 months and LTV:CAC of 3 to 1 are the two customer-economics gates investors check first.
- Burn multiple is the 2026 litmus test: under 1.5x is acceptable, under 1.0x is strong, above 2.0x usually kills the round.
- Investors discount modeled LTV. Bring real cohort retention data, not an optimistic spreadsheet assumption. The DTC average gets only ~28% of customers to a second purchase.
- The IPO exit is gone for sub-$300M brands, so your metrics now have to prove the business throws off cash on its own.
Most founders walk into a raise with a deck full of revenue and a story about the brand. Investors are looking at something narrower and far less flattering: seven numbers that tell them whether your growth is real or rented. If those numbers do not clear the bar, the pitch is over before the vision slide.
And revenue alone will not save you. We once worked with a brand doing about $80M with 16 months in a row of profit that still could not raise the capital it wanted. In 2026, scale opens fewer doors than it used to. Efficiency opens them. This is the dashboard: seven metrics, the benchmark each one has to clear to be fundable, and what separates a polite pass from a term sheet. Walk your own brand through it before an investor does, because in this market they will not give you the benefit of the doubt.
Why the bar moved in 2026
The fundable bar is higher now than it was in 2021, and it is higher for a structural reason. The IPO exit that justified hot, money-losing growth rounds is gone. Per our DTC Funding Drought Index 2026, zero pure-play US DTC brands have priced an IPO since Birkenstock in October 2023, a drought of roughly 32 months, and median revenue for US IPO issuers since 2024 is roughly $673M. That effectively locks out every brand below $300M in revenue from the public-market path.
What that means for your raise is simple: investors can no longer assume a public exit will bail out weak unit economics. So they price the round on whether the business throws off cash on its own. Every metric below is really one question asked seven ways: does this brand make money on each customer, and can it grow without lighting capital on fire? For the full picture on why this market rewards efficiency over scale, see our guide to funding an ecommerce brand. And if the issue is a short-term cash gap rather than a growth round, the trade between bridge financing and equity is a separate decision worth running before you dilute.
The seven metrics, and the bar each one clears
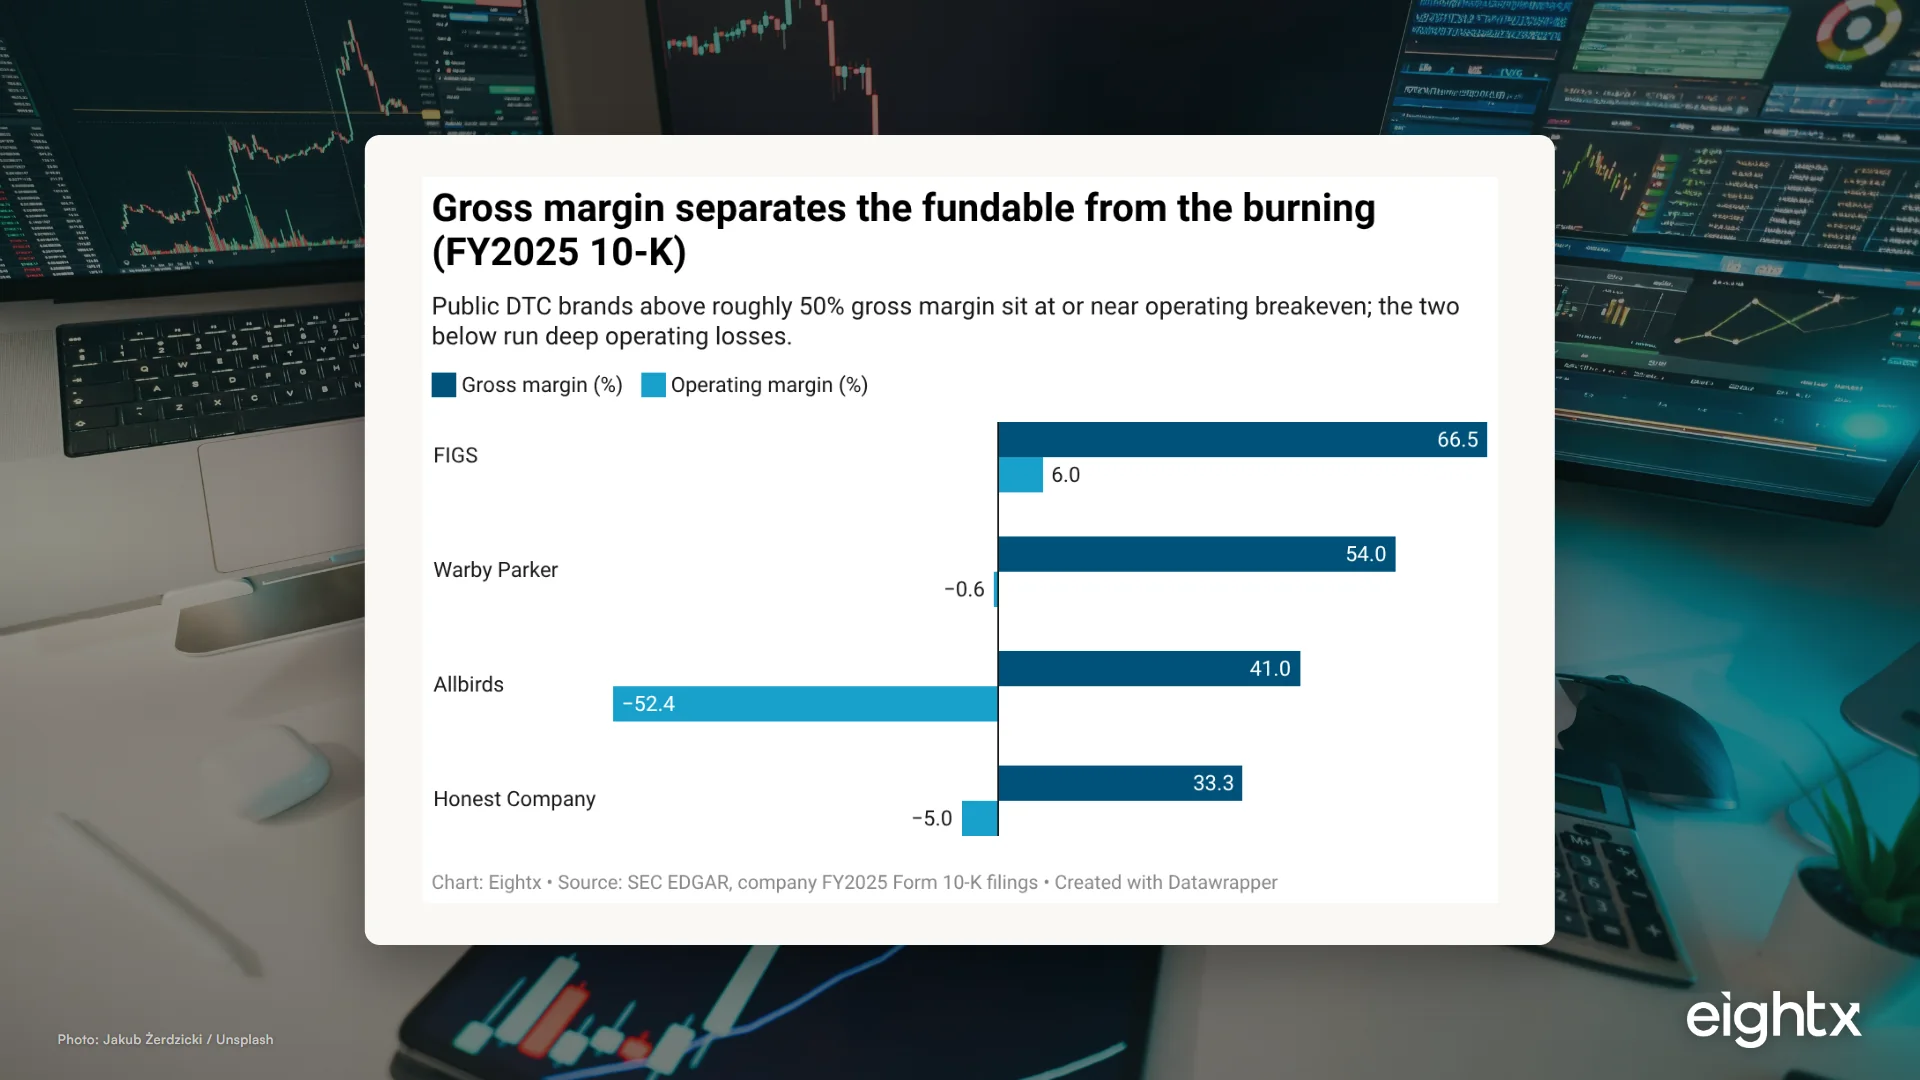
Before the table, one chart that explains why the whole exercise exists. In FY2025 public filings, the DTC brands above roughly 54% gross margin are at or near operating breakeven while the brands below 41% are deep in the red. Margin, not revenue, is what lets a brand absorb acquisition cost and still throw off cash.
Here is the full readiness check. The left column is the bar you need to clear to survive diligence. The right column is what actually pulls a term sheet.
None of these live in isolation. Gross margin sets the ceiling. Contribution margin tells you what is left after you pay to acquire the customer. CAC payback and LTV:CAC tell you whether that customer is an asset or a liability. Retention proves the whole thing repeats. Growth shows the market is pulling. And burn multiple is the verdict on whether you can do all of it efficiently.
Gross margin and contribution margin: the foundation
Gross margin is the first number an investor looks at because it caps everything downstream. The fundable floor for a consumer brand is 50%, and 60% or higher is meaningfully more attractive. Below 50%, there is rarely enough room left to absorb acquisition cost and still throw off cash, no matter how good your marketing is.
This is not an arbitrary line. Real public-company filings prove the relationship. In FY2025 10-K data, the DTC brands above roughly 54% gross margin are at or near operating breakeven and throwing off cash, while the brands below 41% are deep in the red.
| Brand | FY2025 revenue ($M) | Gross margin | Operating income ($M) | Operating cash flow ($M) |
|---|---|---|---|---|
| FIGS | 631.1 | 66.5% | +38.1 | +61.2 |
| Warby Parker | 871.9 | 54.0% | -5.3 | +110.8 |
| Honest Company | 371.3 | 33.3% | -18.5 | +15.1 |
| Allbirds | 152.5 | 41.0% | -80.0 | -55.1 |
But gross margin alone can lie. The number investors actually trust is contribution margin, what is left after variable fulfillment, payment processing, and paid acquisition. As one operator put it on a call, the only difference between gross profit and contribution is the variable marketing, the ad spend, which is exactly why tracking it is critical. A brand can show a 58% gross margin and a negative contribution margin if it is buying every order. The fundable bar is a positive blended contribution margin, and 20% or higher at scale is where it gets compelling. Vendor P&L benchmarks put DTC contribution margin near 19% for brands over $50M and around 31% for brands under $10M, so thinning margin at scale is normal, but negative is not. If your gross margin is healthy but contribution margin is thin, that is a pricing-power or channel-efficiency problem, and investors will name it in the first call.
Customer economics: CAC payback and LTV:CAC
These two are the gates investors check before they bother with growth. CAC payback is how many months of contribution it takes to earn back what you spent to acquire a customer. Under 6 months is fundable. Under 3 to 4 months is strong, because it means you recycle acquisition capital fast enough to self-fund a real chunk of growth. Fair warning: our six-month bar is stricter than the roughly 12 months most vendor guides cite. We hold to it because, as we tell founders, you really want to break even within the first year and ideally inside the first order, since it is a long time to recoup acquisition spend otherwise.
LTV:CAC is the ratio of lifetime value to acquisition cost. The bar is 3 to 1, meaning $3 of value for every $1 spent. 4 to 1 or better is what you want when growth is still strong. When I talk to founders about this number, the framing that lands is blunt: a half-decent ratio is three to one, and if you want to bang in valuation you want it closer to ten to one, which is very hard and not everyone can do it, so find real comps. The trap here: investors discount modeled LTV hard. If your lifetime value is a spreadsheet assumption rather than observed cohort behavior, they will rebuild it themselves with conservative numbers and your 4 to 1 becomes 2 to 1 in their model. Bring the real cohort data.
| Metric | Market reality / benchmark | The fundable bar |
|---|---|---|
| LTV:CAC | Average 3.4:1; top quartile 5.6:1 | At least 3:1 (4:1 strong) |
| Second-purchase retention | ~28% average; consumables 40 to 55% | Above average and rising across cohorts |
| DTC contribution margin | ~19% (over $50M) to ~31% (under $10M) | Positive blended; 20%+ at scale |
| Burn multiple (Series A) | Median ~1.6x | Under 1.5x to 2.0x |
Retention and growth: proof it repeats and pulls
Retention is what separates a real brand from paid-growth arbitrage. The average DTC brand only gets about 28% of customers to a second purchase; top performers in consumables like supplements, coffee, and skincare reach 40 to 55%. Investors want evidence of repeat behavior within 60 to 180 days and, ideally, a repurchase rate that rises across cohorts over time. A flat or declining repeat rate tells them you are renting revenue from Meta and Google, and the moment you stop spending, the revenue stops too.
This is also the most common place we see modeled LTV fall apart. The pattern we run into again and again is a cohort chart where the newest cohorts are throwing off less revenue than the older ones did, which quietly breaks the lifetime-value math the whole pitch rests on. If that is happening to you, find it before the investor does, because they will rebuild your LTV on the declining cohorts, not the flattering blended average.
Growth has to confirm the market wants this. For a Series A consumer brand, 50% year-over-year is the compelling floor and 100% or higher, if it is efficient, is exceptional. The word "efficient" is doing the work. In 2026 nobody is impressed by 200% growth on a 3x burn multiple, which brings us to the number that ties it all together.
Burn multiple: the 2026 litmus test
Burn multiple is the dominant capital-efficiency metric, and it is the one that has gotten stricter fastest. It is net burn divided by net new revenue, the cash you consumed for each dollar of new revenue you created. The David Sacks framework reads it like this: under 1.0x is amazing, 1.0 to 1.5x is great, 1.5 to 2.0x is good, 2.0 to 3.0x is suspect, and above 3.0x is bad. Series A medians run around 1.6x.
For a 2026 raise, treat under 1.5x to 2.0x as the fundable bar and under 1.0x as the figure that makes investors lean in. The operators who survive this market manage to a hard burn target on purpose. The discipline we hear most often sounds like setting a mandate, for example losing no more than $600K this year and treating that as the line, precisely because so many venture-funded brands took in money, blew it all, and had nothing left. A clean burn multiple can carry a brand with merely good growth, because it proves you can be trusted with the next dollar. A bad one usually ends the conversation no matter how fast you are growing. This is also where a fractional CFO makes a brand more attractive to investors: the burn multiple is a number you can engineer down before you ever open the data room.
What to do about it
Here is how I would prep a brand for a raise, in order.
- Compute all seven, honestly, from real data. No modeled LTV, no aspirational margin. Pull last twelve months and the trailing two quarters separately so investors can see the trend.
- Find your weakest metric and fix it before you raise. One number below the bar drags the whole story down. Usually it is contribution margin or CAC payback, and both are fixable in a quarter or two.
- Rebuild LTV from cohorts, not assumptions. Show 60-day, 90-day, and 180-day repeat behavior by acquisition month. This is the single thing that survives investor scrutiny.
- Engineer the burn multiple down. Cut the spend that does not pay back inside the payback window. A 1.8x dropping to 1.1x over two quarters tells a better story than a flat 1.3x.
- Pre-empt the questions. Build the dashboard the way what VCs look for in DTC frames it, and wire it into your fundraising financial model so every number ties out to the same source.
- Assume zero IPO exit. Design the plan so the business is fundable because it makes money, not because a public market will eventually rescue it.
Methodology
Benchmark thresholds in this post come from two layers. The public-comp data (gross margin, operating income, operating cash flow for FIGS, Warby Parker, Honest Company, and Allbirds) is pulled directly from each company's FY2025 Form 10-K on SEC EDGAR. Those are post-IPO public companies at $150M to $870M in revenue, so use them to validate the gross-margin-to-profitability direction, not to set a Series A revenue target.
The fundable-bar figures are drawn from 2026 DTC Series A diligence norms triangulated across vendor benchmarks: LTV:CAC averages from Yotpo and our own LTV:CAC by vertical analysis, second-purchase retention from vendor compilations, contribution margin from the A2X 2026 P&L Benchmark Report, and the burn-multiple ladder from David Sacks with Series A medians from Runway 2026.
The market-structure figures (the roughly 32-month IPO drought, the roughly $673M median IPO revenue, the $300M lockout) come from the Eightx DTC Funding Drought Index 2026, compiled from SEC EDGAR filings and Census Business Formation Statistics.
Two bars are intentionally stricter than the common vendor number and are flagged as Eightx standards rather than universal benchmarks. The "under 6 months CAC payback" bar reflects a 2026 cash-efficiency standard against the roughly 12-month figure most vendors cite. The "~50% YoY growth" floor is a directional operator standard, since no single vendor source publishes a hard DTC Series A growth threshold.
The burn-multiple denominator here is net new revenue rather than the net new ARR the Sacks framework originally used for SaaS. The analogy is intentional: pure-subscription DTC can use ARR directly, while the rest of DTC should read it as net new revenue. Benchmarks vary by category, so treat each bar as a directional threshold rather than a hard cutoff.
Frequently Asked Questions
what metrics do investors want to see before a raise?
Gross margin, contribution margin, CAC payback, LTV:CAC, repeat or cohort retention, year-over-year growth, and burn multiple. Investors check customer economics and capital efficiency first, then growth.
what is a good ltv:cac ratio for a dtc brand raising in 2026?
At least 3 to 1 to be fundable, 4 to 1 or better to be compelling. The market average is about 3.4 to 1 and the top quartile is 5.6 to 1, so 3 to 1 is the floor, not the goal. Build it from real cohort behavior, not a modeled lifetime.
what cac payback period do investors expect?
Under 6 months is our fundable bar in 2026, stricter than the ~12 months most vendor benchmarks cite. Under 3 to 4 months is strong because it shows you recycle acquisition capital fast and can self-fund a chunk of growth.
what gross margin do you need to raise venture for a consumer brand?
50% is commonly the floor for a fundable consumer brand and 60% or higher is much more attractive. In FY2025 10-K data the public DTC brands above ~54% gross margin were near breakeven, while those below ~41% posted heavy operating losses.
what burn multiple is acceptable to vcs in 2026?
Under 1.5x to 2.0x is acceptable, under 1.0x is strong, and above 2.0x is usually a red flag. Burn multiple is net burn divided by net new revenue and has become the dominant capital-efficiency test. Series A medians run around 1.6x.
is contribution margin or gross margin more important to investors?
Both, but contribution margin tells investors more. It shows what is left after variable fulfillment, payment, and marketing costs, which is the cash actually available to fund growth. A brand can show 58% gross margin and negative contribution margin if it is buying every order.
what repeat purchase rate do investors want to see for a dtc brand?
Above the ~28% DTC second-purchase average, and rising across cohorts. Consumables brands in supplements, coffee, and skincare often hit 40 to 55%. Investors want proof the repurchase rate is holding or climbing, not decaying.
can you raise if you are profitable but growing slowly?
Sometimes, but profit alone no longer guarantees access to capital. We have seen an ~$80M brand with 16 straight months of profit still struggle to raise the amount it wanted. In 2026, clean efficiency metrics open the door that scale alone does not.