
Inventory
How to Calculate Your Ideal Inventory Investment
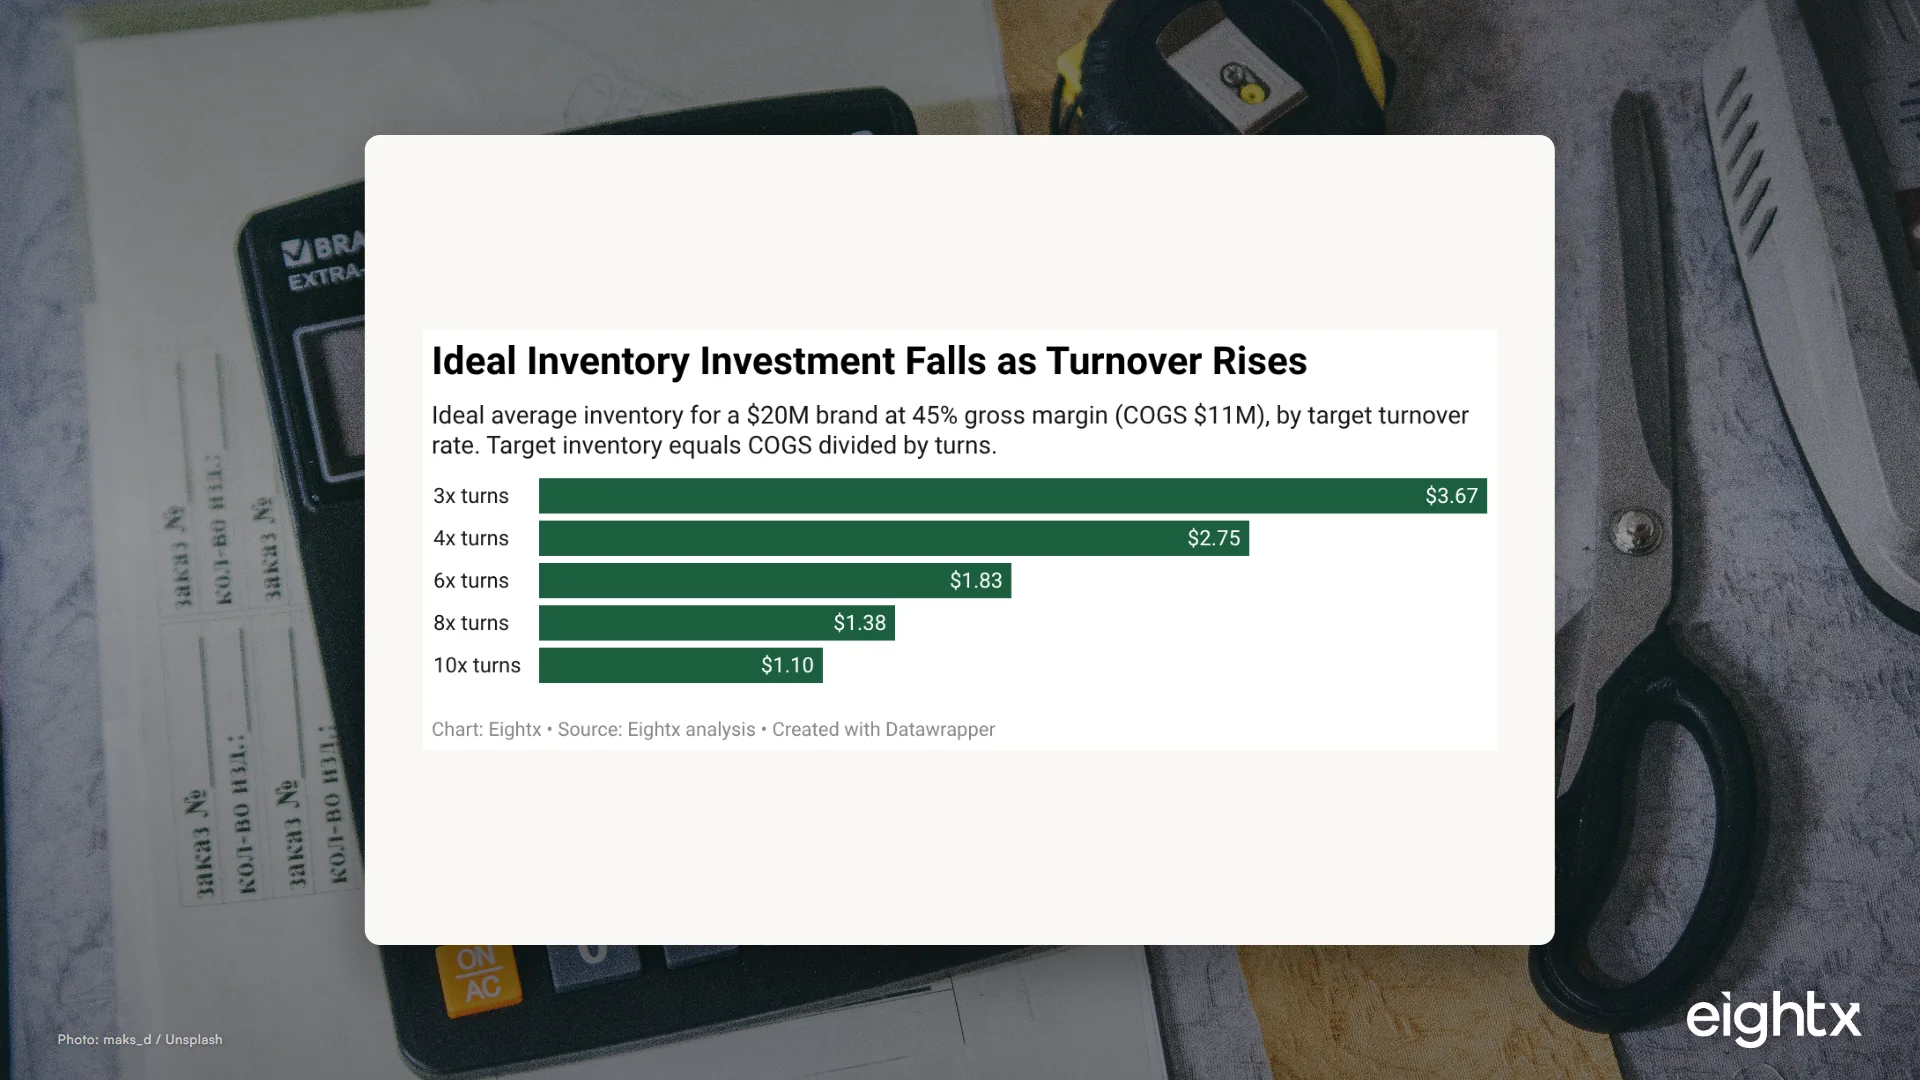
Your ideal inventory investment is annual COGS divided by your target turnover rate, built up from cycle stock plus safety stock. For a $20M brand at 45% gross margin targeting 4 turns, that is roughly $2.75M. Compare it to your balance sheet to find over- or under-investment.
Key Takeaways
- Ideal inventory investment equals annual COGS divided by target turnover: a $20M brand at 45% margin and 4 turns should hold about $2.75M, not $3.67M (3 turns) or $1.1M (10 turns)
- Build the target bottom-up: cycle stock (half a reorder cycle) plus safety stock (lead time and service level driven), then sanity-check it against your turnover target
- DSI above 2x your supplier lead time is a structural cash leak, not caution; that rule of thumb catches most over-investment fast
- Cutting a $10M brand from 180 to 90 inventory days frees about $1.23M of cash that never touches the P&L
- Check GMROI alongside the dollar target: below 2.0 means carrying costs are eating the return, 3.0-plus is a productive asset
Most founders can tell you their revenue and their gross margin off the top of their head. Ask them how much cash should be sitting in inventory right now and you get a shrug. That number is not a vibe. It is a calculation, and the gap between your ideal inventory investment and what is actually on your balance sheet is usually the single largest pool of trapped, recoverable cash in the business.
When I talk to founders running a brand this size, the line I hear most is some version of "all the extra cash flow right now just goes into inventory, and I think maybe I'm overbuying." They are usually right, and the reason it happens is that nobody ever set a target. Inventory grows by default, one reorder at a time, until one day there is a few million dollars sitting in a warehouse and no one can say whether that is the correct amount.
This is the math we run for every brand we take on. It takes four inputs you already have: your turnover rate, your supplier lead time, your target service level, and your growth rate. Here is the formula, a worked example, and how to read the result.
The formula for ideal inventory investment
Start with the identity that drives everything. Inventory turnover equals annual COGS divided by average inventory. Rearrange it and you get your target:
Ideal inventory investment = Annual COGS / Target turnover rate
That gives you the headline number in one line. But a turnover target alone does not tell you why the number is what it is, so build it up from the two things that actually consume the cash:
Ideal inventory investment = Cycle stock + Safety stock
- Cycle stock is the working inventory you burn between replenishments. As a planning approximation it is about half of your reorder quantity, or
Annual COGS / (2 x turns per year). - Safety stock is the buffer that protects your fill rate against demand and lead-time variability. In dollars it is roughly
daily COGS x lead time days x a service-level buffer. The higher your target service level, the bigger that buffer, because covering the 99th percentile of demand costs far more inventory than covering the 90th.
Growth is the multiplier. If you are growing 30 percent year over year, next quarter's demand is higher than last quarter's, so your forward-looking ideal investment scales with forecast COGS, not trailing COGS. Plan inventory off where you are going, not where you have been.
A worked example
Take a $20M revenue brand at 45 percent gross margin. Annual COGS is $11M.
Suppose the supplier lead time is 60 days, demand is reasonably stable, and the brand wants a 95 percent service level. Here is the bottom-up build:
| Component | Calculation | Result |
|---|---|---|
| Daily COGS | $11M / 365 | $30,137 |
| Cycle stock | ~45 days of COGS | $1.36M |
| Safety stock | ~30 days of COGS (60-day lead time, 95% service) | $0.90M |
| Cycle + safety | $2.26M | |
| Turnover-implied target (4 turns) | $11M / 4 | $2.75M |
The two methods bracket the answer. The bottom-up build says roughly $2.26M of genuine working and buffer stock; the turnover target of 4 turns says $2.75M. Land in that $2.3M to $2.8M band and you are holding the right amount of cash in product. The turnover lever is the cleanest way to see how sensitive the number is:
Move from 3 turns to 6 turns and the same brand's ideal investment drops from $3.67M to $1.83M. That $1.84M swing is cash, and it is governed almost entirely by how fast you replenish, not by how much you sell.
Set the target with the right turnover number
The formula is only as good as the turns you plug in, and "good" turns are vertical-specific. Pulling from our 2026 benchmarks by vertical:
| Vertical | Healthy turns | DSI | Healthy GMROI |
|---|---|---|---|
| Fashion / Apparel | 4 to 7x | 52 to 91 days | 2.0 to 3.0 |
| Beauty / Cosmetics | 4 to 9x | 41 to 91 days | 2.5 to 3.5 |
| Supplements | 8 to 12x | 30 to 46 days | 4.0 to 7.0 |
| Food and Beverage | 12 to 15x | 24 to 30 days | 3.0 to 5.0 |
| Home Goods | 3 to 5x | 73 to 122 days | 1.5 to 2.5 |
| Blended DTC | 6 to 10x | 36 to 60 days | 2.5 to 3.5 |
Do not just grab the middle of your band. The right turnover target is the highest sustainable rate that keeps you above a 95 percent fill rate. Push turns higher than that and you start trading working capital savings for stockouts, lost Buy Box, and organic rank, which costs more than the cash you freed.
"DTC" is not one number: what the public 10-Ks show
If you want proof that turns are vertical and not universal, look at how four public DTC and CPG brands actually report. We computed inventory turns straight off their FY2025 and FY2026 10-Ks, where turns equals annual COGS divided by average inventory.
| Brand | Vertical | FY | Turns | DSI (days) | GMROI |
|---|---|---|---|---|---|
| FIGS | Apparel / scrubs | 2025 | 1.8 | 203 | 3.6 |
| e.l.f. Beauty | Beauty | 2026 | 2.4 | 155 | 5.7 |
| BellRing | Supplements | 2025 | 6.4 | 57 | 3.2 |
| Warby Parker | Eyewear | 2025 | 7.0 | 52 | 8.2 |
Same "DTC" label, a roughly 4x spread in turns. The macro data says the same thing. The FRED clothing-store inventory-to-sales ratio sits at 2.09 months (March 2026) against 0.76 months for food and beverage stores, so apparel structurally carries about 2.7x the inventory per dollar of sales that food does. None of these brands is doing it wrong. They are sitting where their category, lead times, and demand variability put them. The lesson is to benchmark against your vertical, then beat it, not to chase a generic "good" number you read somewhere.
Compare against your actual position
Now do the part that finds the money. Pull your real inventory off the balance sheet and put it next to your ideal number.
- If actual is above ideal, you are over-invested. The most reliable tell is days of inventory. If your DSI is more than 2x your supplier lead time, you have excess. Our inventory days benchmarks show the pooled median across 15 public DTC and CPG brands is 133 days, with a spread from 40 to 221 days, so the median is a sanity check, never a target. The $5M to $20M revenue stage is the danger zone, where inventory quietly creeps to 120 to 240 days as SKU expansion outruns demand planning.
- If actual is below ideal, you may be under-invested. That sounds efficient until you check your stockout and fill rates. Chronic stockouts on hero SKUs mean you have under-funded the very products carrying the brand.
The cash at stake is large. A $10M brand at 50 percent margin holding 180 days of inventory has about $2.46M trapped; cut that to 90 days and you free roughly $1.23M, none of which shows up on the P&L and all of which shows up in your bank account.
The pattern we see again and again is a brand sitting on roughly 250 days of inventory, which stretches the cash conversion cycle out painfully long. The fix is almost always the same: get to 3 to 4 months at the outside and the liquidity comes straight back. The other version of this is mix imbalance. When I worked through one operator's numbers, they were holding eight months of stock in one part of the catalog and four months in another. Just harmonizing the two, holding a consistent target across the line, freed up multiple millions of dollars without selling a single extra unit.
Pressure-test with GMROI
The dollar target tells you how much to hold. GMROI tells you whether what you hold is worth holding. GMROI = Gross Profit / Average Inventory Cost. A GMROI of 1.0 means each inventory dollar throws off one dollar of gross profit a year, which after 20 to 30 percent carrying costs is a losing trade. Below 2.0 means carrying costs are eating the return; 2.0 to 3.0 is a healthy DTC baseline; 3.0-plus is a productive asset. Run it SKU by SKU, because a blended GMROI of 2.5 often hides hero SKUs at 12 and a long tail at 0.4 that is quietly draining the whole portfolio.
The simplest way operators we work with put this into action is to rank every SKU A, B, or C by volume and margin, then set a different holding rule for each tier. The A's earn their cash and you hold about 12 weeks. The B's get roughly 8 weeks. The C's you often do not hold at all, you keep drop-shipping them or you exit them. Holding inventory is one of the biggest reasons brands get into cash trouble, and most of the damage hides in the C tier nobody wants to look at.
Your ideal inventory investment is a number, not a feeling. Pull your real inventory off the balance sheet, set it next to annual COGS divided by your target turns, and quantify the cash trapped above 2x your supplier lead time before you cut a single PO. For most brands this stage, that gap is the largest pool of recoverable cash in the business, and none of it touches the P&L.
What to do about it
- Calculate your true turns. Annual COGS divided by average inventory, where average inventory is (start of year plus end of year) / 2. Convert to DSI with 365 / turns.
- Compute your ideal investment two ways. COGS divided by your target turns, and cycle stock plus safety stock. If they disagree by more than 20 percent, your turnover target or your safety stock assumption is off.
- Compare DSI to lead time. Anything above 2x supplier lead time is your first chunk of trapped cash. Quantify it in dollars before you touch a PO.
- Rank SKUs by GMROI. Liquidate or exit anything sustained below 1.0. That is usually the bottom decile dragging portfolio GMROI down 30 to 40 percent.
- Reset target inventory off forecast, not history. If you are growing, plan to forward COGS so you are not perpetually a quarter behind demand.
- Recheck quarterly. Lead times, growth, and mix all move. The ideal number is a moving target, not a one-time calculation.
For the mechanics behind two of these steps, see how to improve your inventory days and how to set reorder points so your safety stock math is grounded in real lead-time data. For the full working-capital picture, the ecommerce inventory management guide ties inventory back to cash flow.
Methodology
The worked example uses a $20M revenue brand at 45 percent gross margin (annual COGS $11M), a 60-day supplier lead time, and a 95 percent target service level. Target inventory by turns is COGS divided by the turnover rate. Cycle stock is approximated as half a reorder cycle and safety stock as lead-time demand times a service-level buffer; these are planning approximations, not statistical safety-stock outputs, which require demand variability data (true safety stock needs Z times the standard deviation of demand during lead time, with Z at about 1.65 for 95 percent service).
The public-brand turns, DSI, and GMROI come from SEC EDGAR FY2025 and FY2026 10-K filings for FIGS, e.l.f. Beauty, BellRing, and Warby Parker, computed as turns equals annual COGS divided by average inventory ((beginning plus ending) / 2), DSI equals 365 divided by turns, and GMROI equals gross profit divided by average inventory. EDGAR's XBRL pull can return ending inventory one filing period behind COGS, so treat single-brand figures as illustrative rather than audited. The macro inventory-to-sales ratios are from FRED Monthly Retail Trade (RETAILIRSA for all retail, MRTSIR448USS for clothing stores, MRTSIR445USS for food and beverage stores), latest observation March 2026. Vertical turns, DSI, and GMROI bands and the trapped-cash figures are drawn from Eightx 2026 benchmark posts cited inline. Benchmark against your own actuals before acting.
Frequently Asked Questions
how do i calculate my ideal inventory investment?
Divide your annual COGS by your target turnover rate. For a finer estimate, add cycle stock (about half a reorder cycle of demand) to safety stock (lead time demand times a service-level buffer), then confirm the total lines up with your turnover target.
what is a good inventory turnover rate for ecommerce?
Vertical-dependent. Roughly 4 to 6 turns is healthy for most DTC, 6 to 12 is efficient, and below 2 usually signals overstocking. Beauty and apparel run slower (2 to 4x); supplements, food, and subscription run faster (8 to 18x).
how much cash should be tied up in inventory?
As little as you can hold while staying above a 95 percent fill rate. The dollar answer is annual COGS divided by your target turns. Holding more than 2x your supplier lead time in days of inventory is usually trapped cash, not safety.
what is a healthy gmroi?
GMROI is gross profit divided by average inventory cost. Below 1.0 destroys value, 2.0 to 3.0 is a healthy DTC baseline, and 3.0-plus is a productive asset. CPG premium brands target 4 to 7x.
am i over-invested or under-invested in inventory?
Compare your actual balance-sheet inventory to your ideal number (COGS divided by target turns). Sitting well above it with stable demand means over-investment and trapped cash; sitting below it while stocking out means under-investment costing you sales.
does my ideal inventory number change as i grow?
Yes. Set it off forecast COGS, not last year's. If you are growing 20 to 30 percent, planning to trailing sales leaves you a quarter behind demand. Recheck the number quarterly as lead times, growth, and mix all move.
why is my turnover so different from another brand my size?
Because turns are vertical-specific, not size-specific. Real FY2025 10-Ks run from about 1.8 turns for apparel (FIGS) to 7.0 for eyewear (Warby Parker). Lead time, category, and replenishment speed drive the spread far more than revenue does.