
M&A
How to Increase Your Brand's Exit Multiple
You raise your exit multiple by making earnings predictable, transferable, and scalable. Recurring revenue, diversified channels, low customer concentration, durable gross margin, reduced owner dependence, and organic growth each add roughly 0.5 to 3 EBITDA turns. Start building 12 to 24 months before you sell.
Key Takeaways
- Mainstream DTC clears about 3x to 6x EBITDA in 2026; premium, high-growth brands reach roughly 5.5x to 9x. The gap is built, not given.
- Recurring revenue is the single biggest lever, worth about 1 to 3 EBITDA turns versus a comparable one-time-purchase brand.
- Channel diversification, lower customer concentration, and reduced owner dependence each add roughly 0.5 to 2 turns; founder dependence can push 40 to 60% of the price into an earn-out.
- Margin quality, not headline revenue, separates winners: SEC filings show brands at the same gross margin landing on opposite sides of profitability.
- Turns compound but are not additive; you need 12 to 24 months of seasoned results in the trailing numbers before buyers credit them.
Mainstream DTC brands clear about 3x to 6x EBITDA in 2026. Premium, high-growth brands reach roughly 5.5x to 9x, and the exceptional ones push toward 8x to 10x. On a brand doing $4M of EBITDA, that spread is the difference between an $18M outcome and a $36M one. Same revenue, same product, double the check.
The gap is not luck and it is not category. It is built. Buyers pay premiums for earnings that are predictable, transferable, and scalable, and there are six levers that move you up the range. Here is what each one is worth, what the public filings prove about margin, and how to earn the premium in the 12 to 24 months before you sell.
The base multiple is set by category. The premium is earned.
Your starting point is the category comp. Across the 2026 M&A advisor data (FE International, Phoenix Strategy Group, ClearlyAcquired, and our own due-diligence checklist), a mainstream DTC brand anchors around 3x to 6x EBITDA, and an Amazon-concentrated brand anchors at the low end of that. That base is mostly out of your control. The premium on top, the move from the floor of your range toward the ceiling, is entirely about how your specific business de-risks the buyer's model.
Here is the part most founders miss: a sophisticated buyer does not actually pay your multiple. The multiple is a derivative of the real math. When I talk to founders heading toward a $10M-plus exit, the thing I keep telling them is that a PE buyer builds a present value of your future cash flows, lands on a number, and only then divides by EBITDA to back into a multiple. The multiple is the story people tell at the bar afterward, not the method. Every lever below either raises the buyer's cash-flow forecast or lowers the risk they discount it at. That is the whole game.
It is also worth being clear about what buyers value at all. When founders ask whether the check is driven by revenue, the honest answer is that at this scale they are looking at profit, EBITDA, or seller's discretionary earnings, not revenue. You only get a revenue-based valuation if you are raising venture capital. Revenue velocity still matters, because it changes the multiple buyers are willing to pay on that profit, but the base they multiply is earnings.
What each value driver is worth
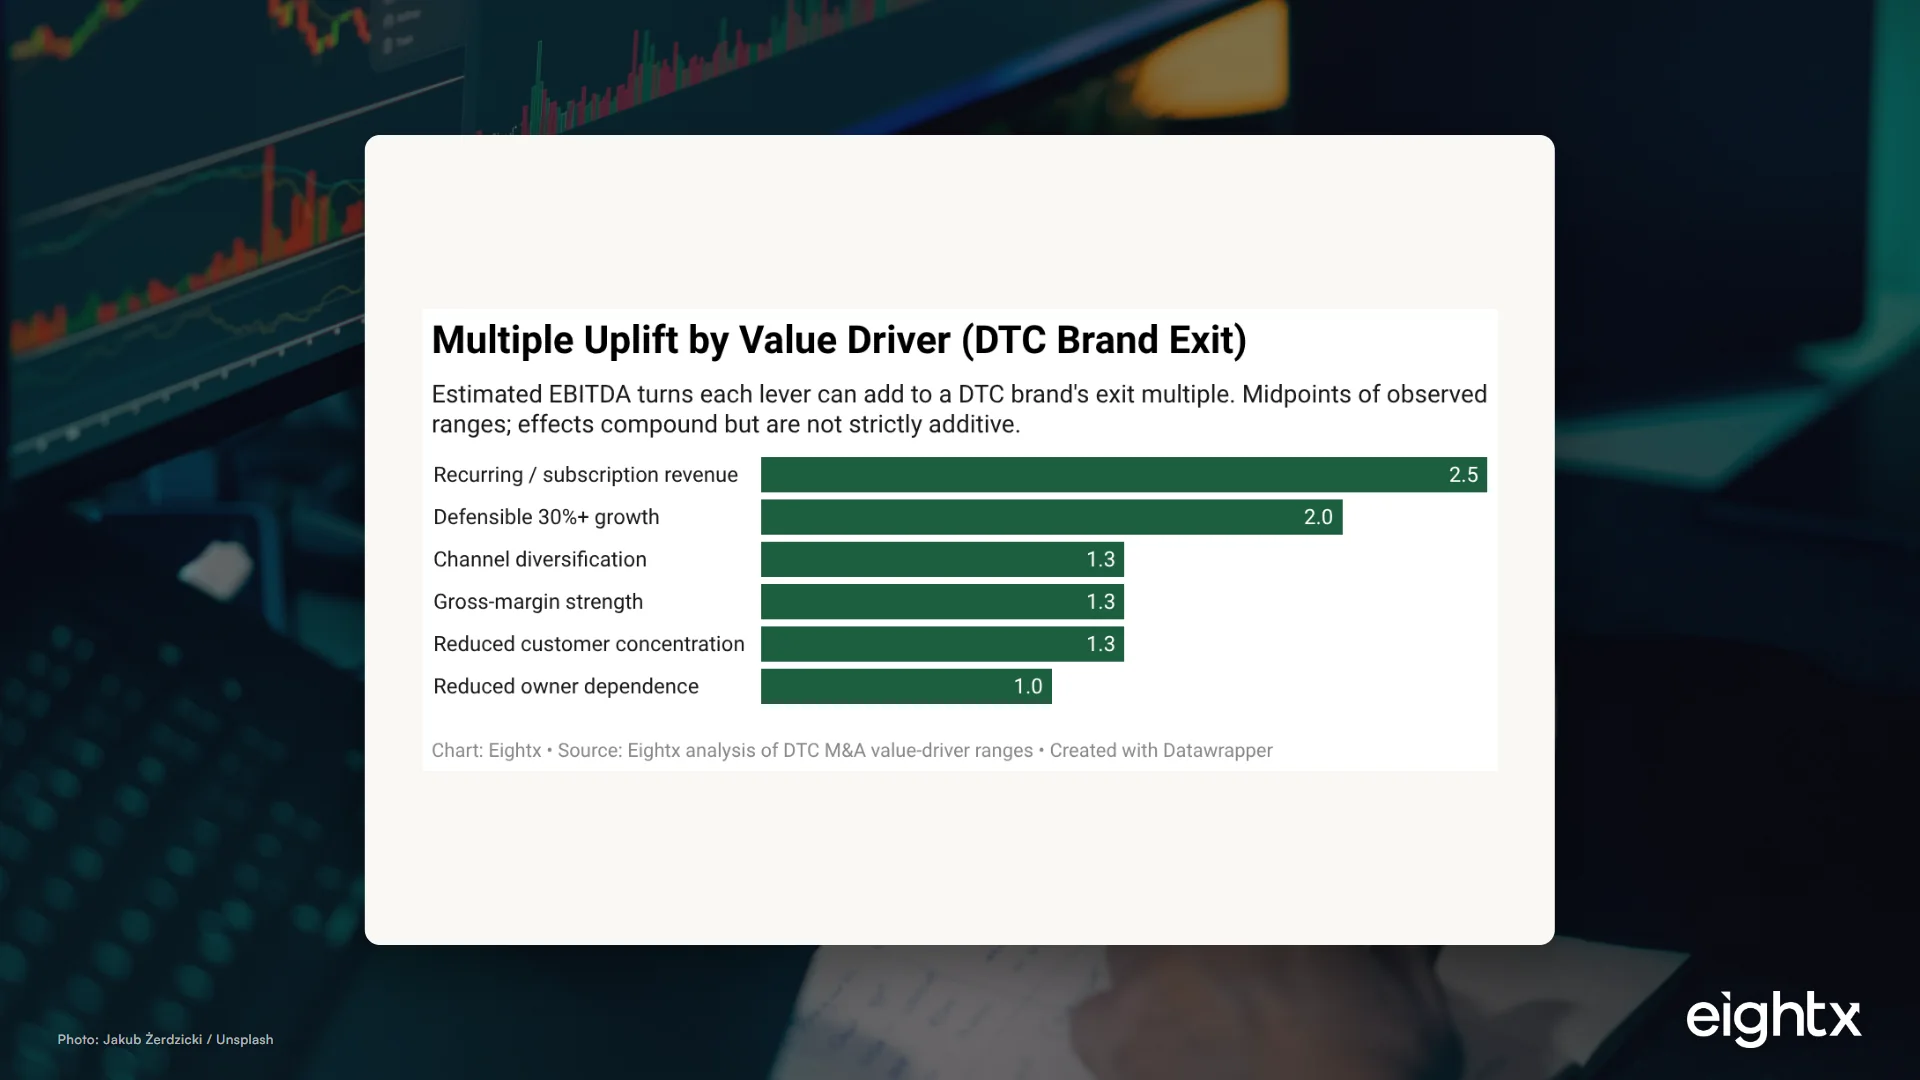
We mapped the quantified uplift from each lever using the 2026 DTC M&A value-driver ranges. The chart below shows the midpoint EBITDA turns. Treat them as a prioritization map, not a calculator, because they compound rather than add.
Recurring revenue (1 to 3 turns). This is the heaviest lever. A subscription base or a high repeat-purchase rate turns a volatile demand-gen business into a predictable cash machine. A moderate recurring component (20 to 40% of revenue) adds about half a turn to a full turn; a strong subscription mix (40 to 60% with low churn) adds 1 to 2; and predominantly-subscription brands often get valued on 4x to 10x ARR instead of EBITDA. Net revenue retention above 110% can justify 7x to 9x on its own. If you can move even 20% to 30% of revenue to subscription, you change the conversation.
Organic, not paid, growth (1 to 2 turns, or a 20 to 35% uplift). Growth pushes you toward the top of the range, but only if it transfers. A brand growing at 70% organic and 30% paid earns a materially higher multiple than one growing purely on rising ad spend, because the buyer knows organic demand survives the handover. LTV to CAC above 5 to 1 attracts the top multiples; below 2 to 1 is treated as unsustainable.
Channel diversification (0.5 to 1.5 turns). Concentration is risk, and risk costs turns. Pulling more than 60% of revenue from a single channel, especially Amazon, is named a top deal-killer and costs 0.5 to 1.5 turns. Spread across DTC, Amazon, wholesale, and retail and you earn the 15 to 25% omnichannel premium instead of the discount.
Low customer concentration (0.5 to 2 turns). A single customer above 25% of revenue is a holdback and earn-out magnet, worth a 1 to 2 turn discount and often a vendor agreement to keep the deal alive. Even 15 to 25% concentration costs about half a turn to a full turn. An owned audience and a high repeat rate spread the risk and let the buyer credit your retention.
Durable gross margin (0.5 to 2 turns). Durable margin signals pricing power and resilient unit economics, and declining gross margin is repeatedly named the number one deal-killer. A slide from 55% to 48% can cost 1 to 2 turns by itself. The pattern we see again and again: founders try to juice a quarter of EBITDA right before a sale and torch the margin trend that the buyer actually cares about. When we have worked through this, the brands that hold margin through their changes keep the turns; the ones that cut to the bone lose them.
Reduced owner dependence (0.5 to 2 turns, but the violent one). This is the most punishing lever when it goes wrong. If you personally run media buying, supplier relationships, and every important decision and will not stay, buyers either cut the headline 30 to 50% or push 40 to 60% of the consideration into an earn-out. Documented SOPs and a real management bench flip it to a small premium, because what a buyer is actually purchasing is a business that runs without you.
Margin quality is the proof, not the promise
Founders love to argue about category multiples, but the public filings make a sharper point: two brands in the same category, at the same gross margin, can land on opposite sides of profitability. That dispersion is the entire case for working the levers.
The chart and table below pull reported operating margin from the most recent SEC filings for nine public DTC and CPG brands. Look at the gross-margin column: e.l.f. (70.7%), Olaplex (69.4%), and BARK (62.4%) all clear 60% gross margin, yet their operating margins run from positive low single digits to deeply negative. Lululemon turns a 56.6% gross margin into a 19.9% operating margin; Allbirds turns a 41.0% gross margin into a 52.5% operating loss. Gross margin is the raw material. What you do with it downstream is the value driver.
| Company | Revenue | Gross margin | Operating margin | Revenue growth YoY |
|---|---|---|---|---|
| Lululemon | $11.1B | 56.6% | 19.9% | +4.9% |
| SharkNinja | $6.4B | 49.0% | 14.4% | +15.8% |
| e.l.f. Beauty | $1.64B | 70.7% | 4.5% | acquisition-inflated |
| Warby Parker | $872M | 54.0% | -0.6% | +13.0% |
| Vital Farms | $759M | 37.6% | 11.6% | +25.3% |
| BARK | $484M | 62.4% | -7.3% | -1.2% |
| Olaplex | $423M | 69.4% | 1.6% | +0.1% |
| Honest Company | $371M | 33.3% | -5.0% | -1.9% |
| Allbirds | $152M | 41.0% | -52.5% | -19.7% |
There is a reason buyers chase margin so hard, and it is not accounting tidiness. When I talk to beauty founders, the ones eyeing the biggest exits are the ones running 80 to 85% gross margins, because that margin buys more marketing firepower than any competitor has, which makes the brand stickier, which makes the cash flows more defensible. High margin is not a vanity metric. It is the fuel that makes every other lever credible.
How the levers compound on a real brand
Take a $4M EBITDA mainstream DTC brand anchored at a 4.5x base, the middle of the advisor range for a concentrated, owner-run business. Here is how a focused 18-month program can move it, with each step discounted for the fact that turns are not strictly additive.
| Lever moved | Turns credited | Running multiple | Enterprise value |
|---|---|---|---|
| Base case (concentrated, owner-run) | -- | 4.5x | $18.0M |
| Add subscription to 25% of revenue | +1.5 | 6.0x | $24.0M |
| Diversify off single-channel reliance | +1.0 | 7.0x | $28.0M |
| Build management bench, document SOPs | +0.5 | 7.5x | $30.0M |
| Hold gross margin through the changes | +0.5 | 8.0x | $32.0M |
That is a near-doubling of enterprise value on flat EBITDA, from $18M to $32M. The numbers are illustrative, not a guarantee, but the direction is exactly what buyers reward. And notice the order: the recurring-revenue lever goes first because it needs the longest runway to season into the trailing numbers, and the owner-dependence and margin work close it out because they protect everything built before them.
The exit multiple is a story people tell after the fact. What buyers actually do is forecast your cash flows and discount them for risk. Every lever that makes those cash flows more predictable, more transferable, and less dependent on you raises the forecast and lowers the discount at the same time. That is why the same EBITDA can be worth 4.5x or 8x. You are not negotiating a multiple, you are building one.
What to do about it: the 12 to 24 month plan
- Months 24 to 18: fix the books. Convert to accrual accounting, which you want done a year or two before you exit, and produce channel-level contribution margin. It is not that hard, and you cannot prove diversification or margin strength you cannot report. This is also the moment to settle your entity structure, since the right LLC versus S-Corp choice changes how much of the sale proceeds you actually keep. See our financial readiness checklist for the full sequence.
- Months 18 to 12: launch or expand recurring revenue. This is your highest-value lever and it needs the longest runway to season. Stand up subscription, refill, or membership and start building the cohort data buyers will want.
- Months 18 to 12: de-concentrate. If one channel or one customer is over the threshold, deliberately grow the others. Buyers want to see the shift sustained in the trailing numbers, not announced in the deck.
- Months 12 to 6: protect margin while you optimize. Cut unprofitable SKUs and renegotiate vendor terms with a scalpel, not a chainsaw. Do not torch the growth story to juice a quarter of EBITDA. While you are here, watch the cash drags a buyer will discount: when we review a brand sitting on 200-plus days of inventory and a long cash conversion cycle, the first recommendation is to pull inventory toward three to four months, because that trapped cash is value a buyer will not pay full price for.
- Months 12 to 6: remove yourself. Hire or promote into the roles you personally hold, document the SOPs, and let the team run for two quarters so the independence is real before diligence.
- Months 6 to 0: package the story. Build the data room, the model, and the reach-out list so that when you are ready you hit the go button: deck, data room, term sheet. A clean, driver-based package lets the buyer credit every turn you built. This is also where you should understand how ecommerce brands are valued and exactly what buyers scrutinize in a quality of earnings review before they ever do it to you.
The throughline: nothing here is cosmetic. Every lever makes the business genuinely better, so even if you never sell, you win. For the full sell-side picture, start with our ecommerce exit guide.
Methodology
Category multiple ranges and value-driver uplift estimates synthesize four 2026 M&A-advisor sources: FE International's Ecommerce M&A Trends 2026 (mainstream 3 to 6x, premium 5.5 to 8x, exceptional 7 to 9x EBITDA; omnichannel plus 15 to 25%; founder non-continuity minus 30 to 50%; organic versus paid plus 20 to 35%), Phoenix Strategy Group (DTC branded 4 to 6x EBITDA, subscription 4 to 10x ARR), ClearlyAcquired (typical 4 to 6x, large high-growth 8x or more), and the Eightx Ecommerce Due Diligence Checklist (single-channel above 60% costs 0.5 to 1.5x; customer above 25% costs 1 to 2x; owner dependence pushes 40 to 60% into earn-out; declining gross margin is the number one deal-killer). VirtueCPAs supplied the LTV-to-CAC and organic-growth premium thresholds.
The 8x to 10x band quoted in the opening is real but conditional. In practice it applies to brands pairing roughly 20% EBITDA margins with 30 to 40% year-on-year growth in a sticky category, not to a mainstream owner-run brand. We anchor the worked example to a 4.5x base and an 8x ceiling so the math stays inside the advisor consensus rather than the optimistic top of the range.
Operating, gross, and revenue-growth figures in the margin table and chart are reported figures pulled from US SEC EDGAR annual report filings via the sec-edgar tool on 2026-06-08, using the most recent annual filing per company (fiscal years ending December 2025 to March 2026). Operating margin is operating income divided by revenue, not adjusted EBITDA margin. EBITDA was not present in the XBRL facts for these filers, so we do not assert EBITDA margins from SEC data. e.l.f.'s 264% reported revenue growth reflects the Rhode acquisition consolidating into FY2026 rather than organic demand, so we flag it as acquisition-inflated rather than print the figure.
The value-driver turn figures are advisor estimates and synthesis midpoints, not measured deltas from a deal dataset, and they overlap (recurring revenue and organic growth correlate, for instance). Present and read them as a prioritization map, not an additive calculator. The compounding example is illustrative and rounded, and actual outcomes depend on category, deal size, growth quality, and buyer type.
Frequently Asked Questions
how do i increase my brand's exit multiple?
Make earnings more predictable, transferable, and scalable. Add recurring revenue, diversify channels, cut customer and owner concentration, defend gross margin, and show organic growth. Each lever is worth roughly 0.5 to 3 EBITDA turns, and you need 12 to 24 months for buyers to credit the change.
what is a good exit multiple for a dtc brand in 2026?
Mainstream DTC brands clear about 3x to 6x EBITDA in 2026, while premium brands with strong margins, retention, and diversified channels reach roughly 5.5x to 9x. The 8x to 10x band is real but reserved for brands pairing high margins with 30 to 40% growth.
does subscription revenue increase exit multiple?
Yes, and it is usually the largest single lever. Predictable recurring revenue typically adds about 1 to 3 EBITDA turns versus a comparable one-time-purchase brand, and subscription-first models are sometimes valued on ARR rather than EBITDA. Net revenue retention above 110% can justify 7x to 9x on its own.
how much does owner dependence hurt valuation?
A lot. If the founder personally runs media buying, vendor relationships, and key decisions and will not stay, buyers cut the headline 30 to 50% or push 40 to 60% of the price into an earn-out. Documented SOPs and a real management bench flip this to a small premium.
how much does amazon concentration lower my multiple?
Pulling more than 60% of revenue from a single channel, especially Amazon, typically costs 0.5 to 1.5 EBITDA turns and is named a top deal-killer. Omnichannel brands earn a 15 to 25% premium over pure e-commerce because the platform risk is spread.
is gross margin or revenue more important to buyers?
Margin quality. SEC filings show brands at near-identical gross margins landing on opposite sides of profitability, so buyers reward durable unit economics, not headline revenue. A gross-margin slide from 55% to 48% can cost 1 to 2 turns on its own.
how long before selling should i start raising my multiple?
Start 12 to 24 months out. Buyers only credit changes that have seasoned into the trailing-twelve-month numbers, so margin improvements, channel shifts, and a clean accrual close need 6 to 12 months of real results before they count.
do the value driver turns simply add together?
No. The turns compound directionally but are not strictly additive. Buyers cap valuations by category, size, and concentration risk, and they discount growth that is purely paid. Treat the turns as a prioritization map, not a calculator.