
M&A
SDE vs EBITDA: Which Multiple Applies to You in 2026
SDE is EBITDA plus the owner's pay and discretionary add-backs, used to price owner-operated ecommerce brands under roughly $1M to $2M of earnings. Above that, where a hired manager replaces the owner, buyers switch to adjusted EBITDA at a higher multiple.
Key Takeaways
- SDE = EBITDA + owner pay + discretionary add-backs. It is what a single owner-operator buyer pockets before debt service.
- The crossover from SDE to EBITDA pricing sits roughly between $1M and $2M of earnings, with brokers often using about $2M as the switch point and owner-run brands holding SDE up to ~$3M.
- Owner-operated brands trade at about 2.0x to 4.5x SDE; management-run mid-market brands trade at about 4x to 8x adjusted EBITDA.
- The switch is driven by owner dependence, not just dollars: SDE applies when the owner does the work, EBITDA when the business runs without them.
- Crossing to EBITDA is usually not a haircut: the lower earnings base is offset by a higher multiple, and above ~$2M EBITDA the EBITDA path wins decisively.
Two founders with identical $1.8M-earning brands can walk into the same broker and hear valuations $1M apart. The difference is rarely the business. It is which earnings number they quoted, and which multiple the buyer applied to it. Quote SDE when the market is pricing on EBITDA, or the reverse, and you mis-anchor broker pricing before a single line of diligence runs.
SDE and EBITDA are not interchangeable. They are different earnings bases, they carry different multiples, and the size and owner-dependence of your business decide which one applies. This is the field guide: what each number is, where the crossover sits, how add-backs behave in each, why the switch is usually not a haircut, and a worked example converting one into the other.
SDE and EBITDA are different earnings bases
EBITDA is earnings before interest, taxes, depreciation, and amortization. It strips out capital structure, tax jurisdiction, and historical capex accounting so two brands with different debt loads can be compared on the same line. Critically, EBITDA leaves the owner's salary in as an operating cost. The EBITDA definition assumes a hired manager is running the business, so their pay is a real expense.
SDE, or Seller's Discretionary Earnings, starts from EBITDA and adds the owner's pay and discretionary spending back on top. The shorthand is clean:
SDE = EBITDA + owner pay + discretionary add-backs.
The intuition: SDE approximates what a single owner-operator buyer can put in their pocket after paying the bank, because that buyer intends to do the owner's job and keep the salary. The SDE explainer frames it as the cash a one-person buyer keeps before debt service. That single difference, whether owner pay is a cost or a benefit, is the whole reason two metrics exist.
When founders ask us whether an exit gets valued on revenue, the answer we give is blunt: at this stage a buyer is looking at EBITDA or seller's discretionary earnings, which just means profit, profit plus the owner's pay and the personal spend that runs through the business. You do not get a revenue-based valuation unless you are raising venture capital. Revenue still matters, but it shows up as the velocity that lifts the multiple a buyer pays on profit, not as the base itself.
Because SDE adds money back, SDE is always the larger number for the same business. That is also why you cannot compare a 3.75x SDE multiple to a 6x EBITDA multiple dollar for dollar. Different base, different multiple.
Where the crossover actually sits
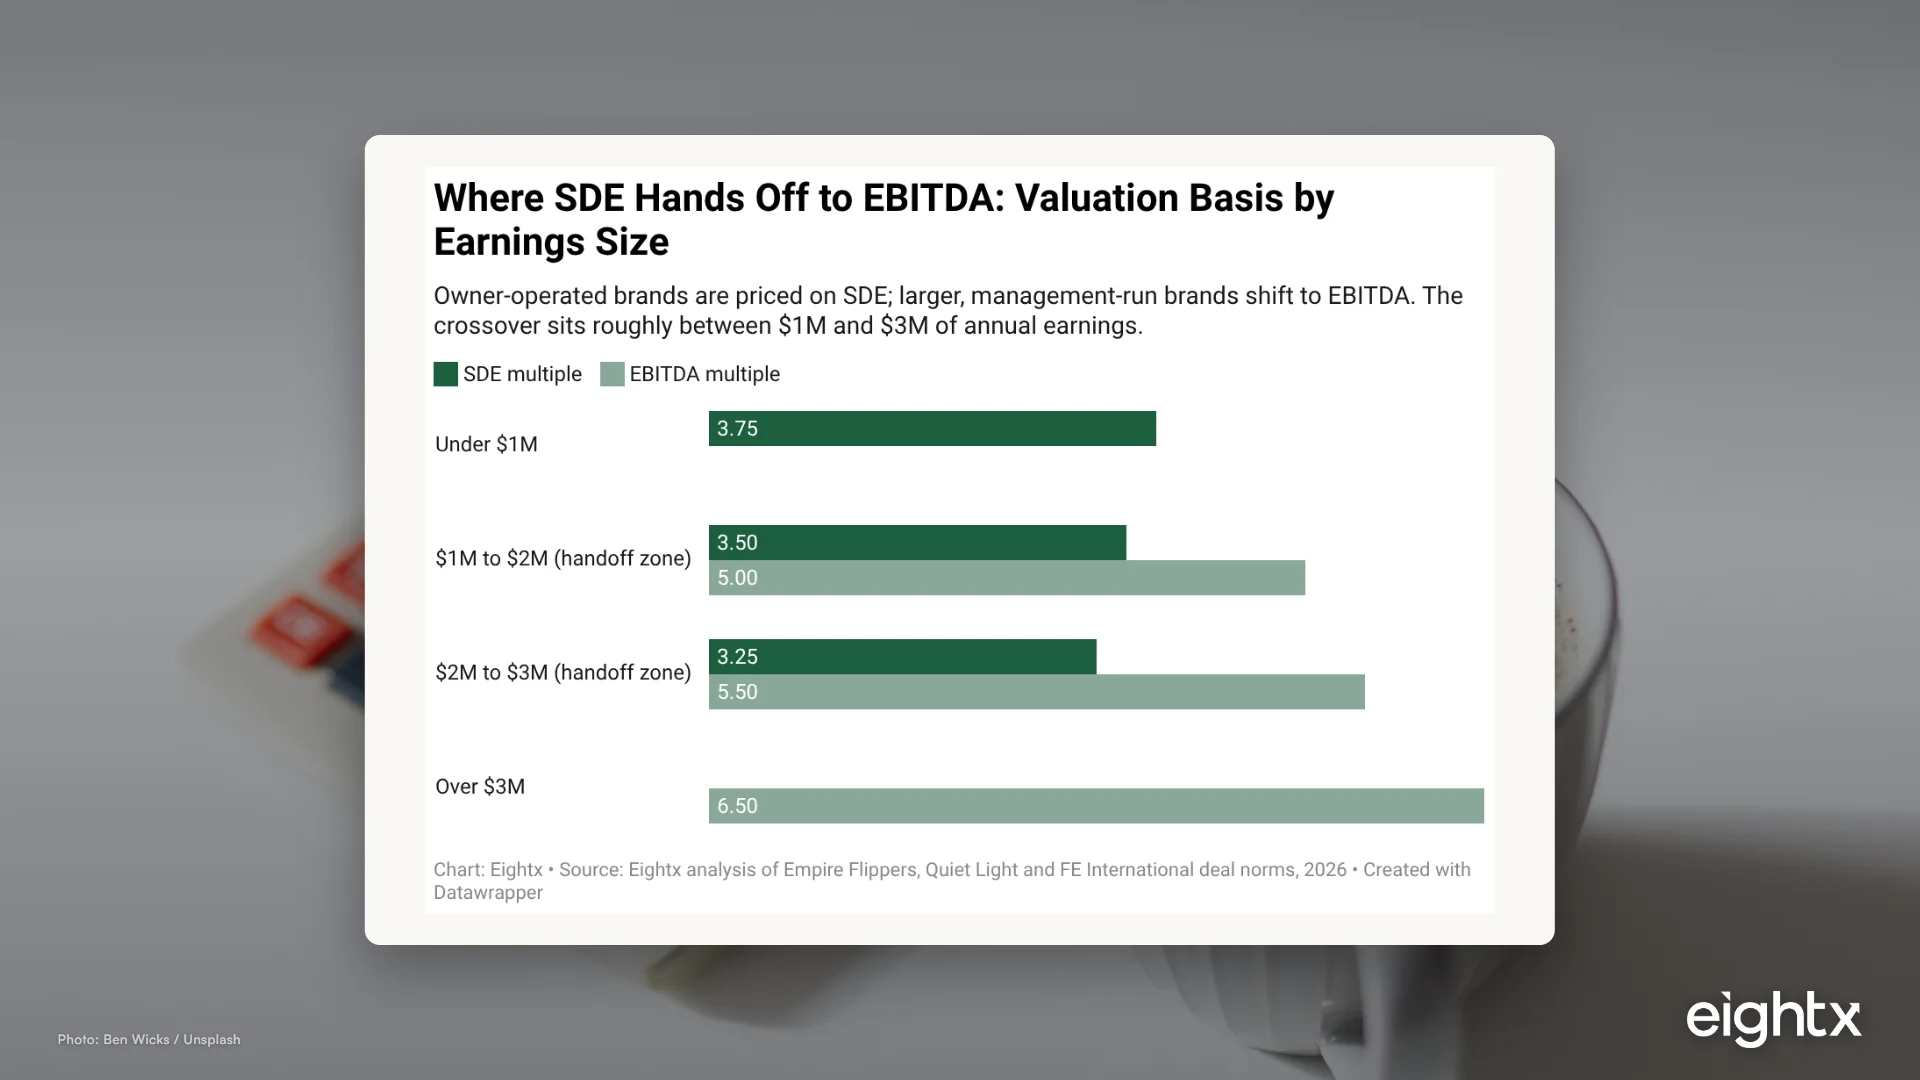
The market convention is consistent across 2026 broker data: below roughly $1M of earnings deals are priced on SDE, above roughly $2M they shift to adjusted EBITDA, and the $1M to $2M band is the handoff zone where buyers will pick the metric that best fits the business. Four independent advisors land in the same place. CT Acquisitions puts the cutoff "between $1M and $2M of earnings," Clearly Acquired uses $1M to $2M of earnings (or $3M to $5M revenue), Dream Business Brokers cites $1M to $2M a year once managers are hired, and Dew Wealth frames $3M to $7M revenue as the transition zone. Owner-run brands can hold SDE up past $2M, occasionally to about $3M, which is why the band has a soft top rather than a hard line. Private equity and strategic acquirers use adjusted EBITDA above roughly $2M EBITDA.
The dollar threshold is a rule of thumb, not a statute. The real trigger is owner dependence. Buyers use SDE while the owner's labor is part of the earnings story, and EBITDA once the business can run without the owner's day-to-day involvement. A $2.5M-earning brand still run entirely by its founder may get priced on SDE; a $1.2M brand with a full management team may get EBITDA treatment. When we talk to founders sitting right in this zone, the framing that lands is that enterprise value is multivariate: revenue growth, EBITDA, velocity, and whether the business can run without its owners all move the number, and owner dependence is the lever you control before you list.
| Earnings (SDE or EBITDA) | Primary metric | Indicative multiple | What changes here |
|---|---|---|---|
| Under $250K | SDE | 1.5x to 2.5x | Micro owner-operator; deepest founder dependence |
| $250K to $1M | SDE | 2.0x to 3.5x | Owner-operated; SDE is the default |
| $1M to $2M | SDE or EBITDA (handoff) | 3.0x to 5.0x | Metric depends on owner dependence and buyer type |
| $2M to $5M | Adjusted EBITDA | 4.5x to 7.5x | Management team assumed; PE and strategic underwrite EBITDA |
| $5M to $20M | Adjusted EBITDA | 6.0x to 9.5x | Institutional buyers; scale lifts the multiple |
| $20M+ | Adjusted EBITDA | 8.0x to 12x | Strategic and scarcity premium |
Eightx synthesis of 2026 broker matrices, principally CT Acquisitions, cross-checked against FE International, Clearly Acquired, Dew Wealth and Windsor Drake. SDE and EBITDA are different earnings bases; multiples are indicative mid-band ranges and not directly comparable across metrics.
The two-band structure is not a single broker's opinion. When you plot the SDE and EBITDA ranges that brokers actually publish, they cluster cleanly: SDE around 2x to 4x, EBITDA around 4x to 8x, with limited overlap. That is the signal that the metric switch is real and not just a re-labeling of the same multiple.
Note too that multiples climb as earnings grow even within a method. The same dollar of profit earns less in a micro deal than in a $1M-plus deal, because scale lowers a buyer's perceived risk and shortens payback. Scale lifts your multiple before you make a single operating improvement, which is part of why crossing into EBITDA territory tends to reprice a brand upward rather than down.
How add-backs work in each
Add-backs are the bridge from reported earnings to the number a buyer values off, and they work the same way in both SDE and EBITDA: only documented, truly non-recurring or non-operating items survive. The difference is what counts as an add-back at all. Owner salary is the dividing line. In EBITDA, normalizing founder pay above market rate is an add-back you must justify with benchmarks. In SDE, the entire owner salary is added back by definition, because the model assumes the buyer replaces the owner.
The add-backs guide lays out what survives Quality of Earnings scrutiny:
| Add-back | Survives diligence? |
|---|---|
| Owner compensation normalization | Yes, with market comp benchmarks |
| One-time legal or settlement | Yes, if truly one-time and documented |
| M&A advisory and transaction fees | Yes, clearly non-operating |
| Founder lifestyle expenses (vehicles, family travel) | Yes, if documented as truly personal |
| One-time marketing tests | Usually rejected, they look recurring on review |
| Discontinued-line inventory write-down | Split: one-time portion survives, recurring obsolescence rejected |
Add-backs typically run about 15 to 40 percent of reported earnings in current mid-market deals, in either direction. The Quality of Earnings team scores each line Accept, Accept with reduction, or Reject, and they have 24 to 36 months of general-ledger detail to test recurrence. The pattern we see again and again is that the most expensive mistake is claiming a "one-time" item that turns out to recur quarterly. That single red flag colors the rest of your bridge. The fix is unglamorous: before you list, change the books to an accrual basis so each period reflects what actually happened, then build the SDE add-back schedule for the last two or three years off that clean general ledger rather than scrambling for it mid-diligence.
Worked example: converting SDE to EBITDA
Take the $1.2M revenue Shopify brand from the SDE explainer. Reported net income is $360K. The owner pays themselves a $120K salary plus $18K in health and retirement. During the year they ran a $22K trademark dispute through legal, $14K of personal travel and meals through the business, and booked $8K of depreciation on warehouse racking.
Building SDE: $360K net income + $120K owner pay + $18K owner benefits + $22K one-time legal + $14K personal travel + $8K depreciation = $542K SDE. At a mid-band 3.75x Shopify multiple, indicative enterprise value is about $2.03M.
Converting to EBITDA: strip the owner's pay back out, because EBITDA treats it as a real cost. Start from net income, add back interest, taxes, and D&A, then add only the defensible non-owner adjustments. Assume zero interest and that the $360K is pre-tax, so EBITDA is roughly net income $360K + $8K depreciation = $368K reported EBITDA. The defensible add-backs (one-time legal $22K, personal travel $14K, and owner over-market pay, the $22K the $120K salary sits above a $98K market GM rate) bridge to about $426K adjusted EBITDA.
This is exactly the math brokers ask founders to do. They will say, in effect, give us your net net profit and then add back salaries and other discretionary expenses, and what you get is the SDE number. The gap between the two bases is the owner's market-rate pay, which EBITDA keeps as a cost and SDE returns to the seller.
Founders fear the switch as a markdown. It usually is not. Run the crossover at a clean $1M SDE: a buyer paying a hired GM about $350K leaves roughly $650K of adjusted EBITDA. Price the SDE at 3x and you are at $3.0M; price the EBITDA at 5x and you are at $3.25M. Same business, different path, roughly the same number, and once you push past about $2M EBITDA the higher multiple pulls the EBITDA path decisively ahead.
At this size you would still quote and be priced on the $542K SDE. The EBITDA figure only becomes the headline once this brand grows past the handoff zone and a hired GM is doing the founder's job. If you want the full mechanics of how brands move between these bases as they scale, see how ecommerce brands are valued.
What to do about it
- Pin down which base applies to you. If your earnings are under about $1M, build your story on SDE. Over about $2M with a real team, build it on adjusted EBITDA. In the $1M to $2M zone, model both and know which one your likely buyer set uses.
- Be honest about owner dependence. If the business cannot run without you for a month, you are an SDE business regardless of size. Reducing owner dependence is what earns the EBITDA premium, and it is the slowest lever to move, so start early. What we tell founders aiming for the EBITDA band is that you have to prove to the acquirer that the business has systems and processes and runs without you: documented standard operating procedures, a second-in-command, and a quarterly planning rhythm the team owns.
- Document add-backs before you list, not during diligence. Keep vendor invoices and board minutes for every one-time item. An add-back you cannot prove is an add-back you lose.
- Never quote a "one-time" expense that recurs. Pull 24 to 36 months of GL yourself first and remove anything that shows a pattern. The buyer will find it, and finding it costs you credibility on the whole bridge.
- Pull the levers that lift the multiple. Growth above 15 percent year over year, channel diversification, and three years of clean financials each move you within the band. The same work that lifts the multiple is the work that pushes you across the crossover into EBITDA pricing. See increase exit multiple for the full lever list.
Related reading. For how founder comp swings the earnings a buyer actually pays for, see how founder pay subsidizes your P&L.
Sources and methodology
The crossover threshold, the multiple bands, and the not-a-haircut nuance were triangulated across three layers in June 2026: a founder-call corpus for operator framing, web-cited broker guidance via Perplexity, and a deep primary-source task via Parallel.ai. The numbers below are advisor-published indicative ranges, not transaction-level audited data.
The roughly $1M to $2M crossover band is corroborated by four independent 2026 sources: CT Acquisitions ("the cutoff generally sits between $1M and $2M of earnings"), Clearly Acquired ($1M to $2M earnings or $3M to $5M revenue), Dream Business Brokers ($1M to $2M a year once managers are hired), and Dew Wealth ($3M to $7M revenue as the transition zone). A separate Parallel.ai task independently landed on "$1 million and $2 million." We keep a soft top of about $3M because owner-run brands can hold SDE past $2M.
The SDE band of about 2.0x to 4.5x reflects FE International (about 2.5x to 4.5x for online businesses), Dew Wealth (2x to 4x), Clearly Acquired (2x to 3.5x), CT Acquisitions (2.0x to 3.5x for $250K to $1M SDE), and the Sofer Advisors retail study (2.51x to 3.19x). The adjusted EBITDA band of about 4x to 8x-plus reflects the CT Acquisitions matrix ($2M to $5M earnings at 4.5x to 7.5x; $5M to $20M at 6.0x to 9.5x), Dew Wealth (4x to 8x-plus), Clearly Acquired (4x to 7x-plus), Windsor Drake (3.0x to 6.0x mid-sized, extending to 6.0x to 10.0x-plus when scaled), and VirtueCPAs (3.5x to 6.5x).
The add-back range of about 15 to 40 percent of reported earnings comes from nStar Finance ("normalization adjustments routinely move reported earnings by 15% to 40% in either direction"), corroborated by Parallel.ai. The add-back survival table reflects 2026 Quality of Earnings practice, where each line is scored against 24 to 36 months of general-ledger detail.
The internal multiple framing, the SDE versus EBITDA threshold, and the worked example also draw on Eightx explainers on SDE, EBITDA, and EBITDA add-backs. Two caveats matter: multiples are indicative mid-band ranges that vary by category, growth, and channel mix, and SDE and EBITDA are different earnings bases whose multiples are not directly comparable dollar for dollar. The crossover-is-not-a-haircut figures are an Eightx-constructed illustration, labeled as such.
Frequently Asked Questions
what is the difference between sde and ebitda?
EBITDA is earnings before interest, taxes, depreciation, and amortization, and it leaves the owner's salary in as a cost. SDE adds the owner's pay and discretionary expenses back on top of EBITDA, because a single owner-operator buyer plans to do that work and keep the pay.
at what point do buyers switch from sde to ebitda?
Roughly between $1M and $2M of annual earnings, with many brokers using about $2M as the switch point and owner-run brands holding SDE up to about $3M. The real trigger is owner dependence: SDE applies while the owner does the work, EBITDA once a hired manager can run the business.
is sde or ebitda higher?
For the same business, SDE is always the larger number because it includes owner pay and discretionary add-backs that EBITDA leaves as costs. That is why you cannot compare an SDE multiple and an EBITDA multiple dollar for dollar.
does switching from sde to ebitda lower my valuation?
Usually no. The lower EBITDA earnings base is offset by a higher multiple. A $1M SDE brand at 3x is about $3.0M, and the same brand at 5x its ~$650K adjusted EBITDA is about $3.25M. Above roughly $2M EBITDA the EBITDA path produces a materially higher number.
how do add-backs work in sde and ebitda?
Both build an adjusted number by adding documented, non-recurring or non-operating items back to reported earnings. Owner over-salary, one-time legal, and transaction fees usually survive; recurring marketing tests and ongoing obsolescence usually get rejected in Quality of Earnings review.
how much do add-backs usually add to my earnings?
In current mid-market deals, normalization adjustments commonly move reported earnings by about 15 to 40 percent. The cleaner your books and the better documented your one-time items, the more of that survives a Quality of Earnings review.
what multiple does an ecommerce brand sell for in 2026?
Owner-operated brands generally trade at about 2.0x to 4.5x SDE depending on category, while management-run mid-market brands trade at about 4x to 8x adjusted EBITDA. Growth, channel diversification, and clean financials move you within those bands.
can i use both sde and ebitda to value my brand?
In the $1M to $2M handoff zone, yes, and sophisticated buyers often look at both. Below the zone SDE dominates, above it EBITDA dominates. The mistake is quoting the wrong base for your size, which mis-anchors the whole negotiation.