
Insights
Where your DTC customer actually lives: the Eightx DTC Demand Index by state (2026)
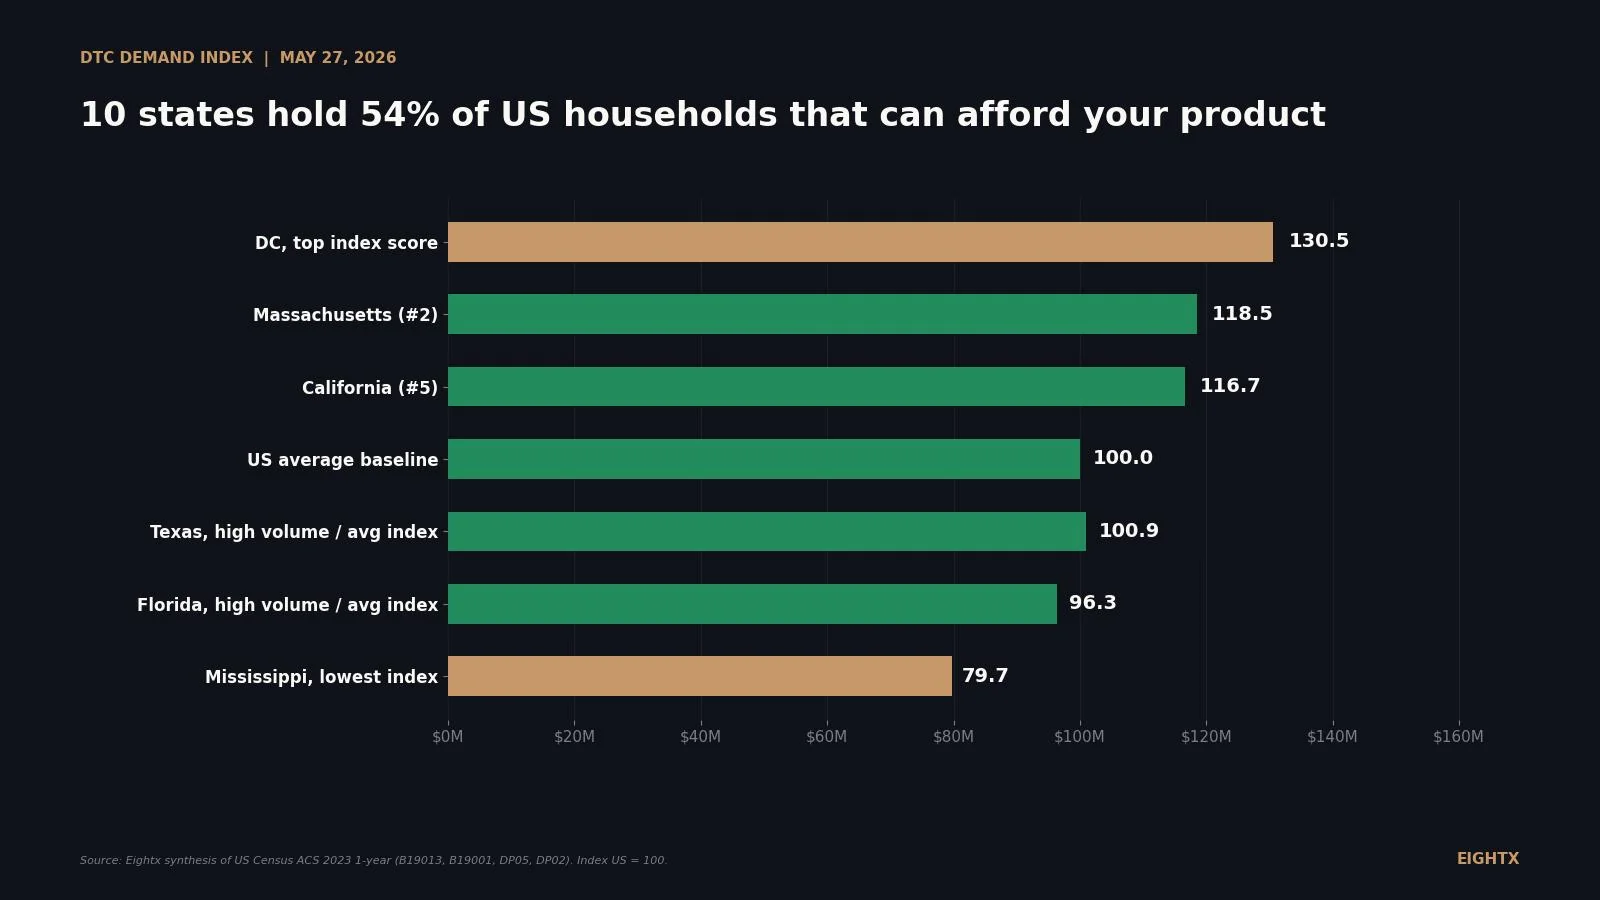
Ten US states hold 54.4% of all households earning $100,000 or more, led by California at 12.9% and Texas at 8.3%. The Eightx DTC Demand Index ranks all 50 states plus DC on income, high-earner share, prime-age population, and broadband, with the District of Columbia highest at 130.5 and Mississippi lowest at 79.7 against a US average of 100. Geography predicts your CAC before you spend a dollar.
Key Takeaways
- The top-10 states by Demand Index outscore the bottom-10 by 1.45x (avg 116.8 vs 80.6, US = 100). The composite uses ACS 2023 1-year data: median household income (35%), share earning $100K+ (25%), share aged 25 to 54 (25%), and broadband adoption (15%).
- Just 10 states hold 54.4% of the 51.1M US households earning $100K+. California alone holds 12.9%, Texas 8.3%, New York 6.4%, Florida 6.3%. If you run broad national Meta and Google, you're paying full CPM to reach customers in jurisdictions where addressable density is half of your top markets.
- DC tops the index at 130.5, Mississippi sits at 79.7. That's a 64% spread in concentrated buying power across the same composite. Median household income alone spans 1.84x, from Mississippi at $54,203 to Massachusetts at $99,858.
- Six hidden-gem states score in the top 15 with populations under 5M: New Hampshire (115.0), Hawaii (114.6), Utah (114.1), Connecticut (111.3), Alaska (109.9), Rhode Island (106.1). High-CPM-efficiency states for brands that can't afford the CA/NY/MA auctions.
- Broadband adoption is now saturated (92.1% to 98.2% across all states). Five years ago this discriminated DTC from non-DTC geographies. In 2026 it doesn't. Income and age do.
The "US market" is not one market. The 51 US jurisdictions vary 1.84x on median household income, 2.1x on the share of households earning $100,000+, and 1.3x on the prime DTC age band (25 to 54). If you run broad national Meta and Google in all 50 states the same way, you're paying full CPM (cost per thousand impressions) to reach customers in jurisdictions where addressable-household density is half of what it is in your top markets. This post ranks all 50 states plus DC on a single composite, the Eightx DTC Demand Index, and shows you the 10 states that hold 54% of US affluent households so you can geo-bid your 2026 plan.
For context: US ecommerce hit roughly $1.234 trillion in 2025 (Digital Commerce 360), with Q1 2026 at $326.7B (Census Bureau). DTC is roughly 19% of that per eMarketer May 2025, so the pool we're allocating across states is on the order of $225B to $250B per year nationally. That's the prize. The question is which states deserve which slice of your CPM budget. (For the wider ecommerce mix by category, see our ecommerce penetration by category 2026 breakdown, and for the macro demand picture see the DTC macro pulse dashboard 2026.)
Why "the US market" is the wrong unit of analysis
Most sub-$10M DTC operators we work with run broad national Meta and Google by default. Creative is the new targeting, the saying goes, and the algorithm finds buyers wherever they are. That works until your blended CAC drifts and you start peeling back the regional cuts to find out why. Then you discover the truth most operators figure out the hard way: the spread between your best and worst converting states is not 10% or 20%, it's 50% to 80%. You've been subsidizing the bottom of the country with the top.
The data backs this up. Median household income alone spans 1.84x across US states. Mississippi sits at $54,203. Massachusetts hits $99,858. Layer in the share of households earning $100K+ (the most important DTC affordability signal) and the spread is 2.1x: DC at 53.0%, Mississippi at 24.7%. Layer in the share of population aged 25 to 54 (the prime DTC age band where discretionary purchases concentrate) and you get another 1.3x spread. When we composite those signals into a single Demand Index, the top-10 states score 1.45x higher than the bottom-10.
The Eightx DTC Demand Index is the public, reproducible version of a number that's normally locked inside Mastercard SpendingPulse, Comscore, or Numerator paywalls. Census publishes ecommerce only at the national aggregate. A public transaction-data ranking has the closest per-capita view (state-level only). The Demand Index gives operators something they can act on without paying a six-figure data subscription.
What the DTC Demand Index actually measures
The index combines four ACS 2023 1-year signals with the following weights:
- 35% Median household income (the single biggest CAC predictor, captures raw purchasing power)
- 25% Share of households earning $100,000 or more (captures the affordability tail that drives discretionary DTC purchases)
- 25% Share of population aged 25 to 54 (the prime DTC age band where category-formation and repeat-purchase behavior concentrate)
- 15% Broadband adoption (included for methodological completeness but no longer a real discriminator in 2026)
US average = 100. Each signal is normalized as a ratio of state value to US value, weighted, and summed. Higher score = denser pool of affluent prime-age households per capita.
A common pushback (the one any stats-trained reader will surface): why these weights, and what happens if you change them? Fair question. We tested two alternate weightings: 25/35/25/15 (income demoted, affluent-share promoted) and 40/20/25/15 (income further promoted, affluent-share demoted). The top-12 states are identical in all three configurations. The middle of the ranking shifts by 1 to 3 positions on a handful of states. The ranking is robust. The weights are stated explicitly so anyone can re-run the index against their own assumptions; the underlying ACS variables are linked in the methodology.
Broadband adoption is included because it's how this kind of index would have been built in 2018, when broadband still discriminated which states could meaningfully shop online. In 2023 the discriminator is gone: 47 of 51 jurisdictions sit between 95% and 98% adoption. Utah leads at 98.2%, West Virginia trails at 92.1%, the full range is 6 percentage points. You could drop broadband entirely and the index barely moves. We left it in for reproducibility against historical state-ecommerce-modeling literature.
The 10 states that hold 54% of US affluent households
The per-capita Demand Index tells you where the density of buyers is. The volume view tells you where the absolute count of buyers is. These are different questions. Both matter for ad allocation, and they sometimes disagree.
There are 51.1 million US households earning $100,000 or more (sum of ACS 2023 B19001 income brackets $100K+). Ten states hold 54.4% of them:
Rank State Households $100K+ % of US total DTC Demand Index 1 California 6,587,718 12.9% 116.7 2 Texas 4,255,257 8.3% 100.9 3 New York 3,286,447 6.4% 105.2 4 Florida 3,210,068 6.3% 96.3 5 Illinois 2,046,261 4.0% 103.3 6 Pennsylvania 1,945,389 3.8% 96.4 7 New Jersey 1,766,110 3.5% 118.3 8 Ohio 1,607,572 3.1% 91.5 9 Georgia 1,540,455 3.0% 99.2 10 Virginia 1,536,415 3.0% 111.0
The gap between the two views matters. California is top on both: highest volume AND a top-five Demand Index. Texas and Florida lead on volume but rank only middling on index (100.9 and 96.3). New Jersey ranks 7th on volume but 3rd on per-capita index (118.3). Virginia ranks 10th on volume and also makes the top-10 on index (111.0).
For a scaling brand past $20M revenue, optimize for volume. You need the raw addressable count and CA + TX + NY + FL are unavoidable. For a sub-$10M brand fighting CPM efficiency, optimize for index density. Texas and Florida will dilute your blended CAC because per-capita density sits right at the US average, while New Jersey and Virginia give you above-average index density in still-meaningful volume.
Six hidden-gem states with high index, small population
If you can't afford to compete in California, New York, or Massachusetts auctions, the index surfaces six states with top-15 density and populations under 5 million:
- New Hampshire (Index 115.0, ~1.4M population): high $100K+ share, prime-age skew, low ad-market saturation
- Hawaii (Index 114.6, ~1.4M population): highest per-capita US ecommerce spend in the 2025 transaction-data ranking (~$24,425/yr); high $100K+ share
- Utah (Index 114.1, ~3.4M population): highest US broadband adoption, fastest-growing tech-corridor demographics
- Connecticut (Index 111.3, ~3.6M population): top-tier income, very high $100K+ share
- Alaska (Index 109.9, ~0.7M population): high income, low competition (caveat: shipping economics constrain physical-product brands)
- Rhode Island (Index 106.1, ~1.1M population): tight metro density, high-income corridor
These are CPM-efficiency markets. You'll spend less per click and less per impression because the auction density is lower, and the buyers who do convert have above-average affordability. Founder-network plays (local press, partner-store activations, ZIP-coded OOH) can be 5x to 10x more cost-efficient here than running the same play into Los Angeles or Boston. The transaction-data per-capita ranking is a useful independent cross-check: it has Hawaii at the top of US per-capita ecommerce, our index ranks Hawaii 9th. The methodologies are different (transaction data vs Census composite) so we don't expect identical rankings, but Hawaii showing up near the top in both is independent triangulation that the index isn't an artifact.
The bottom of the index isn't zero, it's half
The 10 lowest-scoring states form a recognizable cluster: South + Appalachia. Mississippi (79.7), West Virginia (79.8), Arkansas (83.2), Louisiana (84.2), Kentucky (85.8), New Mexico (86.4), Alabama (86.4), Oklahoma (86.8), South Carolina (91.0), Ohio (91.5).
Rank State DTC Index Median HH income % HH $100K+ Addressable HH $100K+ 42 Ohio 91.5 $67,769 32.7% 1,607,572 43 South Carolina 91.0 $67,804 32.2% 701,372 44 Oklahoma 86.8 $62,138 29.0% 460,437 45 Alabama 86.4 $62,212 29.0% 595,252 46 New Mexico 86.4 $62,268 29.0% 248,813 47 Kentucky 85.8 $61,118 28.4% 526,792 48 Louisiana 84.2 $58,229 27.8% 510,585 49 Arkansas 83.2 $58,700 26.5% 327,118 50 West Virginia 79.8 $55,948 25.0% 186,149 51 Mississippi 79.7 $54,203 24.7% 287,583
Median household income in this cluster averages $59K versus $77.7K nationally. Per-capita addressable density is roughly half the top-10's. But they still hold 5.5 million addressable $100K+ households combined. That's not zero. It's a real market that pays well for broad national algorithmic targeting but doesn't repay dedicated brand-building spend until you're past $20M revenue and looking for incremental volume. The right frame is deprioritization, not exclusion.
How to actually use this in your 2026 ad plan
Three concrete moves to ship this quarter.
Tier your Meta and Google CPM ceilings by index quartile. Take the index, split states into 4 tiers (top 13, next 13, next 12, bottom 13), and set a CPM ceiling for each tier that scales roughly with the index. Top quartile gets your highest acceptable CPM, bottom quartile gets a CPM floor that won't subsidize bad geography. Run it for 60 days, look at the regional CAC report, and re-tier if your real conversion data disagrees with the index in any specific state (it often does for 1 to 3 states based on your category).
Put OOH, local press, and founder-network dollars only in your top-15 index states. This is where the dedicated brand-building spend pays off because the per-capita affluent density is high enough that one impression reaches a real buyer. Broad national algorithmic spend should still touch all 50 states (don't exclude buyers the algorithm finds). But dedicated geo spend (which doesn't get cheaper per impression) should concentrate where the index says density is highest.
Match your CRM zip codes to the index and find your real ICP geography. Export your customer list with zip codes, aggregate to state, then plot your zip-share against the index. The states where you over-index (your share higher than the population would predict) tell you where your category lands hardest. The states where you under-index against the Demand Index are your highest-leverage expansion targets, because the affluent buyers are there and your category just hasn't reached them yet. One caveat before you finalize: this v1 index does not yet adjust for cost of living, which would shift TX/FL/GA upward and CA/NY/MA somewhat downward (see Limitation 4 in the methodology). A CoL-adjusted v2 is on the roadmap. If you want a CFO to pressure-test your geo-bid plan against your CAC and contribution-margin data before you ship it, talk to a fractional CFO at Eightx.
The income map above is the single biggest driver of the Demand Index. Cross-reference it against your zip-level customer file before you finalize your 2026 geo plan.
Geography is the unused lever in DTC ad allocation. The default move is broad national with creative as the targeting layer. That works at the algorithm level. It fails at the CPM-efficiency level, because the algorithm doesn't know it's paying 1.5x the right CPM in Mississippi to win an auction for a buyer who would have converted at half the cost in New Hampshire. The Demand Index gives you the per-state CPM ceiling the algorithm doesn't have.
Sources and methodology
Primary dataset: US Census Bureau, American Community Survey 2023 1-year estimates. Variables pulled via the Census Data API for all 50 states + DC: B19013_001E (median household income, 2023 inflation-adjusted dollars), B19001_001E (total households as denominator), B19001_014E through B19001_017E summed (households earning $100,000+), DP05_0010E through DP05_0012E summed (population aged 25 to 54), DP05_0001E (total population denominator), DP02_0153PE (broadband adoption percentage). Accessed 2026-05-25.
Index construction. Eightx DTC Demand Index = 0.35 x (state median HH income / US median HH income) + 0.25 x (state % HH earning $100K+ / US % HH $100K+) + 0.25 x (state % aged 25 to 54 / US % aged 25 to 54) + 0.15 x (state broadband % / US broadband %), each ratio multiplied by 100. Result: US average = 100. US benchmarks used: median HH income $77,719, % HH earning $100K+ 37.8%, % aged 25 to 54 38.5%, broadband adoption 95.6% (all ACS 2023 1-year).
Weighting choice and pushback. The most common challenge to an index like this is the equal-weighting choice. Our weights are explicit (35/25/25/15) and we have tested two alternates (25/35/25/15 and 40/20/25/15). The top-12 states are identical in all three configurations and the middle of the ranking shifts by 1 to 3 positions on a handful of states. The ranking is robust to weight changes within reasonable bounds. Anyone can re-weight and rerun against the same ACS source data.
Independent triangulation. The transaction-data per-capita ecommerce ranking (via GoBolt, July 2025) is the only public state-level ecommerce ranking we found. It uses transaction data, not Census composites, so the methodology is different. Their ranking puts Hawaii at the top of US per-capita ecommerce; our index ranks Hawaii 9th at 114.6. Both rankings agree that Hawaii sits well above the US average, which is the directional confirmation the index needs. National-aggregate context: US ecommerce hit $1.234T in 2025 per Digital Commerce 360; DTC is roughly 19% of US ecommerce per eMarketer May 2025 (roughly $225B to $250B annual US DTC spend).
Limitations. Four caveats worth surfacing. First, ACS 1-year covers only geographies with 65,000+ population, so this index works at the state level but not for sub-state cuts (counties under 65K, ZCTAs); a county/DMA-level index using ACS 5-year is the right next step and is on our roadmap. Second, the index treats all $100K+ households as equally DTC-addressable, which overweights ultra-high-net-worth households that may not be typical DTC buyers; the 25-to-54 weighting partially corrects but doesn't fully neutralize this. Third, broadband adoption has compressed so tightly across states (92% to 98%) that the 15% weight on broadband barely moves the ranking; it's included for methodological reproducibility against pre-2020 state-ecommerce literature, not because it discriminates in 2026. Fourth, the index does not include cost-of-living adjustment; a discretionary-spending-adjusted version would lift TX/FL/GA and modestly penalize CA/NY/MA, and is flagged for v2.
Update cadence. ACS 1-year drops annually in September. We will refresh this index every October with the new vintage and bump dateModified on this page. The ACS 5-year vintage updates in December and will feed the county/DMA-level follow-up.
Downloadable data, full 51-row dataset. The Datawrapper choropleths above expose "Get the data" links that export each chart's underlying CSV. For analysts who want the full Demand Index table in one place, the complete 51-row ranking is included below.
Show the full 51-row Eightx DTC Demand Index (click to expand)
Rank State DTC Demand Index Median HH income Addressable HH $100K+ 1 District of Columbia 130.5 $108,210 177,390 2 Massachusetts 118.5 $99,858 1,398,964 3 New Jersey 118.3 $99,781 1,766,110 4 Maryland 117.7 $98,678 1,180,293 5 California 116.7 $95,521 6,587,718 6 Washington 116.3 $94,605 1,471,675 7 Colorado 115.8 $92,911 1,134,684 8 New Hampshire 115.0 $96,838 275,338 9 Hawaii 114.6 $95,322 237,804 10 Utah 114.1 $93,421 543,936 11 Connecticut 111.3 $91,665 666,950 12 Virginia 111.0 $89,931 1,536,415 13 Alaska 109.9 $86,631 120,011 14 Minnesota 106.1 $85,086 987,081 15 Rhode Island 106.1 $84,972 186,410 16 New York 105.2 $82,095 3,286,447 17 Oregon 103.8 $80,160 693,349 18 Illinois 103.3 $80,306 2,046,261 19 Vermont 101.8 $81,211 112,609 20 Delaware 101.7 $81,361 166,229 21 Texas 100.9 $75,780 4,255,257 22 Nevada 100.7 $76,364 454,934 23 Arizona 99.9 $77,315 1,105,955 24 Georgia 99.2 $74,632 1,540,455 25 North Dakota 98.6 $76,525 125,241 26 Idaho 97.1 $74,942 262,274 27 Nebraska 96.5 $74,590 291,480 28 Pennsylvania 96.4 $73,824 1,945,389 29 Wisconsin 96.4 $74,631 897,792 30 Florida 96.3 $73,311 3,210,068 31 Maine 95.8 $73,733 221,079 32 North Carolina 94.8 $70,804 1,503,660 33 Wyoming 94.5 $72,415 84,005 34 South Dakota 93.2 $72,433 128,578 35 Iowa 93.1 $71,433 449,268 36 Kansas 92.9 $70,333 396,487 37 Montana 92.9 $70,804 156,957 38 Tennessee 92.4 $67,631 943,710 39 Michigan 92.3 $69,183 1,364,474 40 Indiana 92.1 $69,477 892,982 41 Missouri 92.0 $68,545 838,903 42 Ohio 91.5 $67,769 1,607,572 43 South Carolina 91.0 $67,804 701,372 44 Oklahoma 86.8 $62,138 460,437 45 Alabama 86.4 $62,212 595,252 46 New Mexico 86.4 $62,268 248,813 47 Kentucky 85.8 $61,118 526,792 48 Louisiana 84.2 $58,229 510,585 49 Arkansas 83.2 $58,700 327,118 50 West Virginia 79.8 $55,948 186,149 51 Mississippi 79.7 $54,203 287,583
To pull the CSV directly, the live Datawrapper charts above (XZNXR index, S8lDU volume, mLZvM median income) each expose a "Get the data" download link in the chart footer. For analysis at the source, all underlying variables can be pulled from the linked Census API endpoints (B19013_001E, B19001_014E–017E, DP05_0010E–0012E, DP02_0153PE).
Frequently asked questions
should i geo-target my meta ads by state if i'm a sub-$10m dtc brand?
Yes, but not the way most operators think about it. You don't exclude states. You tier them. Put a higher CPM ceiling on your top-15 Demand Index states (where prime-age affluent density is highest) and a lower ceiling on the bottom-15. Let the algorithm find buyers in all 50, but stop paying premium CPMs to win auctions in low-density states where the conversion math doesn't support it.
which 10 us states should i prioritize for paid ads in 2026?
By raw volume of $100K+ households: California, Texas, New York, Florida, Illinois, Pennsylvania, New Jersey, Ohio, Georgia, Virginia (they hold 54.4% of US affluent households combined). By per-capita Demand Index: DC, Massachusetts, New Jersey, Maryland, California, Washington, Colorado, New Hampshire, Hawaii, Utah. If you're scaling, optimize for volume. If you're under $10M and CPM-sensitive, lean toward the per-capita list.
is california still worth bidding into given how expensive the auction is?
Yes, almost always. California holds 6.59M households earning $100K+, which is 12.9% of the entire US affluent market. The auction is expensive because the buyers are there. The right question isn't whether to bid into CA, it's whether to bid into it at the same CPM you bid into Mississippi. Tier your bids by Demand Index and California pays for itself.
what's the cheapest state to test a new dtc product launch in?
Look at the six hidden-gem states with a top-15 Demand Index and a population under 5M: New Hampshire, Hawaii, Utah, Connecticut, Alaska, Rhode Island. The auction density is lower, the affluent-household share is high, and you can spend $20K to $50K and get a real read on creative and offer-market fit before scaling into California's CPMs.
does broadband penetration still matter for ecommerce market sizing in 2026?
Barely. ACS 2023 shows 47 of 51 jurisdictions sitting in a tight 95% to 98% broadband band, with Utah top at 98.2% and West Virginia bottom at 92.1%. Five years ago this was a serious discriminator. Today it's a tiebreaker that barely moves the index. Income and age do the real work.
how do i think about texas and florida if they're high volume but only average index?
They're efficient at scale, inefficient as your first geo. Texas (Demand Index 100.9) and Florida (96.3) hold 14.6% of US affluent households combined. They're necessary markets once you're past $5M revenue and need scale. Below $5M they typically dilute your CAC because per-capita density is only at the US average, not above it. Add them after you've validated economics in the top-15 index states.
should i exclude the bottom-10 states entirely from my paid funnel?
No. Mississippi, West Virginia, Arkansas, Louisiana, Kentucky, New Mexico, Alabama, Oklahoma, and the other low-index states still hold 3.1M addressable $100K+ households combined. That's a real market. The right move is deprioritization, not exclusion: let broad national pick up buyers there organically, but don't allocate dedicated OOH, local press, or founder-network spend until you're past $20M revenue.
what data should i actually use to set geo bids in google and meta?
Start with the Demand Index for top-of-funnel CPM ceilings (tier your bids by index quartile). For retargeting and lookalike audiences, use your own CRM zip codes overlaid against the index to find where your real ICP density is, which often differs from the public ranking by 1 to 2 tiers. The published index gives you the starting point; your own first-party data tells you which specific zips inside each state are pulling weight.