
Insights
Holiday demand predictor: 10 years of Census MRTS data on Q4 lift by category
Q4 lift is not uniform across categories. Census MRTS data across ten years shows sporting goods and electronics spike hard while furniture and home furnishings barely move. Enter your category and baseline revenue to see your statistical Q4 lift range before you commit to inventory and ad spend.
Key Takeaways
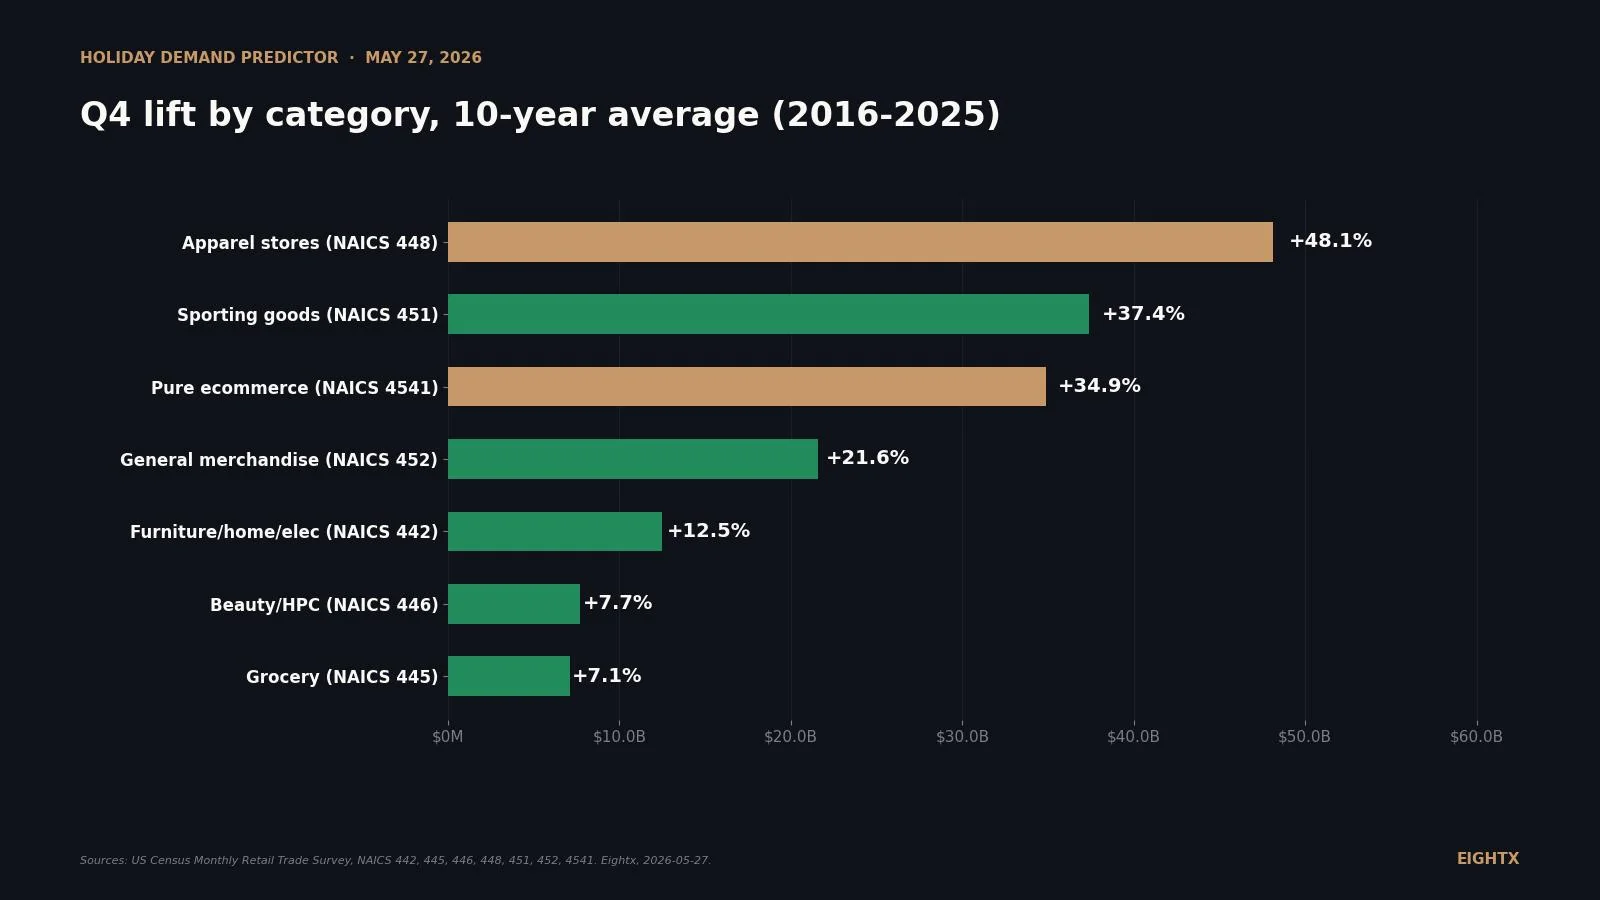
- Apparel stores average a 48.1% Nov-Dec lift over their Jan-Oct baseline across 2016-2025 (US Census MRTS, NAICS 448). The most predictable Q4 category in retail. Range 42-49% in every non-COVID year.
- Pure ecommerce (NAICS 4541) has compressed from a 45% Q4 lift in 2017 to 27.5% in 2025. The channel matured. If you still plan to 2015-2017 lift multipliers, you are over-ordering inventory.
- Grocery and beauty lift only 7.1% and 7.7% in Nov-Dec. These are everyday-consumption categories. There is no inventory pre-positioning story for personal care or food and beverage.
- The category spread is 7x: 48% (apparel) vs 7% (grocery). A one-multiplier holiday plan systematically over-stocks low-lift categories and under-stocks apparel, sporting goods, and ecom.
- Best case: 2x last year's units. Not 3x. If your 2026 Q4 plan exceeds the 10-year max for your category, you are forecasting above any year in the last decade and you are building speculative inventory.
Most DTC founders plan Q4 by feel. They take last year's holiday number, add a YoY growth assumption, and order inventory to a "we usually do 30% of revenue in Nov-Dec" mental model. That mental model is wrong, because the 30% multiplier is not your number. It is the headline retail average. Your actual Q4 lift depends on your category, and the spread between categories is enormous. Ten years of US Census Monthly Retail Trade Survey (MRTS) data, 2016 through 2025, shows apparel lifts 48% in Nov-Dec while grocery lifts 7%. That is a 7x spread. A single-multiplier holiday plan systematically over-stocks low-lift categories and under-stocks the high-lift ones.
This post gives you (a) the 10-year benchmark by category, (b) the trend showing how each category's lift has moved, and (c) a calculator that turns your trailing-12-month (TTM) revenue into predicted Nov-Dec dollars, inventory cost to pre-position, and the late-October cash you need available.
The 10-year Q4 lift by category
We pulled monthly retail sales (NAICS-level, not seasonally adjusted) from the US Census MRTS API for every year from 2016 to 2025. For each category and year we calculated Q4 lift as the average of November plus December monthly sales divided by the average of January through October monthly sales, minus 1. Then we averaged those 10 annual lifts.
Apparel leads the table at 48.1%. Sporting goods, hobby, book, and music stores (NAICS 451) come next at 37.4%. Pure ecommerce (NAICS 4541, electronic shopping and mail-order houses, which includes Amazon) averages 34.9%. General merchandise (NAICS 452, department stores plus warehouse clubs and supercenters) sits at 21.6%. Furniture, home furnishings, electronics and appliances (NAICS 442, the combined Census series since 2022) is modest at 12.5%. Beauty/health/personal care (NAICS 446) and grocery (NAICS 445) round out the bottom at 7.7% and 7.1%.
Category (NAICS) 10-year avg lift 10-year min 10-year max 2025 lift Nov-Dec share of year Apparel stores (448) 48.1% 42.2% 75.4% 46.8% 22.7% Sporting goods/hobby/book/music (451) 37.4% 28.5% 47.1% 42.4% 22.2% Pure ecommerce (4541) 34.9% 25.8% 45.2% 27.5% 20.3% General merchandise (452) 21.6% 17.4% 27.2% 17.4% 19.0% Furniture/home/electronics (442) 12.5% 4.5% 24.8% 5.5% 17.4% Beauty/health/personal care (446) 7.7% 4.5% 10.1% 7.7% 17.7% Grocery (445) 7.1% 4.1% 9.4% 5.8% 17.5%
Where the lift is going
The category averages hide a more useful story: how each category's lift has moved year by year.
Three patterns matter for your 2026 plan.
Apparel is the most stable. Outside the 2020 spike, apparel ran 42% to 49% every single year. If you are an apparel brand, your category multiplier is the closest thing to a fixed natural law in retail. Plan to 45% to 48% and you will be within the historical range.
Pure ecommerce has compressed. Ecom ran 45% in 2017 and 27.5% in 2025. The trend line is down and consistent. As the ecom base grew (more shopping happens online every month of the year), the holiday peak became relatively smaller. If you are a pure-DTC brand benchmarking to Census ecom, anchor to the recent 3-year average of 28% to 29%, not the 10-year average of 35%. A 35% Q4 lift assumption in 2026 is sandbagged-baseline math from the 2015-2017 era.
Furniture and home is the most volatile. That category swung from 4.5% in 2023 to 24.8% in 2020 to 14.9% in 2024 to 5.5% in 2025. The reason: Census merged the separate electronics-and-appliance line into the 442 series starting in 2022, and big-ticket home spending is highly rate-sensitive. If you are in this category, do not anchor to a 10-year average. Anchor to your peer companies' last 2 quarters of demand and the Fed funds path.
General merchandise has compressed too. The 452 line ran 24-27% pre-2020 and is now sitting at 17% to 21%. The reason is everyday-grocery share of department stores, warehouse clubs, and supercenters has grown. If you sell into Target, Costco, or Walmart, the chain-wide multiplier is dragging your shelf demand.
Grocery and beauty are flat noise. Both ran between 4% and 10% the entire decade. There is no Q4 inventory pre-positioning story for personal care or food and beverage at the category level. If your beauty brand has a strong gifting program you can outperform, but you should benchmark to the 7% to 8% line and treat outperformance as a strategy result, not a baseline assumption.
The calculator: predict your Nov-Dec by category
Work an example. A $5M TTM apparel brand growing at 15% YoY: $5M times 22.7% gives a $1.14M prior-year Nov-Dec baseline at your current run rate. Grow that by 15% and you get $1.31M in predicted Nov-Dec revenue. At 40% gross margin, that means $785K in landed inventory cost on the shelf by mid-October. Add the 15% buffer for ad spend, shipping surge fees, and chargebacks ($196K) and you need $981K in cash available on October 31 to fund Q4.
If you do not have $981K in cash plus a credit facility for Q4 cover, you have two options. Order less inventory and accept the stockout risk. Or borrow against your AR or your inventory and accept the interest cost. There is no third option where you "spread the cash need out across November and December" because by the time November ships, your suppliers are already paid.
What to do if your plan is materially above the upper bound
The decision rule is simple. Look at the 10-year max column for your category in the table above. If your 2026 Q4 plan implies a lift higher than that max, you are either (a) genuinely growing faster than peers, which is rare and you should be able to prove from prior-year monthly run rate, or (b) building speculative inventory that will sit in your warehouse through Q1.
Apparel's max is 75.4% and that was the COVID year. The non-COVID max is 49.1% (2021). If you are planning a 60%+ Q4 lift in apparel in 2026, you are above any non-COVID year. Sporting goods max ex-COVID is 42.7% (2017). Ecom max is 45.2% (2017) and the trend since has been steadily down. Furniture/home/electronics has been bouncing in single digits the last three years; the 24.8% 2020 max is also COVID-distorted.
The truth about Black Friday for seven-to-eight-figure brands that nobody talks about: the biggest sales day becomes a cash-flow problem when planning is wrong. Best case, plan for 2x last year's units, not 3x. If your Q4 multiplier exceeds your category's 10-year max, you are not optimistic, you are building inventory that will haunt you through Q1.
How big is the 2026 holiday in absolute dollars?
No major forecaster has published a 2026-specific holiday number yet. Adobe Analytics, Salesforce, NRF, and Deloitte typically release between September and November. The most recent published numbers are 2025 actuals plus their late-2025 forecasts.
Adobe reported $257.8 billion in US online holiday spend for the 2025 Nov 1 to Dec 31 season, up 6.8% year-over-year (Jan 7 2026). That was the first quarter-trillion-dollar holiday and beat their pre-season $253.4B forecast. Salesforce reported $294B in US digital sales for 2025, up 4% (Jan 8 2026). NRF expects total US retail to grow 4.4% in 2026 ($5.6T full year), and 2025 holiday retail landed at $1.01-1.02T (+3.7-4.2% YoY). Deloitte forecast $305-310.7B in 2025 holiday ecommerce.
A plausible 2026 online holiday band is mid-to-high single digits YoY, building off Adobe's $257.8B 2025 actual. If Adobe's 2025 +6.8% pattern holds against NRF's +4.4% 2026 retail backdrop, US online holiday lands around $270-275B in 2026. That is not a published Adobe forecast, it is an extrapolation. Treat it as a planning anchor, not a number to quote.
The structural calendar shift matters more than the headline number. Amazon Prime Big Deal Days, Target Circle Week, and Walmart Deals (all in early October) have established a first peak that pulls demand forward. Salesforce data shows 29% of holiday sales now happen in November (three weeks before Cyber Week), up 5 percentage points from 2021. The practical read: your late-October cash-need timing is 2-3 weeks earlier than it was in 2018-2020. Build your supplier-payment calendar accordingly.
The Nov-Dec share view
Same data, different cut. The Nov-Dec share of full-year sales runs from 22.7% (apparel) down to 17.4% (furniture/home/electronics). The 5 percentage points between the top and bottom category looks small but it is the difference between roughly a quarter of your year happening in two months versus a sixth of your year.
For an apparel operator, that 22.7% Nov-Dec share is the same data point as the 48% Q4 lift. They describe the same underlying seasonality from two angles. The "share of year" framing is the one that maps cleanly to your cash-flow forecast. The "lift over Jan-Oct" framing is the one that maps cleanly to your inventory order quantity and ad-spend ramp.
What to do this week
Three actions.
Pull your monthly revenue for the last 24 months. Calculate your own brand's Q4 lift for 2024 and 2025. Compare to the category average above. If your brand's lift is more than 10 percentage points above the category, validate the data; if more than 10 below, you are likely under-marketing or under-investing in Q4 creative.
Lock your category multiplier for your 2026 plan. Pick one of: 10-year average, recent 3-year average, or your own brand's last 2-year average. We recommend the recent 3-year average for ecom (because the channel has compressed), the 10-year average for apparel (because it is stable), and your own brand's data for everything else.
Reverse-engineer your October 31 cash position. Use the calculator above. Whatever cash number it outputs, that is the date you need to have it. If you do not, you need to either trim the Q4 plan or arrange a working-capital line by mid-September, because no lender funds inside 30 days of when you need it.
If you want a senior partner to pressure-test your Q4 plan against the public-company benchmark and your own trailing data, that is what our interim CFO engagement is built for. We have helped 25+ brands optimize over $50M of Black Friday revenue annually and the conversation always starts with the category multiplier. See also our companion piece on working capital drag for DTC brands and the DTC cost-of-goods index for the input-cost side.
Sources and methodology
Source dataset. US Census Bureau, Monthly Retail Trade Survey (MRTS). API endpoint api.census.gov/data/timeseries/eits/mrts. Variables: cell_value, data_type_code, category_code, seasonally_adj, time_slot_name. Filter: data_type_code=SM (sales in $ millions), seasonally_adj=no (NSA, because we want the actual seasonal pattern visible, not a deseasoned series), for=us:1. Date range: 2016 through 2025 (120 monthly observations per category).
Categories. NAICS 448 (clothing and clothing accessories stores), NAICS 442 (furniture, home furnishings, electronics and appliance stores, combined Census series since the 2022 restatement), NAICS 445 (food and beverage stores, the grocery proxy), NAICS 446 (health and personal care stores, the best public proxy for beauty), NAICS 451 (sporting goods, hobby, musical instrument, book stores), NAICS 452 (general merchandise stores including department stores, warehouse clubs, supercenters), NAICS 4541 (electronic shopping and mail-order houses, the pure-ecom proxy).
Computation. For each category and year, lift = (mean of November and December monthly sales) / (mean of January through October monthly sales) - 1. The 10-year average is the unweighted mean of the 10 annual lifts (2016 to 2025). Min and max are the bounds across those 10 years. Nov-Dec share is (Nov + Dec sales) / (full calendar-year sales) for 2025 specifically.
Limitations. Beauty as a clean line is not available in MRTS. We use NAICS 446 (health and personal care stores, which includes drug stores like Walgreens and CVS) as the closest public proxy. We label this honestly as "beauty/health/personal care" throughout the post rather than "beauty," because the line is diluted with prescription and OTC drug sales. A purer beauty-only number would require Ulta or Sally Beauty 10-K data.
Pure ecommerce (NAICS 4541, electronic shopping and mail-order houses) includes Amazon and significant B2B and non-DTC volume. The 10-year lift pattern is still useful as a public benchmark, but a DTC operator's own Q4 lift can be materially higher than the Census channel average, because Amazon's enormous Jan-Oct base flattens the channel-wide ratio.
NAICS 4431 (electronics and appliance stores) was folded into the 442 line in the Census 2022 series revision. The 442 series for 2016 to 2025 reflects the combined restated series end-to-end, so the 10-year comparison is apples-to-apples, but the writer should note "electronics is bundled with furniture and home in the public data" when comparing to a DTC electronics brand.
The 2020 apparel lift of 75.4% is a COVID structural outlier. The Jan-Oct 2020 apparel baseline collapsed during lockdowns, inflating the Nov-Dec ratio. The 9-year ex-2020 apparel average is closer to 45%, which is what we recommend operators plan to.
Update cadence. This post will be refreshed annually each May after the prior calendar year's Q4 data is fully revised in the Census MRTS release cycle. Next planned refresh: May 2027 with the 2017-2026 window.
Frequently asked questions
how much should my dtc apparel brand grow in november and december vs the rest of the year?
If you run an apparel brand, your Nov-Dec months should average about 48% above your Jan-Oct monthly run rate. That is the 10-year Census average across 2016-2025 (NAICS 448). The range is tight too. Every non-COVID year fell between 42% and 49%. If you are planning materially above 49%, you are forecasting above any year in the last decade.
is q4 still a big lift for ecom or has it flattened out?
It has compressed. Pure ecommerce (NAICS 4541, electronic shopping and mail-order houses) lifted 45% in 2017 and just 27.5% in 2025. The 10-year average is 34.9%, but the trend is down. As ecom's Jan-Oct baseline grew, the holiday peak became relatively smaller. Plan to the recent 3-year average (28% to 29%), not the 10-year average, if you want to be conservative.
what percentage of annual revenue comes from november and december?
It depends on your category. In 2025, apparel did 22.7% of its full year in Nov-Dec, sporting goods 22.2%, pure ecom 20.3%, general merchandise 19.0%, beauty 17.7%, grocery 17.5%, and furniture/home/electronics 17.4%. That is roughly one-fifth to one-quarter of the year happening in two months for the discretionary categories, and a smaller share for everyday-consumption ones.
how do i calculate the working capital i need to fund q4 inventory?
Start with your predicted Nov-Dec revenue (your TTM revenue times your category's Nov-Dec share of annual sales, then grown by your expected YoY rate). Multiply that by your cost-of-goods percentage to get the landed-cost inventory you need on the shelf. Add a 15% buffer for ad spend, shipping surge fees, and chargebacks during Q4. That total is the cash you need on hand by October 31.
is grocery and personal care really not seasonal? december feels huge for us
Grocery and beauty are barely seasonal in the aggregate Census data. Grocery lifts about 7.1% in Nov-Dec and beauty 7.7%. The reason your December feels huge is that absolute dollar volume is higher across the entire holiday season, but the share of your year happening in Nov-Dec is similar to the share in May-June. If you are a DTC beauty brand with a gifting story, you can outperform the category average, but you should still benchmark to the public-company line.
how should i forecast q4 if i just hit five million in trailing-12-month revenue and i am in apparel?
Apparel does 22.7% of its year in Nov-Dec. So $5M times 22.7% equals $1.14M as your prior-year Nov-Dec baseline at your current pace. Apply your expected YoY growth (say 15%) and you get $1.31M in predicted Nov-Dec revenue. At 40% gross margin you need about $785K in landed inventory cost by mid-October, plus a $200K buffer. The calculator on this page runs the same math interactively.
why did q4 lift compress for ecommerce after 2021?
Two reasons. First, ecom's Jan-Oct base grew faster than its Q4 peak as the channel matured. The Q4 ratio compressed mechanically, not because consumers shifted away from holiday. Second, the rise of October promotions (Amazon Prime Big Deal Days, Target Circle Week, Walmart Deals) pulled some holiday demand into October, so November and December stopped being the only peak window. Plan for the late-October cash need to land 2-3 weeks earlier than the legacy mental model says.
what is the single biggest mistake operators make in q4 planning?
Picking a multiplier off feel instead of off category data. We have watched founders go from a $400K Q4 to a $600K Q4 plan with nothing in the category data supporting the jump. The 10-year MRTS data is the anchor. Best case, plan for 2x last year's units. Not 3x. If your category's 10-year max lift is 49% and you are forecasting 70%, you are not optimistic, you are building speculative inventory that will sit in your warehouse through Q1.