
Pricing
Psychological Pricing for DTC: Charm Pricing, Anchoring, and Framing That Actually Convert
Psychological pricing uses how buyers read numbers, not just the number itself. The levers with the strongest evidence for DTC are charm endings (.99/.95), price anchoring through a good-better-best decoy, and per-day framing. They lift conversion or mix, but only when they match your brand and survive the contribution-margin math.
Key Takeaways
- Charm pricing (.99/.95) lifts unit sales by roughly 24% on average, with single catalog tests as high as 35%, but the effect nearly vanishes on an isolated product page where the buyer already knows the price.
- A good-better-best decoy tier shifts buyers toward the target option, by roughly 10 to 30 percentage points of mix in real catalogs, raising average order value without touching net price.
- Per-day and per-use framing has lifted participation by roughly 15 to 40% in subscription and giving studies, and fits supplements, memberships, and consumables best.
- Charm endings signal value and can erode a premium brand: keep rounded prices on hero SKUs and confine .99 to sales or entry tiers.
- Every tactic has to clear the margin test: at a 60% gross margin one added point of discount costs roughly 1.7 points of contribution, and the DTC median net margin band is only 3 to 10%.
Most DTC pricing decisions get made in a spreadsheet cell and never tested. You pick a number that hits your target margin, round it, and move on. That is leaving money on the table in both directions: some prices are too low to capture what buyers would happily pay, and others convert worse than a number a few cents away would.
Psychological pricing is the discipline of pricing for how people actually read numbers, not how a calculator does. DTC stands for direct-to-consumer, brands selling straight to the shopper, where you own the price tag and the test. The evidence behind these tactics is real and decades deep, but so is the downside: the same .99 that lifts a value brand can quietly cheapen a premium one. This is the operator's version, with the studies behind each lever and the margin math that decides whether it is worth doing.
The three levers with the strongest evidence
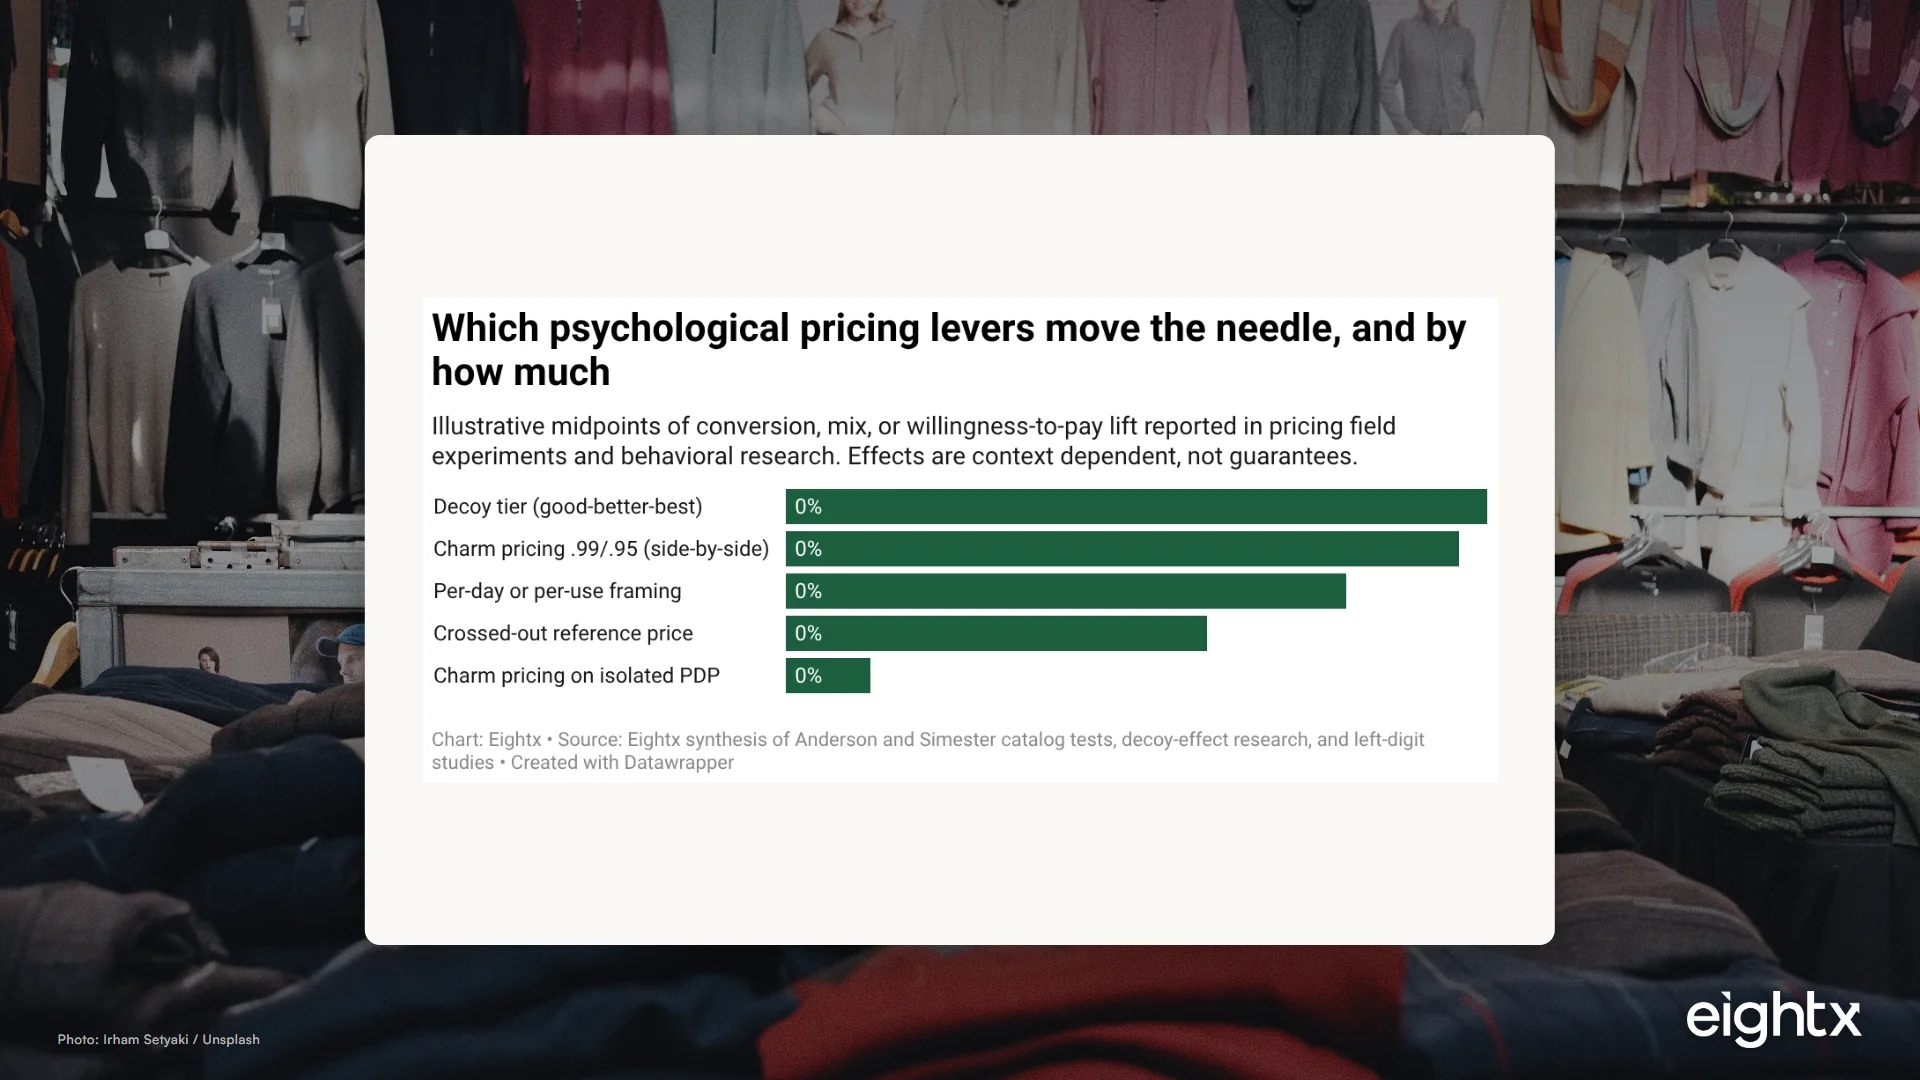
There are dozens of named pricing tricks. Three carry enough hard evidence to bet real money on: charm pricing, anchoring through a decoy, and per-day framing. Here is roughly how much each moves, based on field experiments and behavioral research.
Read the chart as direction and order of magnitude, not gospel. The single most important takeaway is that the same tactic, charm pricing, sits near the top of the chart in one context and near the bottom in another. Context is the whole game.
When I talk to founders running a brand this size, the instinct is almost always to reach for the discount lever first, because it is the one they know works. The levers that actually protect the business sit higher up the chart and do not touch net price at all. That reframe, from "what can I knock off" to "how do I make the value legible," is most of the job.
Charm pricing: the left-digit effect, and where it dies
Charm pricing means ending a price in .99, .95, or a 9, like $39 instead of $40. It works because of the left-digit effect: buyers anchor on the leftmost digit, so $39 gets filed as "thirty-something" while $40 is "forty-something," even though the gap is a dollar.
The cleanest proof is Anderson and Simester's catalog field experiments, published in 2003, where a clothing retailer mailed otherwise identical catalogs with different price endings. The same item sold better at $39 than at $34, a lower price. Across the broader charm-pricing literature, 9-ending prices lift unit sales by roughly 24% on average versus the adjacent round price, with individual catalog tests running as high as 35%. Treat 24% as your planning prior and 35% as the ceiling, not the expectation. It is no accident that about 60.7% of advertised retail prices already end in 9 and only about 7.5% end in 0.
The catch matters more than the headline. A Data Colada replication tested the popular claim that the left-digit effect is much stronger when prices appear side by side, like a sale price next to a crossed-out original. With two high-powered samples, the direction held but the effect was only marginally significant and noticeably smaller than the original underpowered study suggested. The honest read: side-by-side comparison probably amplifies charm pricing, but less reliably than the popular telling. And on a truly isolated product page, for a product your customer already knows the price of, charm pricing does very little. So the play is not "make every price end in 9." It is to use charm endings where buyers compare numbers on the same screen: collection pages, sale tags, and tiered tables.
Anchoring and the decoy: the highest-return move
Anchoring is the most underused lever in DTC, and it is the one that raises average order value without discounting. The idea is to put a reference number in front of the buyer that makes your target price look like the smart choice.
The strongest version is the decoy, or asymmetric dominance. Dan Ariely's Economist subscription example showed it: when buyers chose between a cheap online-only plan and a pricier print-plus-online plan, most took the cheap one. Add a third print-only option priced the same as the bundle but obviously worse, and the share choosing the expensive bundle jumped from 32% to 84%.
That 52-point swing is a single, famous experiment, so do not expect it on your store. A peer-reviewed replication found a more typical lift, with target choice rising from about 54% to 65%, an 11-point gain, and Simon-Kucher's analysis of decoy pricing documents the same pattern across software, telecom, and consumer products. A realistic planning range for DTC is roughly 10 to 30 percentage points of mix toward the target tier.
For a DTC brand, that means building a good-better-best lineup on purpose. Price your "better" tier close to "best" but with one clearly missing benefit, label "best" as most popular, and watch mix move up. This is the difference between a single $48 product and a $32 / $48 / $52 ladder where $52 becomes the obvious pick. You did not discount anything. You changed the comparison. The same logic powers a free-shipping threshold: when we talk to founders about average order value, the ones who tune a $45 or $49 threshold deliberately, to give shoppers a reason to add one more item, are using the same anchoring instinct without cutting a cent off price.
Framing: per-day and per-use pricing
Framing restates the same price in a form that feels smaller. Per-day and per-use framing turns "$300 a year" into "$0.85 a day." Buyers evaluate the small number, a behavior economists call narrow bracketing. Gourville's 1998 pennies-a-day research is the anchor here: a payroll-giving study found that "85 cents a day" drew 52% acceptance versus 30% for the economically identical "$300 a year," and subscription field tests showed per-issue framing was 10 to 40% more effective at signing new subscribers.
It fits some DTC models far better than others. For subscription supplements, memberships, and consumables, a per-day or per-use cost is honest and powerful: "less than a dollar a day" or "about $0.50 per serving" is a real way to describe value. For one-time, high-ticket purchases it can backfire, because spelling out the duration draws attention to the commitment. Use it where the math genuinely is small per use, not as a sleight of hand.
The margin test every lever has to pass
Here is where I slow founders down. A conversion lift is not free if you bought it with price. Our discount benchmark data shows that at a 60% gross margin, a single added point of discount costs roughly 1.7 points of contribution margin, and the DTC median net margin band is only 3 to 10%. There is not much room.
The operators who get this right think in contribution margin, not gross. The way the best of them frame it: CM1 is gross profit, CM2 takes out shipping, payment processing, and commissions, and CM3 takes out variable marketing, and they want CM3 to stay above 20 to 25%. When we talk to founders running a brand this size, the discount ceiling is almost always a margin decision, not a nerve decision. "We cap promos at 20% because the margins are already tight" is a line we hear constantly. The table below shows why the room is so thin.
| Revenue cohort | Gross margin | Contribution margin | Net margin |
|---|---|---|---|
| Under $5M | 55-68% | 20-28% | 2-7% |
| $5-10M | 55-65% | 22-30% | 5-10% |
| $10-50M | 50-62% | 18-25% | 3-8% |
| $50M+ | 50-60% | 22-30% | 6-12% |
That is why anchoring and tiering beat reflexive discounting: they lift conversion or mix without cutting your net price. The trap is using charm pricing as a backdoor discount. Dropping from $40 to $39.99 is fine; dropping to $34.99 because "it ends in 9" is a 12.5% price cut you did not budget. Keep the markup and margin math straight before you touch a price ending, and if you sell through retailers, remember that your MAP policy constrains what endings you can even advertise, and that the same SKU has to clear margin in both channels, which is the whole problem of pricing for wholesale and DTC at once.
Where it bites a premium brand
The single biggest mistake premium DTC brands make is reaching for .99 because it "works." Odd endings signal value and deal; round prices signal quality and conviction. Prestige-pricing research consistently finds higher, rounder prices lift perceived quality, and the placebo-pricing literature shows buyers can literally experience an expensive product as more effective.
The more common mistake, though, is the opposite one. When we talk to founders selling a genuinely premium product, the pattern we see again and again is underpricing out of fear: "we are average to lower than average on price, our margins are okay but they should be better, and there is no reason we should not charge more." Cold traffic calling you expensive is not a pricing problem; it is a trust problem, and the fix is justifying the price, not cutting it.
So the rule splits by positioning. Mass and mid-market brands can lean on charm endings across the catalog. Premium brands should keep clean round prices on hero SKUs and flagship tiers, and confine .99 to genuine sale moments or lower-priced entry products. The summary below maps each lever to where it fits and where it breaks.
| Lever | Typical effect | Best fit | Boundary condition |
|---|---|---|---|
| Charm pricing (9-ending) | ~24% unit-sales lift (up to 35%) | Mass / mid-market; sale tags; collection pages | Largely dies on an isolated product page; cheapens premium brands |
| Decoy / good-better-best | +10 to 30 pts mix to target tier | Any brand with 3+ tiers | Needs a genuinely dominated decoy; can confuse if overdone |
| Per-day / per-use framing | ~15 to 40% participation lift | Subscriptions, memberships, consumables | Backfires on big one-time purchases by naming the commitment |
| Reference-price anchoring | ~10-15% perceived-value lift | Sales, bundles, tiered tables | Fake or inflated anchors erode trust and risk MAP / ad-policy issues |
Anchoring and bundle pricing are safe for everyone, because they raise perceived value instead of advertising a discount. For the full architecture this all sits inside, see our ecommerce pricing strategy guide.
The brands that win on pricing do not have a cleverer trick. They have a sharper sequence: raise perceived value with anchoring and tiering first, reserve charm endings for the moments buyers are actually comparing numbers, and never ship a price change until they have run the demand response all the way down to contribution margin.
What to do about it
- Audit where your prices are seen side by side. Charm endings only earn their keep in comparison contexts. Apply .99/.95 on collection pages, sale tags, and tier tables first, and stop worrying about it on standalone hero pages.
- Build a deliberate decoy. Create a three-tier good-better-best lineup where the middle tier is priced close to the top but clearly missing one benefit. Label the target tier as most popular and measure the mix shift, not just conversion.
- Frame per-use where it is true. For subscriptions and consumables, add an honest per-day or per-serving line next to the total. Skip it on big one-time purchases.
- Run every change down to contribution margin. Before any price ending or tier move ships, model the demand response and subtract COGS, shipping, and ad spend. A 24% unit lift that drops you below break-even is a loss.
- Protect your brand altitude. If you are premium, keep round hero prices and reserve charm endings for sales. Lead with anchoring and bundling, which build value perception rather than erode it.
- A/B test, do not roll out blind. Effect sizes are context-specific. Treat the figures here as priors, then let your own traffic settle the question on revenue per visitor, not conversion alone.
Sources and methodology
This article synthesizes pricing field experiments and behavioral research with Eightx margin guidance. The charm-pricing figures are anchored on Anderson and Simester's 2003 catalog field experiments in Quantitative Marketing and Economics, where randomized price endings showed a 9-ending item outselling the same item at a lower round price. The roughly 24% average lift (and up to 35% in single tests) is the widely cited aggregate across the charm-pricing literature and industry synthesis, not a single named meta-analysis, so we frame it as a planning prior.
The side-by-side boundary condition comes from the Data Colada replication of left-digit bias, which found the comparison effect real in direction but only marginally significant and smaller than earlier underpowered work claimed. Decoy and good-better-best figures draw on Ariely's Economist example (a 52-point swing in a single experiment), a peer-reviewed replication showing a more typical 11-point lift, and Simon-Kucher's decoy pricing analysis; we use a 10 to 30 point planning range. Per-day framing magnitudes come from Gourville's 1998 pennies-a-day research and the related subscription and giving studies.
Margin figures come from the Luca DTC profit-margin benchmarks, which aggregate Finaloop 2025 and A2X / Ecom CFO 2026 P&L data: gross margin 50 to 65%, contribution margin around 25% at the median, and net margin 3 to 10%. The 1.7-points-of-contribution cost per added discount point is derived from a 60% gross-margin starting point. Price-ending prevalence (about 60.7% ending in 9) is an industry synthesis figure, not a single experiment. The operator-voice observations are drawn from anonymized founder conversations and reflect patterns, not any single named brand. Chart values are illustrative midpoints of published ranges and are labeled as such; validate with your own A/B tests on revenue per visitor before acting.
Frequently Asked Questions
does charm pricing (.99) still work for ecommerce in 2026?
Yes, but conditionally. Across the charm-pricing literature, 9-ending prices lift unit sales by about 24% on average, and the effect is strongest when a buyer sees prices side by side, like a sale price next to a crossed-out original. On an isolated product page where the shopper already knows your price, the lift is small or near zero. Test it on collection pages and sale tags, not as a blanket rule.
what is price anchoring and how do dtc brands use it?
Anchoring is showing a reference number that makes your target price look reasonable by comparison. In DTC that usually means a crossed-out original next to the current price, or a good-better-best lineup where a high tier anchors the middle one. The strongest version is the decoy: add a third option that is clearly worse than your target, and more buyers pick the target because it now looks like the obvious best value.
what is the decoy effect in good-better-best pricing?
The decoy effect, or asymmetric dominance, is when adding a deliberately inferior option makes a nearby option look better and pulls buyers toward it. In a good-better-best ladder, a 'better' tier priced close to 'best' but with fewer features makes 'best' the obvious pick. In real catalogs this shifts mix toward the target tier by roughly 10 to 30 percentage points, lifting average order value without changing total conversion.
does charm pricing hurt a premium or luxury brand?
It can. Odd endings like .99 and .95 read as value or deal positioning, while round prices read as quality and confidence. Prestige-pricing research consistently finds higher, rounder prices raise perceived quality. If you are a premium brand, keep round prices on hero SKUs and flagship tiers, and confine charm endings to explicit sales or lower-priced products so you do not train shoppers to see you as a discount label.
what is per-day pricing framing and when should i use it?
Per-day or per-use framing restates a total price as a small recurring amount, like '$0.85 a day' instead of '$300 a year.' Buyers evaluate the small number rather than the full commitment, and studies in subscription and giving contexts show participation lifts of roughly 15 to 40%. It works best for subscriptions, memberships, and consumables like supplements. Be careful with big one-time purchases, where naming the duration can backfire.
how do i use psychological pricing without looking gimmicky?
Pick levers that match your positioning and run each one down to contribution margin. Use anchoring and tiering, which raise perceived value rather than scream discount, before you reach for .99 everywhere. Keep your hero pricing clean, reserve charm endings for sales, and A/B test instead of rolling out blind. The goal is to make the value legible, not to trick anyone, because a tactic that erodes trust costs more than the conversion it buys.
how do i know if a pricing change is worth it after margin?
Model the demand response all the way down to contribution margin, not just conversion. At a 60% gross margin, one added point of discount costs roughly 1.7 points of contribution, and the DTC median net margin band is only 3 to 10%. A 24% unit lift bought with a price cut can still be a net loss, so test on revenue per visitor and check the math before you roll anything out.